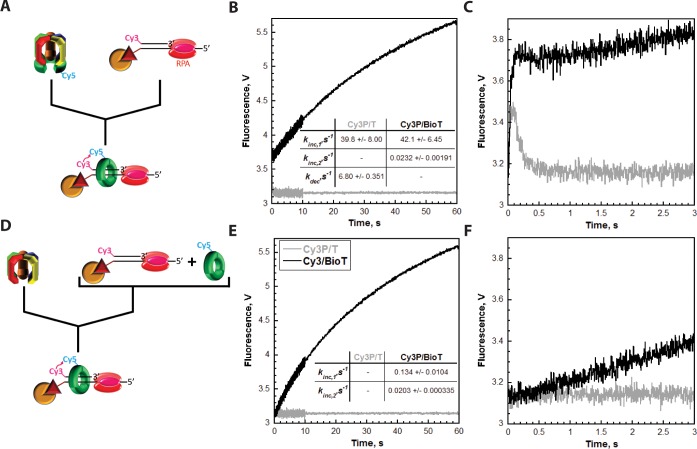
Figure 4.
RPA prohibits diffusion of PCNA along ssDNA. Each FRET trace represents the average of at least seven shots. For comparison, all FRET traces are normalized to the same starting value (at t = 0.005 s). (A) Schematic representation of the experimental procedure for panel B. (B) Cy5-PCNA (100 nM homotrimer) was preincubated with RFC (100 nM) in the presence of ATP. This preformed RFC·Cy5-PCNA·ATP complex was mixed with Cy3-labeled DNA (200 nM Cy3P/BioT or Cy3P/T), RPA (285 nM), and ATP in a stopped-flow instrument, and the FRET signal was followed. The loading traces for Cy3P/T (gray) and Cy3P/BioT (black) DNA substrates are shown, and each was fit to a double-exponential equation. The calculated rate constants are reported for each. (C) Initial 3 s of the FRET traces from panel B. (D) Schematic representation of the experimental procedure for panel E. (E) Cy5-PCNA (100 nM homotrimer) was preincubated with Cy3-labeled DNA (200 nM Cy3P/BioT or Cy3P/T), RPA (285 nM), and ATP. This solution was mixed with RFC (100 nM) and ATP in a stopped-flow instrument, and the FRET signal was followed. The loading trace for the Cy3P/BioT DNA substrate (black) was fit to a double-exponential equation, and the calculated rate constants are reported. The loading trace for the Cy3P/T DNA substrate (gray) did not change over time. (F) Initial 3 s of the FRET traces from panel E.

