

Abstract
It is challenging to differentiate the mechanical properties of synergist muscles in vivo. Shear wave elastography can be used to quantify the shear modulus (i.e. an index of stiffness) of a specific muscle. This study assessed the passive behavior of lower leg muscles during passive dorsiflexion performed with the knee fully extended (experiment 1, n = 22) or with the knee flexed at 90° (experiment 2, n = 20). The shear modulus measurements were repeated twice during experiment 1 to assess the inter‐day reliability. During both experiments, the shear modulus of the following plantar flexors was randomly measured: gastrocnemii medialis (GM) and lateralis (GL), soleus (SOL), peroneus longus (PL), and the deep muscles flexor digitorum longus (FDL), flexor hallucis longus (FHL), tibialis posterior (TP). Two antagonist muscles tibialis anterior (TA), and extensor digitorum longus (EDL) were also recorded. Measurements were performed in different proximo‐distal regions for GM, GL and SOL. Inter‐day reliability was adequate for all muscles (coefficient of variation < 15%), except for TP. In experiment 1, GM exhibited the highest shear modulus at 80% of the maximal range of motion (128.5 ± 27.3 kPa) and was followed by GL (67.1 ± 24.1 kPa). In experiment 2, SOL exhibited the highest shear modulus (55.1 ± 18.0 kPa). The highest values of shear modulus were found for the distal locations of both the GM (80% of participants in experiment 1) and the SOL (100% of participants in experiment 2). For both experiments, deep muscles and PL exhibited low levels of stiffness during the stretch in young asymptomatic adults, which was unknown until now. These results provide a deeper understanding of passive mechanical properties and the distribution of stiffness between and within the plantar flexor muscles during stretching between them and thus could be relevant to study the effects of aging, disease progression, and rehabilitation on stiffness.
Keywords: ankle joint, elastography, passive tension, plantar flexors, stretching
Introduction
The mechanical properties of the passive muscle play an important functional role for the completion of movements (Proske & Morgan, 1999). For instance, muscle contractures, defined as a decrease in muscle length and an increase in passive muscle stiffness (Fergusson et al. 2007), dramatically reduce the joint range of motion during walking (Attias et al. 2016) or upper‐limb tasks (de Groot et al. 2011). Plantar flexor muscles are in particular at risk from muscle contractures as a common complication from neurological and musculoskeletal conditions (Farmer & James, 2001; Fergusson et al. 2007). For instance, the incidence rate of contractures is 52% within 6 months after stroke (Kwah et al. 2012), and 55% in nursing home residents (Offenbächer et al. 2014). Consequently, assessing the passive mechanical properties of the plantar flexor muscles is crucial from both research and clinical perspectives (Magnusson, 1998; Gajdosik, 2001).
In animal studies, it is possible to target one specific muscle by measuring the passive force/stress produced in response to a lengthening/stress stimulus (e.g. Herbert & Crosbie, 1997). In humans, the classical approach to assess passive muscle properties consists of applying passive joint rotations and measuring the global joint torque developed in resistance to the motion (Magnusson, 1998; Gajdosik, 2001). However, the passive torque does not differentiate the different structures crossing the joint such as the synergistic muscles, tendons, joint capsule, nerves, skin, and fasciae (Weppler & Magnusson, 2010). Beyond a better understanding of the plantar flexors biomechanics, a precise knowledge about the inter‐ and intra‐muscle distribution of passive stiffness in vivo would allow the clinicians to optimize treatment strategies, by focusing attention specifically on the stiffer muscles.
Ultrasound shear wave elastography has been developed to estimate the stiffness of biological tissues in vivo (Bercoff et al. 2004; Gennisson et al. 2013). Muscle shear modulus measured using ultrasound shear wave elastography is strongly linearly related to the Young's modulus (Eby et al. 2013). Consequently, this technique has also been used to provide a localized estimation of muscle stiffness (Brandenburg et al. 2014; Hug et al. 2015). Previous studies estimated the passive behavior of plantar flexors by measuring the shear modulus of the gastrocnemius medialis (GM) muscle during passive dorsiflexion using shear wave elastography (e.g. Maïsetti et al. 2012; Chernak et al. 2013; Hug et al. 2013; Chino & Takahashi, 2015; Freitas et al. 2015; Hirata et al. 2015, 2016; Taniguchi et al. 2015; Nakamura et al. 2016, 2015, 2016). To our knowledge, only two studies completed the investigation on the three heads of the triceps surae [GM, the gastrocnemius lateralis (GL) and the soleus (SOL)] (Hirata et al. 2015, 2016). Interestingly, between‐muscle variations were reported, with the higher shear modulus found for GM, followed by GL and SOL (Hirata et al. 2015, 2016). However, in those studies, the shear modulus was measured in only one muscle region. As muscle stiffness is expected to vary along the muscle length (Yucesoy et al. 2006), it is important to measure different regions within the same muscle to provide a more in‐depth description of stiffness variations within plantar flexors. Further, the previous experiments (Hirata et al. 2015, 2016) assessed the stiffness while the knee was fully extended, limiting the interpretation to this position. In particular, the knee in a flexed position should enable more of the muscles that do not cross the knee to stretch, compared with the gastrocnemii (e.g. soleus). Finally, no study focused on the smaller deep plantar flexor muscles [i.e. flexor digitorum longus (FDL), flexor hallucis longus (FHL), tibialis posterior (TP)] and the lateral peroneus longus (PL), which might significantly influence the global passive torque.
The main aim of the present study was to characterize the variations of stiffness between and within the lower leg muscles during a passive ankle dorsiflexion. For this purpose, ankle rotations were performed with the knee fully extended (experiment 1), and with the knee flexed (experiment 2). Triceps surae muscles (GM, GL and SOL), deep muscles (FDL, FHL and TP) and the lateral PL were investigated. Two antagonists [tibialis anterior (TA) and extensor digitorum longus (EDL)] were also recorded. A secondary aim was to assess the inter‐day reliability of shear modulus measurement.
Methods
Participants
Healthy young adults volunteered to participate in experiment 1 (knee fully extended; n = 22; 7 females; 21.5 ± 2.4 years; height 175 ± 8 cm; weight 71.3 ± 7.3 kg) and experiment 2 (knee flexed; n = 20; 4 females; 21.5 ± 2.1 years; height 174 ± 9 cm; weight 68.0 ± 8.1 kg). Participants were not allowed to perform strength or flexibility training 72 h before the time of the study. The protocol was approved by the Institutional Ethics Committee (Tours Ouest I, reference: no. CCP MIP‐08). Participants were informed of the nature of the study before providing a written informed consent. The procedures were conducted according to the principles expressed in the Declaration of Helsinki.
Instrumentation
Ergometer
Participants lay supine on an isokinetic dynanometer (Con‐Trex MJ, CMV AG, Dubendorf, Switzerland) used to passively rotate the ankle with the knee: (i) fully extended (hip at 0°, experiment 1) or (ii) flexed at 90° (hip at 90°, experiment 2). The tested ankle was randomly selected. The knee and hip joint angles were set using a gravity inclinometer (Silverline Tools Ltd, ref.250471, Lufton, UK) in accordance with clinical recommendations (Cleland & Koppenhaver, 2010). The ergometer axis was aligned with the presumed ankle center of rotation (Fig. 1). An ankle angle of 90° was set as our reference (i.e. 0°, neutral ankle position). Ankle angle and torque were recorded using an analog/digital converter (1 kHz, PowerLab ADInstruments Inc., Colorado Springs, CO, USA).
Figure 1.
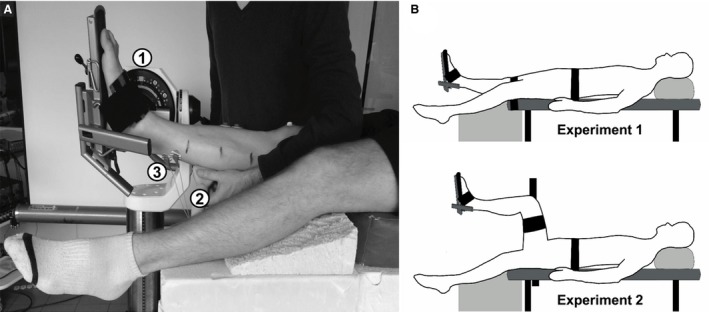
Experimental setup (A) and test conditions (B) used for the studies. (A) The subject was supine with the ankle strapped in the isokinetic ergometer (1). A shear measurement was recorded by the ultrasonic transducer (2) during a passive dorsiflexion with a surface electromyographic activity (3) monitored at the same time. (B). Two test conditions were used: a knee extended (experiment 1) and a knee flexed (experiment 2).
Muscle shear modulus
An Aixplorer ultrasound scanner (Supersonic Imagine, v. 6.1, Aix‐en‐Provence, France) coupled with one linear transducer arrays (2–10 MHz, SL10‐2 or 4–15 MHz, SL15‐4, Supersonic Imagine, Aix‐en‐Provence, France) was used in shear wave elastography mode (musculoskeletal preset). There was no temporal smoothing (no persistence) and an intermediate spatial smoothing level (5/9). This technique has been described previously in detail (Bercoff et al. 2004; Gennisson et al. 2010, 2013). Briefly, a pushing beam is created to generate the propagation of a shear wave within the muscle. Then, ultrafast ultrasound sequences are used to measure the shear wave velocity (V s) using a time‐of‐flight algorithm (Catheline et al. 2008) in each pixel of the map. Assuming a linear elastic behavior (Bercoff et al. 2004; Gennisson et al. 2010), a shear modulus (μ) is calculated using V s as follows:
| (1) |
where ρ is the muscle mass density (1000 kg m−3).
The transducer was aligned to measure the shear modulus along the muscle lengthening direction (Lacourpaille et al. 2012). Thus, the measurement was performed in a similar way that what can be done with conventional material testing for muscle force‐length or stress‐strain relationships (Gennisson et al. 2010; Eby et al. 2013). This was considered as representative of the in vivo response to lengthening. A transistor‐transistor logic pulse was sent by the ultrasound scanner at each shear modulus measurement (i.e. each second). As the measure lasted < 50 ms (Bercoff et al. 2004), this trigger was used to synchronize each shear modulus measure with the ankle angle, passive torque and sEMG amplitude.
The procedures for ultrasound transducer locations and B‐mode ultrasound images are described in detail in Supporting Information Figures S2 and S3, and a brief description is provided in this section. Transducer locations were marked on the skin using waterproof ink. All the measurements were performed by the same examiner who had extensive experience (> 2 years of daily practice) with both ultrasound and shear wave elastography. GM, GL, PL, TA and EDL were scanned using the SL15‐4 (4–15 MHz) US transducer. SOL and deep plantar flexors were scanned using the SL10‐2 (2–10 MHz) US transducer. Special care was taken to minimize the pressure between the transducer and the skin. Different proximo‐distal regions were determined for GM, GL and SOL based on anatomical guidelines used to treat plantar flexor pathological stiffness in neurologic conditions (Sekiya, 1991; Parratte et al. 2002; Yi et al. 2016). For each gastrocnemius muscle we defined the proximal and distal musculotendinous junctions (MTJ) to determine three equal muscle segments (33% of muscle length): a ‘distal’ segment (dis), an ‘intermediate’ segment (mid), and a ‘proximal’ segment (pro). The MTJ were identified using B‐mode ultrasound (Bianchi & Martinoli, 2007) as depicted on Supporting Information Figure S1. Two measurements were also performed for the SOL. The first one was set on the distal part of the leg (30% of muscle length from medial malleolus, SOLdis), and the proximal one underneath the GM (50% of muscle length from medial malleolus, SOLpro). The other muscles were scanned in one location. Dynamic flexion and extension of the toes were used to locate FDL and FHL in the deep posterior compartment. FHL was assessed from the lateral side of the leg (~ 30% of lower leg length from the lateral malleolus). FDL and TP were assessed from the medial side of the leg. FDL was scanned at ~ 50% of lower leg length from the medial malleolus. TP was identified from a medio‐transverse view at ~ 60% of lower leg length from the medial malleolus, with its central aponeurosis lying between the tibia and the fibula, and relative to the previous FDL and FHL muscles (Bianchi & Martinoli, 2007). The transducer was then cautiously rotated to the longitudinal view. Finally, PL and the dorsiflexors (EDL and TA) were scanned in the superficial plane, in the third proximal of the leg. PL was identified at the lateral side of the fibula, TA was obtained laterally to the tibial crest, and EDL was found by shifting the transducer laterally from TA.
Protocol
For each experiment, the ankle dorsiflexion maximal range of motion (ROM) was first measured during a slow passive stretch (2° s−1). The ankle rotation was stopped by the participants that pushed a button using the ergometer remote control when they felt the maximal tolerable stretch in the posterior structures (i.e. onset of pain). Three repetitions were used for which the participants were blindfolded to the angle visualization. The maximum angle measured using the ergometer was considered the maximal dorsiflexion ankle angle. Secondly, the ankle dorsiflexion angle was set to 80% of the maximum ROM, because EMG response of plantar flexors is reported to rise significantly from that point (McNair et al. 2001). Thirdly, five ankle rotations from 40° of plantar flexion to 80% of the maximum ROM were performed at 5° s−1 to account for muscle conditioning (Nordez et al. 2006). Fourthly, one shear modulus measurement was performed for each previously determined location in a randomized order during an ankle dorsiflexion (2° s−1; Figure S3 for typical shear modulus map‐images for each muscle). Between each measurement, 1 min of rest was observed. At the end of the procedure, participants were asked to perform three voluntary maximal isometric dorsiflexions and plantar flexions (MVC) to normalize the root mean square of the sEMG signals (sEMG‐RMS). The first experiment (knee fully extended) was repeated after at least 48 h to assess the inter‐day reliability of the shear modulus measurements.
Surface electromyography
During both experiments, to ensure that muscles were passive, the electromyographic (sEMG) signals of GM, GL, SOL and TA were simultaneously recorded, using hydrogel adhesive surface electrodes (KendallTM 100 foam‐series, Covidien, Mansfield, MA, USA). Electrodes were placed on the skin according to the SENIAM recommendations (Hermens et al. 2000). Due to probe locations placed on the skin, some slight changes in SENIAM locations had to be done several times. Careful checks were always performed using ultrasound to ensure that electrodes were placed on the considered muscle in an appropriate manner. Both the sEMG amplitude and the ankle torque were provided in real‐time to the investigators and the participant to ensure that stretching procedures were performed in a passive state.
Data analysis
Data were processed using MATLAB® scripts (The MathWorks Inc., Natick, MA, USA). Angle and torque signals were filtered using a Butterworth low pass filter (cutoff frequency: 10 Hz). The torque was corrected for gravity.
Ultrasound videos were exported from Aixplorer's software into ‘mp4’ format and sequenced in ‘jpeg’ images. Image processing converted each pixel of the color map into a shear modulus value based on the recorded color scale. Mean shear modulus values were averaged over the largest region of interest (ROI) that avoided aponeurosis and artifacts. The mean area of the ROIs ranged between 77 mm² (for the deep TP) and 152 mm2 (for GMmid).
The sEMG‐RMS values were calculated over a 300‐ms window centered on each shear modulus measurement (1 Hz) and normalized to the maximal values reached during MVC. If normalized sEMG‐RMS values were higher than 1% EMG of MVC, muscles were considered to be active during the stretch procedure and the corresponding trials were excluded from further consideration (McNair et al. 2001).
The slack angle (defined as the angle from where passive tension begins to rise, Herbert et al. 2002) was visually determined in raw shear modulus–ankle angle relationship by two trained experimenters blinded to the trial, as previously described (Hug et al. 2013; Le Sant et al. 2015). Mean differences of ~ 2° were found between the two examiners during a pilot test–retest. As the ankle ROM varied between participants, the ankle angle was normalized to the 80% of maximum dorsiflexion angle to display the relationships between shear modulus and ankle angle. Linear interpolation was used to calculate the shear modulus every 5% of the tested range of motion.
Statistics
Statistical analysis was performed using STATISTICA® software (v.10; Statsoft Inc., Tulsa, OK, USA). Distributions consistently passed the Shapiro–Wilk test used to test normality. For experiment 1, inter‐day reliability was determined using the two‐way random intraclass correlation coefficient (ICC), the standard error in measurement (SEM), and the coefficient of variation (CV) (Hopkins, 2000) at 80% of maximal ROM. Then data of the two sessions were averaged for each trial for further analysis. The variability of shear modulus between participants was quantified using the SD/mean ratio (expressed in %) calculated at 80% of the maximal ROM.
For each experiment, a one‐way repeated analysis of variance (anova) was performed to determine whether the shear modulus measured at 80% of the maximal ROM differed between inter‐ and intra‐muscle transducer locations. A second anova was conducted to compare the slack angle between muscles. Post‐hoc tests were performed using a Bonferroni correction for multiple comparisons. The statistical significance was set at P < 0.05. Descriptive statistics were reported using the mean and standard deviation (mean ± SD).
Results
Experiment 1 (knee fully extended)
During data processing a low quality of shear modulus measurement (artifacts, small ROI or void areas within the ROI) was observed for ~ 3% of all recordings of both sessions (20 on 616 videos: 10/44 for TP, 4/44 for FDL, 5/44 for FHL, and 1/44 for TA, respectively). Consequently, the reliability was assessed on 22 participants, except for TP (n = 14), FDL (n = 20), FHL (n = 19) and TA (n = 21), for which at least one measurement was missing. In addition, the anovas were performed for 20 participants with all the muscles for at least one session (except the TP, see below).
The inter‐day reliability of the shear modulus measured at 80% of maximal ROM is reported in Table 1. The SEM of shear modulus ranged from 0.7 kPa (TA) to 7.4 kPa (GMpro). The ICC ranged between 0.79 (TP) and 0.97 (GLdis). The CV values were below 15% for all muscles/transducer locations. Considering the weak reliability for the TP muscle (CV: 17.8%, SEM: 2.07 kPa, ICC: 0.79) and the number of missing participants (8/22), this muscle was not considered for further analysis.
Table 1.
Inter‐day reliability of the shear modulus measured at 80% of maximal ROM
| Leg Compartment | Muscle layer | Transducer location | n | Mean (SD) (kPa) | SEM (kPa) | ICC | CV (%) |
|---|---|---|---|---|---|---|---|
| Posterior | Superficial | GMdis | 22 | 128.5 (27.3) | 6.0 | 0.96 | 5.3 |
| GMmid | 22 | 106.0 (26.2) | 6.0 | 0.95 | 6.2 | ||
| GMpro | 22 | 87.1 (24.7) | 7.4 | 0.92 | 10.0 | ||
| GLdis | 22 | 67.1 (24.1) | 4.6 | 0.97 | 7.8 | ||
| GLmid | 22 | 65.6 (18.8) | 6.2 | 0.90 | 11.4 | ||
| GLpro | 22 | 57.2 (17.4) | 4.9 | 0.93 | 7.2 | ||
| SOLdis | 22 | 10.2 (2.7) | 1.1 | 0.85 | 12.3 | ||
| SOLpro | 22 | 9.0 (3.0) | 1.0 | 0.91 | 13.9 | ||
| Deep | FDL | 20 | 14.4 (5.1) | 2.4 | 0.81 | 14.5 | |
| FHL | 19 | 11.1 (3.3) | 1.3 | 0.86 | 13.8 | ||
| TP | 14 | 11.0 (4.2) | 2.1 | 0.79 | 17.8 | ||
| Lateral | Superficial | PL | 22 | 15.7 (5.3) | 1.5 | 0.92 | 13.9 |
| Anterior | Superficial | TA | 21 | 7.3 (2.3) | 0.7 | 0.92 | 12.2 |
| EDL | 22 | 8.1 (2.7) | 1.0 | 0.88 | 13.3 |
CV, coefficient of variation of the measurement; dis, distal‐leg transducer location; EDL, extensor digitorum longus; FDL, flexor digitorum longus; FHL, flexor hallucis longus; GL, gastrocnemius lateralis; GM, gastrocnemius medialis; ICC, interclass correlation coefficient factor; mid, mid‐leg transducer location; PL, peroneus longus; pro, proximal‐leg transducer location; SEM, standard error of measurement; SOL, soleus; TA, tibial anterior; TP, tibialis posterior.
Data are shown as mean values (± standard deviation).
The shear modulus–ankle angle relationships of each muscle/location are depicted in Fig. 2. There was a main effect of location (P < 0.001) for the shear modulus measured at 80% of maximal ROM. Shear modulus values were highest for the GM (128.1 ± 27.8 kPa for GMdis, 106.1 ± 24.2 kPa for GMmid, 88.1 ± 24.7 kPa for GMpro) and the GL (64.2 ± 20.6 kPa for GLdis, 63.2 ± 15.8 kPa for GLmid, 56.5 ± 17.7 kPa for GLpro) whatever the location (all P‐values < 0.001, Fig. 3). GM shear modulus values were higher than the GL whatever the location (all P‐values P < 0.001). The lowest shear modulus values for plantar flexors were found for PL (15.6 ± 5.5 kPa) and deep muscles (FDL 14.4 ± 4.8 kPa, and FHL 11.1 ± 3.2 kPa). The shear modulus values for the dorsiflexors were the lowest of all probe locations (TA 7.3 ± 2.2 kPa and EDL 8.2 ± 2.7 kPa), which could be attributed to the fascicle shortening in these muscles during passive dorsiflexion. Moreover, intra‐muscle differences in shear modulus values were only found on GM (P < 0.001, Fig. 3), for which higher shear modulus was measured at the distal transducer location (GMdis, 128.1 ± 27.8 kPa) than the more proximal transducer locations [GMmid, 106.0 ± 26.2 kPa (P < 0.001); and GMpro, 88.1 ± 24.7 kPa (P < 0.001)]. No significant differences were found between locations for either GL (P = 1.00) or SOL (P = 1.00).
Figure 2.
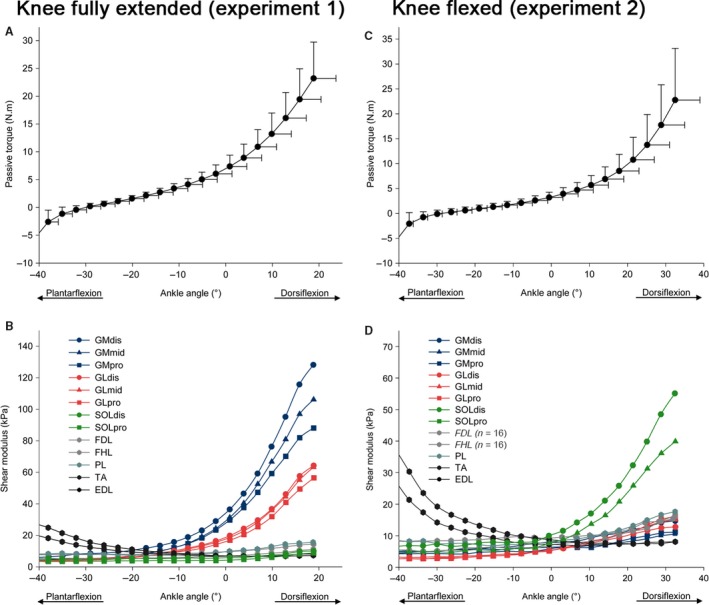
Passive torque–angle and shear modulus–angle (standard deviation bars were omitted for clarity) relationships during the passive dorsiflexion, in both experiments: in an extended knee position (experiment 1, A and B), and in flexed knee position (experiment 2, C and D). GM: gastrocnemius medialis; GL: gastrocnemius lateralis; SOL: soleus; FDL: flexor digitorum longus; FHL: flexor hallucis longus; TP: tibialis posterior; PL: peroneus longus; TA: tibial anterior; EDL: extensor digitorum longus. dis: distal‐leg transducer location; mid: mid‐leg transducer location; pro: proximal‐leg transducer location.
Figure 3.
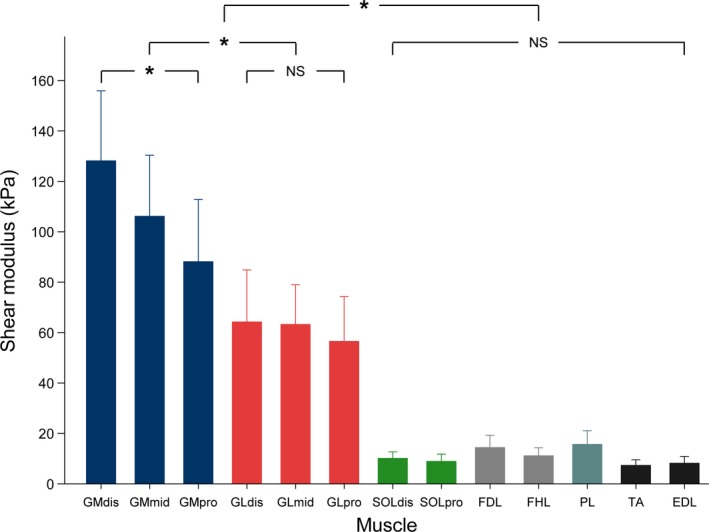
Histogram of mean shear values for each muscle, at 80% of maximal range of motion (experiment 1, knee fully extended). Repeated measure anova with P < 0.05 followed by Bonferroni post‐test. Data are shown as mean values ± standard deviation. *P < 0.001; NS: non‐significant at P < 0.05. GM: gastrocnemius medialis; GL: gastrocnemius lateralis; SOL: soleus; FDL: flexor digitorum longus; FHL: flexor hallucis longus; PL: peroneus longus; TA: tibial anterior; EDL: extensor digitorum longus. dis: distal‐leg transducer location; mid: mid‐leg transducer location; pro: proximal‐leg transducer location.
The inter‐individual variability of shear measurement (SD/mean) at 80% of the maximal ROM was: 21.7% for GMdis, 22.8% for GMmid, 28.1% for GMpro, 32.1% for GLdis, 24.9% for GLmid, 31.4% for GLpro, 25.9% for SOLdis, 32.9% for SOLpro, 33.6% for FDL, 28.7% for FHL, 35.0% for PL, 30.4% for TA, and 32.9% for EDL. The order of the shear modulus values was very consistent between subjects (Fig. 4). Thus, the highest shear modulus value was found for the GM muscle for every participant (Fig. 4), and for the distal transducer location (GMdis) for 80% of participants (n = 16), followed by the GMmid location (70%, n = 14) and then by GMpro (70%, n = 14). Slack angles of the plantar flexor muscles in a flexed knee position are depicted in Table 2. There was a main effect of muscle on the slack angle (P < 0.001). The slack angle of both heads of the gastrocnemii did not differ significantly (P = 1.00) and occurred at a more plantar flexed angle (~ 24°) than the other muscles (P < 0.001). No significant differences between the other muscles were reported (all P‐values > 0.12).
Figure 4.
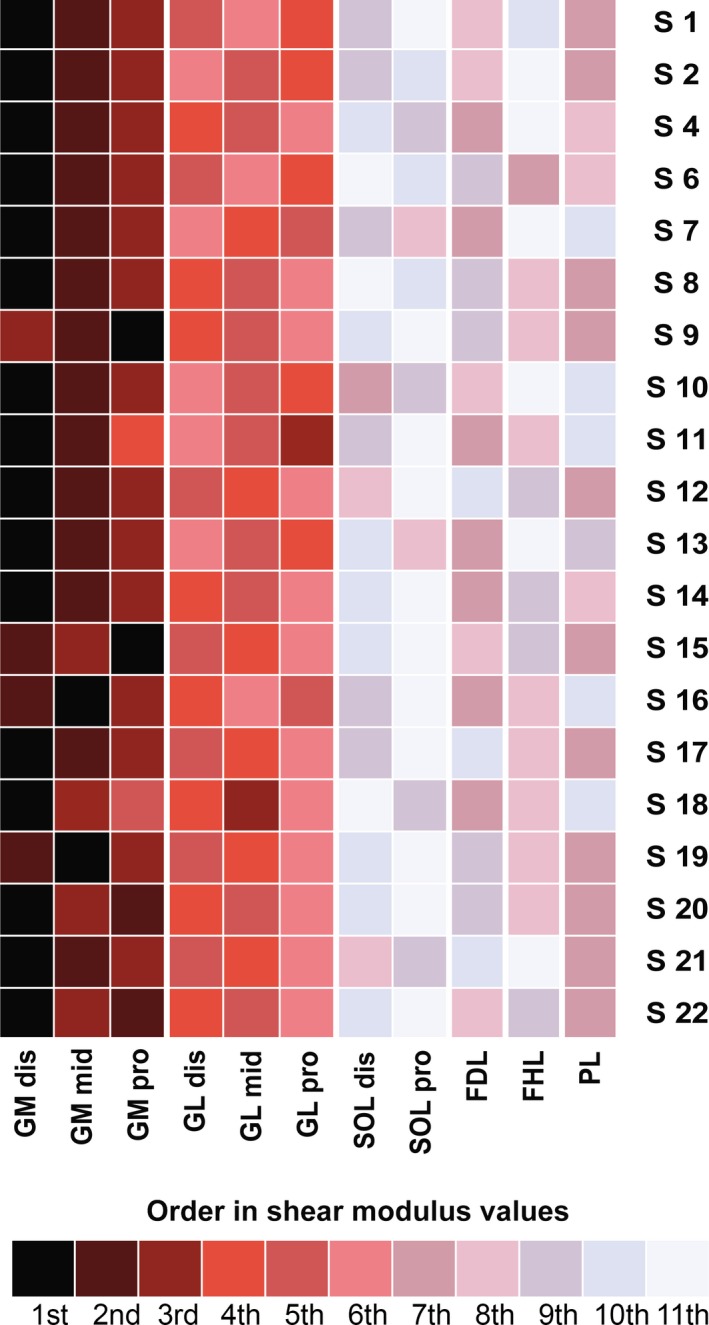
Order of shear modulus values recorded by probe location, for each participant (experiment 1, knee fully extended). GM: gastrocnemius medialis; GL: gastrocnemius lateralis; SOL: soleus; FDL: flexor digitorum longus; FHL: flexor hallucis longus; PL: peroneus longus; TA: tibial anterior; EDL: extensor digitorum longus. dis: distal‐leg transducer location; mid: mid‐leg transducer location; pro: proximal‐leg transducer location.
Table 2.
Slack angle of the plantar flexors measured with the knee fully extended (experiment 1) and with the knee flexed (experiment 2)
| Transducer Location | GM dis | GM mid | GM pro | GL dis | GL mid | GL pro | SOL dis | SOL pro | FDL | FHL | PL | |
|---|---|---|---|---|---|---|---|---|---|---|---|---|
| Slack angle (°) | Experiment 1 | −25.0 (2.6) | −24.0 (2.7) | −23.2 (2.2) | −24.6 (2.5) | −23.5 (2.1) | −23.2 (2.2) | −6.3 (3.8) | 3.1 (3.1) | −8.0 (5.7) | −8.9 (5.9) | −8.9 (5.0) |
| Experiment 2 | −11.0 (2.3) | −9.3 (2.7) | −9.0 (2.5) | −9.6 (2.5) | −9.5 (1.7) | −9.3 (2.4) | −7.4 (2.7) | −1.6 (2.9) | – | – | −7.8 (3.4) | |
dis, distal‐leg transducer location; EDL, extensor digitorum longus; FDL, flexor digitorum longus; FHL, flexor hallucis longus; GL, gastrocnemius lateralis; GM, gastrocnemius medialis; mid, mid‐leg transducer location; PL, peroneus longus; pro, proximal‐leg transducer location; SOL, soleus; TA, tibial anterior; TP, tibialis posterior.
Data are shown as mean values (± standard deviation).
Experiment 2 (knee flexed at 90°)
A low quality of shear modulus measurements was observed for 3% of the videos (eight of 260 videos: 4/20 for the FDL, 4/20 for the FHL), corresponding to 6/20 participants with at least one missing value for these muscles. Thus, to reduce the bias due to insufficient number of measurements of the FDL and the FHL (Dumville et al. 2006), these two muscles were not included in the anovas. Consequently, anovas were performed for the 11 remaining transducer locations with no missing participants. As depicted in Fig. 2D, the shapes of the shear modulus–angle relationships for FDL and FHL were close to those observed in experiment 1 (maximal values reached at 80% of the maximal ROM in experiment 2: 15.4 ± 4.1 kPa for the FDL (n = 16), and 16.2 ± 5.0 kPa for the FHL (n = 16)).
The maximal shear modulus values reached 14.7 ± 2.9 kPa for GMdis, 10.5 ± 2.3 kPa for GMmid, 11.2 ± 3.0 kPa for GMpro, 12.8 ± 4.2 kPa for GLdis, 15.1 ± 6.0 kPa for GLmid, 16.2 ± 4.5 kPa for GLpro, 55.1 ± 18.0 kPa for SOLdis, 39.9 ± 12.5 kPa for SOLpro, 17.6 ± 5.7 kPa for PL, 8.1 ± 2.2 kPa for TA, and 8.1± 2.1 kPa for EDL. There was a main effect of location for the shear modulus measured at 80% of maximal ROM (P < 0.001) (Fig. 5). Shear modulus values were higher for SOL (both transducer locations) than all other locations (all P‐values < 0.001). In addition, significant differences were found between the two locations within SOL (Fig. 5, P < 0.001), with the highest value measured at the distal site (SOLdis) than the proximal site (SOLpro). No significant differences were found between locations for either GM (P = 1.00) or GL (P = 1.00).
Figure 5.
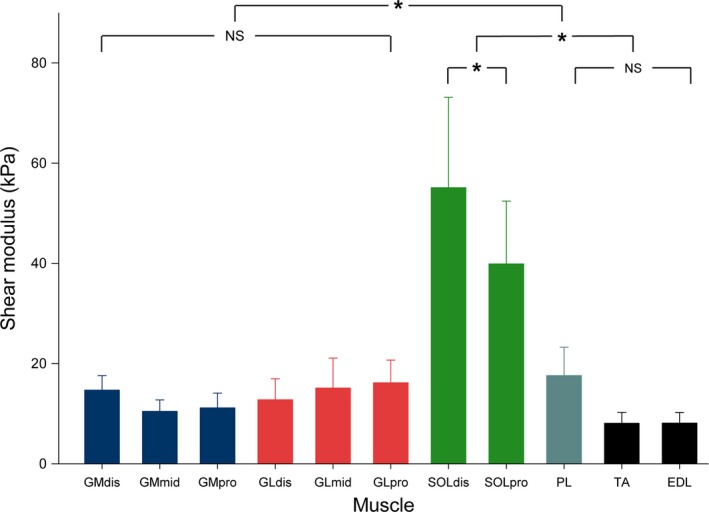
Histogram of mean shear values for each muscle, at 80% of maximal range of motion (experiment 2, knee flexed). Repeated measure anova with P < 0.05 followed by Bonferroni post‐test. Data are shown as mean values ± standard deviation. *P < 0.001; NS: non‐significant at P < 0.05. GM: gastrocnemius medialis; GL: gastrocnemius lateralis; SOL: soleus; PL: peroneus longus; TA: tibial anterior; EDL: extensor digitorum longus. dis: distal‐leg transducer location; mid: mid‐leg transducer location; pro: proximal‐leg transducer location.
The inter‐individual variability of shear measurement (SD/mean) at 80% of the maximal ROM was: 19.8% for GMdis, 21.5% for GMmid, 26.4% for GMpro, 32.7% for GLdis, 39.4% for GLmid, 28.0% for GLpro, 32.7% for SOLdis, 31.4% for SOLpro, 32.3% for PL, 26.8% for TA, and 26.4% for EDL. As for experiment 1, the order of the shear modulus values was very consistent between subjects (Fig. 6). Thus, the highest shear modulus value was systematically found for the SOL muscle, on the SOLdis transducer location (100%, n = 20), and then for SOLpro (100%, n = 20) (Fig. 6).
Figure 6.
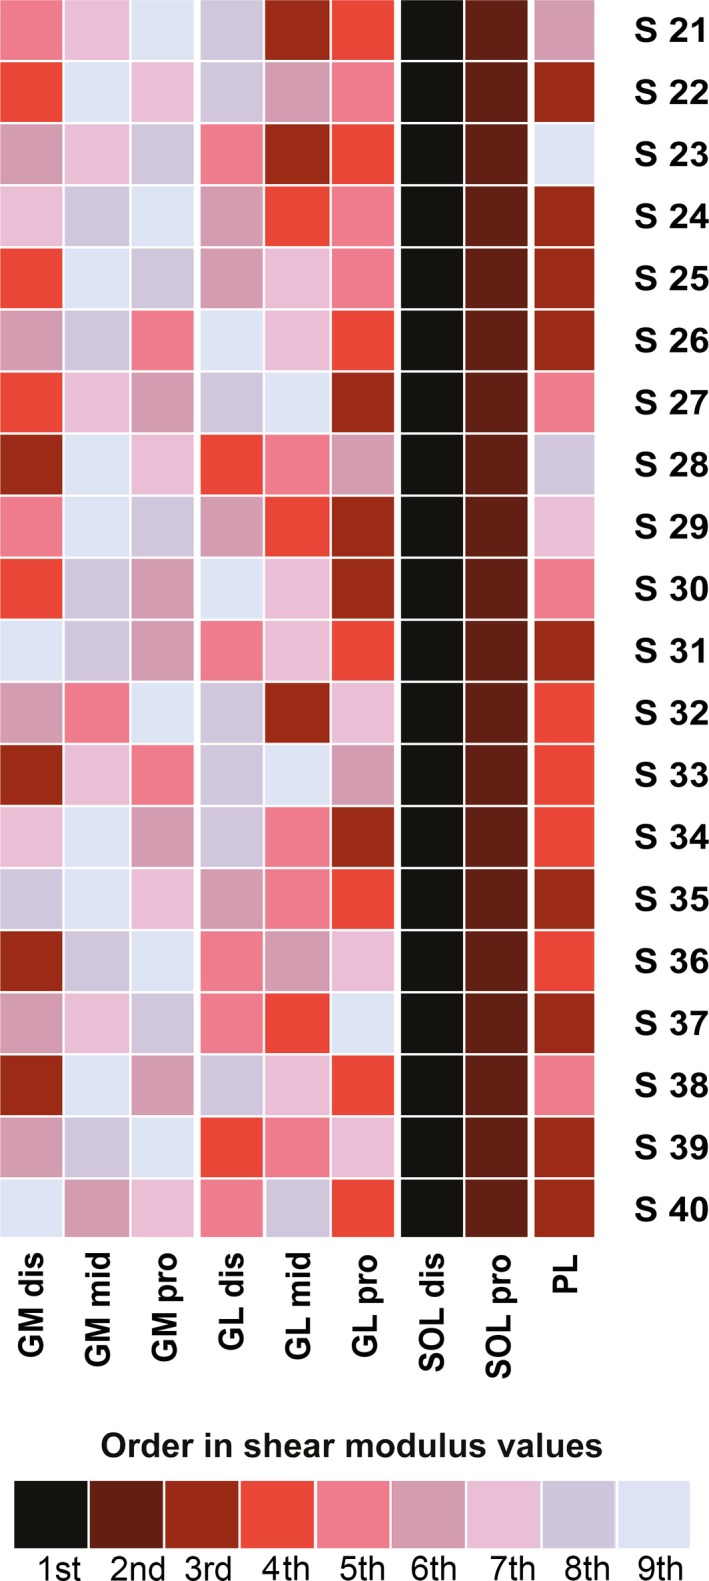
Order of shear modulus values recorded by probe location, for each participant (experiment 2, knee flexed). GM: gastrocnemius medialis; GL: gastrocnemius lateralis; SOL: soleus; PL: peroneus longus; TA: tibial anterior; EDL: extensor digitorum longus. dis: distal‐leg transducer location; mid: mid‐leg transducer location; pro: proximal‐leg transducer location.
Slack angles of the plantar flexor muscles in a flexed knee position are depicted in Table 2. A main effect of muscle (P < 0.001) was found. Significant differences were found between SOLpro and all the other locations (P < 0.001), and also between GMdis‐SOLdis (P < 0.001) and GMdis‐PL (P = 0.002).
Discussion
This present study showed a high variability of passive stiffness among lower leg muscles during a passive ankle dorsiflexion. When the knee was fully extended, the GM muscle was stiffer than GL and the other plantar flexor muscles. When the knee was flexed, the SOL muscle exhibited the highest stiffness. When considering GM with the knee extended and SOL with the knee flexed, distal regions were stiffer than the proximal ones. In addition, regardless of the knee angle, deep plantar flexors exhibited a small increase in stiffness during passive stretching, indicating that they were under very little tension during passive dorsiflexion.
A good inter‐day reliability of shear modulus measurements was found with CV values below 15% except for the TP muscle, which exhibited a higher CV (17.8%). In particular, reliability of the shear modulus measured during dynamic conditions was the highest for the gastrocnemii (CV values range: 5.3–10.0%) and the soleus (CV values range: 12.3–13.9%) muscles. Because of the within‐muscle variability of the shear modulus, it is important that the measurements are performed within muscle region such that results can be compared between participants and studies. For the GM muscle, reliability was similar to that obtained by Nakamura et al. (2016) (CV between 5 and 10%) and was slightly better than that reported by Freitas et al. (2015) (SEM of 14.8 kPa for GM at 75% of ankle maximum ROM in dorsiflexion). The novelty of the present study is the assessment of the inter‐day reliability of the other plantar flexor muscles. Although the deep plantar flexor muscles exhibited much lower shear modulus values at 80% of maximal ROM, the SEM and CV values were within the same range as those of the more superficial muscles, further confirming the good reliability of the muscle shear modulus measurement during passive stretching. As previously reported for the abdominal muscles (MacDonald et al. 2016), due to smaller muscle regions, artifacts and void areas, it was slightly more challenging to perform shear modulus measurements for the deep lower limb muscles than for the triceps surae muscles. This is likely because of their localization under the superficial posterior leg compartment (gastrocnemii and soleus), and because of interactions between contractile and connective tissue elements. For instance, the posterior deep muscle compartment (FDL, FHL and TP) is composed of thin muscles, close to the main posterior neurovascular bundle (posterior tibial vessels and the tibial nerve) (Kwiatkowski & Detmer, 1997; Bianchi & Martinoli, 2007) and underneath the lower limb deep transverse fascia (Benjamin, 2009). Consequently, the US transducer orientation was adjusted in real time to maintain a longitudinal view of the targeted structure during the motion and US images clear of non‐muscular structures. This may explain the lower reliability of the shear modulus measurements, and the increased number of missing data for the deeper muscles.
The exponential increase in shear modulus found during the passive dorsiflexions (Fig. 2B,D) has been reported for GM, GL and SOL (Maïsetti et al. 2012; Hug et al. 2013; Freitas et al. 2015; Hirata et al. 2015, 2016). In addition, our results are consistent with recently reported stiffness variations between triceps surae muscles, with a higher shear modulus found for GM than GL and then SOL (Hirata et al. 2015, 2016; Taniguchi et al. 2015) in a fully extended knee position. The novelty in this study is the knee flexed condition. In this situation, SOL reached the highest shear modulus values. The changes in the inter‐muscle difference in shear modulus within triceps surae muscles between both experiments can be associated with the anatomical configuration of these muscles (i.e. bi‐articular for gastrocnemii and mono‐articular for soleus) and to their passive force‐length relationships (Maïsetti et al. 2012; Finni et al. 2015).
We also report new results for the deep posterior plantar flexors (FDL and FHL), the lateral PL, and the antagonist EDL. In particular, the passive behavior of small deep plantar flexors (FDL, FHL) and of the lateral PL during passive stretching was not previously determined in the literature. With respect to their anatomical insertions on the sole, these muscles are involved in rearfoot stabilization and foot propulsion (Zelik et al. 2015). It has been suggested in the past that their distal tendon excursion could interfere with the ankle dorsiflexion range of motion. For example, in the medio‐retromalleolar region, the FHL tendon may be forced to merge through its fibro‐osseous tunnel, leading to an impingement syndrome, which could impair the ankle motion (Schulhofer & Oloff, 2002). In the present study, the shear modulus of the deep plantar flexor muscles remained very low, indicating that they are under very little tension during passive dorsiflexion, regardless of the knee position. As these muscles have smaller physiological cross‐sectional areas (Arnold et al. 2010) and lower moment arms in dorsiflexion compared with the triceps surae (McCullough et al. 2011), this suggests that their contributions to the ankle passive torque are negligible. This result was not expected, considering that the deep plantar flexors have been estimated to account for ~ 20% of the resultant isometric torque during isometric submaximal contractions (Arndt et al. 1998).
This study also focused on the within‐muscle differences in stiffness, with multiple proximo‐distal shear measurements for triceps surae muscles. The shear modulus of GM (experiment 1) muscle was systematically higher within the distal than the proximal muscle regions, demonstrating that this muscle is inhomogeneous and displays regional differences in stiffness during passive stretching. In addition, slack angles were similar for the multiple locations within the GM muscle. This is consistent with a recent ultrasound study suggesting that the slack length is similar in all the fascicles of this muscle (Herbert et al. 2015). Consequently, the proximo‐distal differences in shear modulus cannot be linked to spatial variations in slack length. Thus, we found three possible explanations for the spatial variations in shear modulus. First, using MRI, it has been demonstrated that the muscle CSA is lower in the distal regions than in the proximal ones for the GM muscle (Fukunaga et al. 1992). Consequently, the stress applied to the distal region should be higher compared with the proximal region. Secondly, ex vivo studies showed that the passive tension exerted at the muscle region close to the extremity being stretched is higher compared with the opposite muscle region (Maas et al. 2001; Yucesoy et al. 2006). This consideration strengthens the hypothesis of a higher stress applied to the distal regions of GM and SOL muscles during an ankle rotation with a fixed knee position. Thirdly, considering a higher stress in distal regions, specific adaptations to chronic loadings may be induced in the distal region of the GM close to the distal MTJ. In particular, the repeated stress may stimulate the collagen synthesis by the extracellular matrix, and may per se induce an increase in the local stiffness to optimize the efficiency of the force transmission and the tissue structure maintenance (for review, see Kjær, 2004).
In experiment 2, we also demonstrated a disto‐proximal increase in shear modulus for the SOL muscle. However, contrary to the GM muscle in experiment 1, we reported a difference in slack angle within the SOL muscle, with a more plantar‐flexed slack angle for SOLdis (−7.4 ± 2.7°) than SOLpro (−1.6 ± 2.9°). As the shear modulus–angle curves were flatter in the knee flexed condition, it is possible that the slack length determination was less reliable for experiment 2. We therefore assessed the intra‐operator reliability for the three heads for the triceps surae. All standard errors of measurements were lower than 2.1°, making us confident that differences between transducer locations were not due to methodological artifacts. We performed further analysis to account for the difference in slack angle. For that purpose, the shear modulus values of both regions were compared for the same change in ankle angle relative to the slack angle (corresponding to ankle angles of 27.3° and 33.1° for distal and proximal locations, respectively). This additional analysis showed, as with that for the gastrocnemii, a significant difference (P = 0.03) in the shear modulus between SOLdis (45.14 ± 15.7 kPa) and SOLpro (39.9 ± 12.5 kPa) and distal locations. Thus, the difference in slack angle alone did not fully account for the difference between the raw shear modulus values of SOLpro and SOLdis, which cannot be explained by a simple shift of the shear modulus–angle relationship (Nordez et al. 2010). Therefore, this result suggests differences in the intrinsic mechanical properties or stress applied to both regions of the SOL muscle. This finding can be related to the complex anatomy of the SOL muscle, like the non‐uniform architecture (Agur et al. 2003) or the intramuscular nerve distribution (Sekiya, 1991) throughout the muscle volume. These results show for the first time in vivo that different regions of a muscle can behave in mechanically different ways. Future studies should try to correlate these results with spatial variability of muscle recruitment, which has been reported during isometric contractions for GM (Csapo et al. 2015) and SOL (Campbell et al. 1973).
Interestingly, the slack length of all the plantar flexors appeared at a more dorsiflexed angle than the angle at which the net passive torque was zero (Fig. 2). Previous studies showed that the slack angle of the Achilles tendon occurs earlier than that of the gastrocnemii muscles during the plantar flexion (about 40° in plantar flexion; Hug et al. 2013; Hirata et al. 2016). It is possible that this early rise in Achilles tendon tension is responsible for the passive torque produced in the plantar flexion direction before muscle slack angles. It was hypothesized that non‐muscular structures (e.g. fasciae or pulleys) can explain this result (Hug et al. 2013). Although the results of the present study support this hypothesis, these structures remain to be identified.
Finally, our results show a considerable variability of shear modulus values between healthy participants (range 19.6–39.4%) for a same amount of perceived passive stretch (80% of the maximal stretch sensation). This result may indicate differences in stretch tolerance between participants that have been reported previously discussed in the literature (e.g. Weppler & Magnusson, 2010). It should be noted that, calculated at a fixed angle common to all participants, the inter‐individual variability was even slightly higher (range 24.3–38.9%). Thus, we are confident that our results also show a substantial variability between subjects in the muscle mechanical properties. Interestingly, our results highlight that this variability in shear modulus values is not linked to a variability in the order of shear modulus values between locations (Figs 4 and 6). Thus, stiff and less stiff healthy subjects almost have the same locations with the highest and lowest shear modulus values. This indicates that the different participants responded in a similar qualitative way to the stretch regardless of the level of stiffness recorded.
The present study demonstrates the ability of ultrasound shear wave elastography to map the plantar flexor muscle stiffness at the inter‐ and intra‐muscle levels, with overall good reliability. Future work will need to evaluate the stiffness distribution in pathological populations who present muscle contracture due to neuronal and musculoskeletal conditions (Fergusson et al. 2007). Contractures are first characterized by a reduction in joint mobility and an increased resistance to passive motion, and later by a muscle shortening (atrophy, loss of sarcomeres, accumulation of connective tissue and fat, cf. review by Gracies, 2005). Clinically, the localization of muscle contractures and spatial changes in muscle stiffness are difficult to assess. Manual examination provides overall and subjective outcomes within the plantar flexor muscles. The protocol used in the present study may be applied to patients, to identify the locations that actually suffer from contracture in order to better target treatments, such as stretching, posture or drug injections. Besides, if confirmed in a patient population, the good reliability of elastographic measurements would support their use for follow‐up and treatment efficiency assessment purposes.
Conclusion
Taking advantage of shear wave elastography to measure localized muscle stiffness, the present study quantified the variability of shear modulus within and between the main lower limb muscles during a passive dorsiflexion with the knee extended and flexed. The GM muscle exhibited the larger increase in stiffness during the ankle dorsiflexion when the knee was extended (experiment 1), whereas the SOL muscles exhibited the higher increase in stiffness when the knee was flexed (experiment 2). Further, there was within‐muscle difference in stiffness for GM (experiment 1) and SOL (experiment 2) with the most distal regions being stiffer than the proximal ones. The same methodology could be used to assess local changes and spatial variations in muscle stiffness with aging, disease progression, and rehabilitation.
Author contributions
G.L.S., A.N., R.G., R.A. and S.F. conceived and designed the experiments. G.L.S. and R.A. conducted the experiments. G.L.S., A.N. and R.G. analyzed and interpreted the findings. G.L.S., A.N. and R.G. contributed to the manuscript editing. G.L.S., A.N., R.A., S.F., F.H., and R.G participated in the critical revision of the manuscript. G.L.S., A.N., R.A., S.F., F.H., and R.G. approved the submitted version of the article.
Supporting information
Fig. S1. Musculo‐tendinous junctions (MTJ) of gastrocnemius medialis (GM) and g. lateralis (GL) with B‐Mode ultrasound images associated.
Fig. S2. Transducer location site for each shear measurement.
Fig. S3. Shear map for each measurement site.
Acknowledgements
The studies were financially supported by a grant from the University of Nantes (interdisciplinary program), and the Région des Pays de la Loire (QUETE project). The funders had no role in the design, data collection and analysis, manuscript editing or publication. The authors have declared no completing interests. The authors would like to thank Dr. Lilian Lacourpaille for his technical support.
References
- Agur AM, Ng‐Thow‐Hing V, Ball KA, et al. (2003) Documentation and three‐dimensional modelling of human soleus muscle architecture. Clin Anat 16, 285–293. [DOI] [PubMed] [Google Scholar]
- Arndt AN, Komi PV, Brüggemann GP, et al. (1998) Individual muscle contributions to the in vivo achilles tendon force. Clin Biomech 13, 532–541. [DOI] [PubMed] [Google Scholar]
- Arnold EM, Ward SR, Lieber RL, et al. (2010) A model of the lower limb for analysis of human movement. Ann Biomed Eng 38, 269–279. [DOI] [PMC free article] [PubMed] [Google Scholar]
- Attias M, Chevalley O, Bonnefoy‐Mazure A, et al. (2016) Effects of contracture on gait kinematics: a systematic review. Clin Biomech (Bristol, Avon) 33, 103–110. [DOI] [PubMed] [Google Scholar]
- Benjamin M (2009) The fascia of the limbs and back – a review. J Anat 214, 1–18. [DOI] [PMC free article] [PubMed] [Google Scholar]
- Bercoff J, Tanter M, Fink M (2004) Supersonic shear imaging: a new technique for soft tissue elasticity mapping. IEEE Trans Ultrason Ferroelectr Freq Control 51, 396–409. [DOI] [PubMed] [Google Scholar]
- Bianchi S, Martinoli C (2007) Ultrasound of the Musculoskeletal System. Berlin: Springer‐Verlag. [Google Scholar]
- Brandenburg JE, Eby SF, Song P, et al. (2014) Ultrasound elastography: the new frontier in direct measurement of muscle stiffness. Arch Phys Med Rehabil 95, 2207–2219. [DOI] [PMC free article] [PubMed] [Google Scholar]
- Campbell KM, Biggs NL, Blanton PL, et al. (1973) Electromyographic investigation of the relative activity among four components of the triceps surae. Am J Phys Med 52, 30–41. [PubMed] [Google Scholar]
- Catheline S, Benech N, Brum J, et al. (2008) Time reversal of elastic waves in soft solids. Phys Rev Lett 100, 064301. [DOI] [PubMed] [Google Scholar]
- Chernak LA, DeWall RJ, Lee KS, et al. (2013) Length and activation dependent variations in muscle shear wave speed. Physiol Meas 34, 713–721. [DOI] [PMC free article] [PubMed] [Google Scholar]
- Chino K, Takahashi H (2015) The association of muscle and tendon elasticity with passive joint stiffness: in vivo measurements using ultrasound shear wave elastography. Clin Biomech (Bristol, Avon) 30, 1230–1235. [DOI] [PubMed] [Google Scholar]
- Cleland J, Koppenhaver S (2010) Netter's Orthopaedic Clinical Examination: An Evidence‐Based Approach.
- Csapo R, Malis V, Sinha U, et al. (2015) Mapping of spatial and temporal heterogeneity of plantar flexor muscle activity during isometric contraction: correlation of velocity‐encoded MRI with EMG. J Appl Physiol (1985) 119, 558–568. [DOI] [PMC free article] [PubMed] [Google Scholar]
- Dumville JC, Torgerson DJ, Hewitt CE (2006) Reporting attrition in randomised controlled trials. BMJ 332, 969–971. [DOI] [PMC free article] [PubMed] [Google Scholar]
- Eby SF, Song P, Chen S, et al. (2013) Validation of shear wave elastography in skeletal muscle. J Biomech 46, 2381–2387. [DOI] [PMC free article] [PubMed] [Google Scholar]
- Farmer SE, James M (2001) Contractures in orthopaedic and neurological conditions: a review of causes and treatment. Disabil Rehabil 23, 549–558. [DOI] [PubMed] [Google Scholar]
- Fergusson D, Hutton B, Drodge A (2007) The epidemiology of major joint contractures: a systematic review of the literature. Clin Orthop Relat Res 456, 22–29. [DOI] [PubMed] [Google Scholar]
- Finni T, Cronin NJ, Mayfield D, et al. (2015) Effects of muscle activation on shear between human soleus and gastrocnemius muscles. Scand J Med Sci Sports 27, 26–34. [DOI] [PubMed] [Google Scholar]
- Freitas SR, Andrade RJ, Larcoupaille L, et al. (2015) Muscle and joint responses during and after static stretching performed at different intensities. Eur J Appl Physiol 115, 1263–1272. [DOI] [PubMed] [Google Scholar]
- Fukunaga T, Roy RR, Shellock FG, et al. (1992) Physiological cross‐sectional area of human leg muscles based on magnetic resonance imaging. J Orthop Res 10, 928–934. [DOI] [PubMed] [Google Scholar]
- Gajdosik RL (2001) Passive extensibility of skeletal muscle: review of the literature with clinical implications. Clin Biomech (Bristol, Avon) 16, 87–101. [DOI] [PubMed] [Google Scholar]
- Gennisson JL, Deffieux T, Mace E, et al. (2010) Viscoelastic and anisotropic mechanical properties of in vivo muscle tissue assessed by supersonic shear imaging. Ultrasound Med Biol 36, 789–801. [DOI] [PubMed] [Google Scholar]
- Gennisson JL, Deffieux T, Fink M, et al. (2013) Ultrasound elastography: principles and techniques. Diagn Interv Imaging 94, 487–495. [DOI] [PubMed] [Google Scholar]
- Gracies JM (2005) Pathophysiology of spastic paresis. I: Paresis and soft tissue changes. Muscle Nerve 31, 535–551. [DOI] [PubMed] [Google Scholar]
- de Groot JH, Angulo SM, Meskers CG, et al. (2011) Reduced elbow mobility affects the flexion or extension domain in activities of daily living. Clin Biomech (Bristol, Avon) 26, 713–717. [DOI] [PubMed] [Google Scholar]
- Herbert RD, Crosbie J (1997) Rest length and compliance of non‐immobilised and immobilised rabbit soleus muscle and tendon. Eur J Appl Physiol Occup Physiol 76, 472–479. [DOI] [PubMed] [Google Scholar]
- Herbert RD, Moseley AM, Butler JE, et al. (2002) Change in length of relaxed muscle fascicles and tendons with knee and ankle movement in humans. J Physiol 539, 637–645. [DOI] [PMC free article] [PubMed] [Google Scholar]
- Herbert RD, Heroux ME, Diong J, et al. (2015) Changes in the length and three‐dimensional orientation of muscle fascicles and aponeuroses with passive length changes in human gastrocnemius muscles. J Physiol 593, 441–455. [DOI] [PMC free article] [PubMed] [Google Scholar]
- Hermens HJ, Freriks B, Disselhorst‐Klug C, et al. (2000) Development of recommendations for SEMG sensors and sensor placement procedures. J Electromyogr Kinesiol 10, 361–374. [DOI] [PubMed] [Google Scholar]
- Hirata K, Kanehisa H, Miyamoto‐Mikami E, et al. (2015) Evidence for intermuscle difference in slack angle in human triceps surae. J Biomech 48, 1210–1213. [DOI] [PubMed] [Google Scholar]
- Hirata K, Miyamoto‐Mikami E, Kanehisa H, et al. (2016) Muscle‐specific acute changes in passive stiffness of human triceps surae after stretching. Eur J Appl Physiol 116, 911–918. [DOI] [PubMed] [Google Scholar]
- Hopkins WG (2000) Measures of reliability in sports medicine and science. Sports Med 30, 1–15. [DOI] [PubMed] [Google Scholar]
- Hug F, Lacourpaille L, Maisetti O, et al. (2013) Slack length of gastrocnemius medialis and Achilles tendon occurs at different ankle angles. J Biomech 46, 2534–2538. [DOI] [PubMed] [Google Scholar]
- Hug F, Tucker K, Gennisson JL, et al. (2015) Elastography for muscle biomechanics: toward the estimation of individual muscle force. Exerc Sport Sci Rev 43, 125–133. [DOI] [PubMed] [Google Scholar]
- Kjær M (2004) Role of extracellular matrix in adaptation of tendon and skeletal muscle to mechanical loading. Physiol Rev 84, 649–698. [DOI] [PubMed] [Google Scholar]
- Kwah LK, Harvey LA, Diong JHL, et al. (2012) Half of the adults who present to hospital with stroke develop at least one contracture within six months: an observational study. J Physiother 58, 41–47. [DOI] [PubMed] [Google Scholar]
- Kwiatkowski TC, Detmer DE (1997) Anatomical dissection of the deep posterior compartment and its correlation with clinical reports of chronic compartment syndrome involving the deep posterior compartment. Clin Anat 10, 104–111. [DOI] [PubMed] [Google Scholar]
- Lacourpaille L, Hug F, Bouillard K, et al. (2012) Supersonic shear imaging provides a reliable measurement of resting muscle shear elastic modulus. Physiol Meas 33, N19–N28. [DOI] [PubMed] [Google Scholar]
- Le Sant G, Ates F, Brasseur JL, et al. (2015) Elastography study of hamstring behaviors during passive stretching. PLoS ONE 10, e0139272. [DOI] [PMC free article] [PubMed] [Google Scholar]
- Maas H, Baan GC, Huijing PA (2001) Intermuscular interaction via myofascial force transmission: effects of tibialis anterior and extensor hallucis longus length on force transmission from rat extensor digitorum longus muscle. J Biomech 34, 927–940. [DOI] [PubMed] [Google Scholar]
- MacDonald D, Wan A, McPhee M, et al. (2016) Reliability of abdominal muscle stiffness measured using elastography during trunk rehabilitation exercises. Ultrasound Med Biol 42, 1018–1025. [DOI] [PubMed] [Google Scholar]
- Magnusson SP (1998) Passive properties of human skeletal muscle during stretch maneuvers. A review. Scand J Med Sci Sports 8, 65–77. [DOI] [PubMed] [Google Scholar]
- Maïsetti O, Hug F, Bouillard K, et al. (2012) Characterization of passive elastic properties of the human medial gastrocnemius muscle belly using supersonic shear imaging. J Biomech 45, 978–984. [DOI] [PubMed] [Google Scholar]
- McCullough MB, Ringleb SI, Arai K, et al. (2011) Moment arms of the ankle throughout the range of motion in three planes. Foot Ankle Int 32, 300–306. [DOI] [PubMed] [Google Scholar]
- McNair PJ, Dombroski EW, Hewson DJ, et al. (2001) Stretching at the ankle joint: viscoelastic responses to holds and continuous passive motion. Med Sci Sports Exerc 33, 354–358. [DOI] [PubMed] [Google Scholar]
- Nakamura M, Ikezoe T, Umegaki H, et al. (2016) Shear elastic modulus is a reproducible index reflecting the passive mechanical properties of medial gastrocnemius muscle belly. Acta Radiol Open 5, 2058460115604009. [DOI] [PMC free article] [PubMed] [Google Scholar]
- Nordez A, Cornu C, McNair P (2006) Acute effects of static stretching on passive stiffness of the hamstring muscles calculated using different mathematical models. Clin Biomech (Bristol, Avon) 21, 755–760. [DOI] [PubMed] [Google Scholar]
- Nordez A, McNair PJ, Casari P, et al. (2010) Static and cyclic stretching: their different effects on the passive torque‐angle curve. J Sci Med Sport 13, 156–160. [DOI] [PubMed] [Google Scholar]
- Offenbächer M, Sauer S, Rieß J, et al. (2014) Contractures with special reference in elderly: definition and risk factors – a systematic review with practical implications. Disabil Rehabil 36, 529–538. [DOI] [PubMed] [Google Scholar]
- Parratte B, Tatu L, Vuillier F, et al. (2002) Intramuscular distribution of nerves in the human triceps surae muscle: anatomical bases for treatment of spastic drop foot with botulinum toxin. Surg Radiol Anat 24, 91–96. [DOI] [PubMed] [Google Scholar]
- Proske U, Morgan DL (1999) Do cross‐bridges contribute to the tension during stretch of passive muscle? J Muscle Res Cell Motil 20, 433–442. [DOI] [PubMed] [Google Scholar]
- Schulhofer SD, Oloff LM (2002) Flexor hallucis longus dysfunction: an overview. Clin Podiatr Med Surg 19, 411–418. [DOI] [PubMed] [Google Scholar]
- Sekiya S (1991) Muscle architecture and intramuscular distribution of nerves in the human soleus muscle. Acta Anat (Basel) 140, 213–223. [DOI] [PubMed] [Google Scholar]
- Taniguchi K, Shinohara M, Nozaki S, et al. (2015) Acute decrease in the stiffness of resting muscle belly due to static stretching. Scand J Med Sci Sports 25, 32–40. [DOI] [PubMed] [Google Scholar]
- Weppler CH, Magnusson SP (2010) Increasing muscle extensibility: a matter of increasing length or modifying sensation? Phys Ther 90, 438–449. [DOI] [PubMed] [Google Scholar]
- Yi KH, Rha DW, Lee SC, et al. (2016) Intramuscular nerve distribution pattern of ankle invertor muscles in human cadaver using sihler stain. Muscle Nerve 53, 742–747. [DOI] [PubMed] [Google Scholar]
- Yucesoy CA, Maas H, Koopman BH, et al. (2006) Mechanisms causing effects of muscle position on proximo‐distal muscle force differences in extra‐muscular myofascial force transmission. Med Eng Phys 28, 214–226. [DOI] [PubMed] [Google Scholar]
- Zelik KE, La Scaleia V, Ivanenko YP, et al. (2015) Coordination of intrinsic and extrinsic foot muscles during walking. Eur J Appl Physiol 115, 691–701. [DOI] [PubMed] [Google Scholar]
Associated Data
This section collects any data citations, data availability statements, or supplementary materials included in this article.
Supplementary Materials
Fig. S1. Musculo‐tendinous junctions (MTJ) of gastrocnemius medialis (GM) and g. lateralis (GL) with B‐Mode ultrasound images associated.
Fig. S2. Transducer location site for each shear measurement.
Fig. S3. Shear map for each measurement site.