Abstract
Sleep is an essential process that supports learning and memory by acting on synapses through poorly understood molecular mechanisms. Using biochemistry, proteomics, and imaging in mice, we find that during sleep, synapses undergo widespread alterations in composition and signaling, including weakening of synapses through removal and dephosphorylation of synaptic AMPA-type glutamate receptors. These changes are driven by the immediate early gene Homer1a and signaling from group I metabotropic glutamate receptors mGluR1/5. Homer1a serves as a molecular integrator of arousal and sleep need via the wake- and sleep-promoting neuromodulators, noradrenaline and adenosine, respectively. Our data suggest that homeostatic scaling-down, a global form of synaptic plasticity, is active during sleep to remodel synapses and participates in the consolidation of contextual memory.
Cognitive functions such as learning and memory are supported by sleep, which modifies synapses through poorly understood mechanisms (1, 2). Information coding during wake drives synapse strengthening, which is offset by weakening of synapses during sleep (3–5). Neurons use homeostatic scaling to adjust overall synaptic weight and maintain neuronal firing rates while protecting information coding (6). Although homeostatic scaling-up has been demonstrated in visual cortex in response to sensory deprivation (7, 8), a clear physiological function of scaling-down has not been defined. Homeostatic scaling-down weakens excitatory synapses through removal and dephosphorylation of synaptic AMPA-type glutamate receptors and is mediated by alterations in the signaling of protein kinase A (PKA) and group I metabotropic glutamate receptors (mGluR1/5) (9–11). We used biochemical fractionation, proteomics, and in vivo two-photon imaging to characterize the changes that occur in synapse composition in mice through the wake/sleep cycle to better understand the molecular basis by which sleep promotes cognitive processes and to test the hypothesis that the physiological function of homeostatic scaling-down is to remodel synapses during sleep.
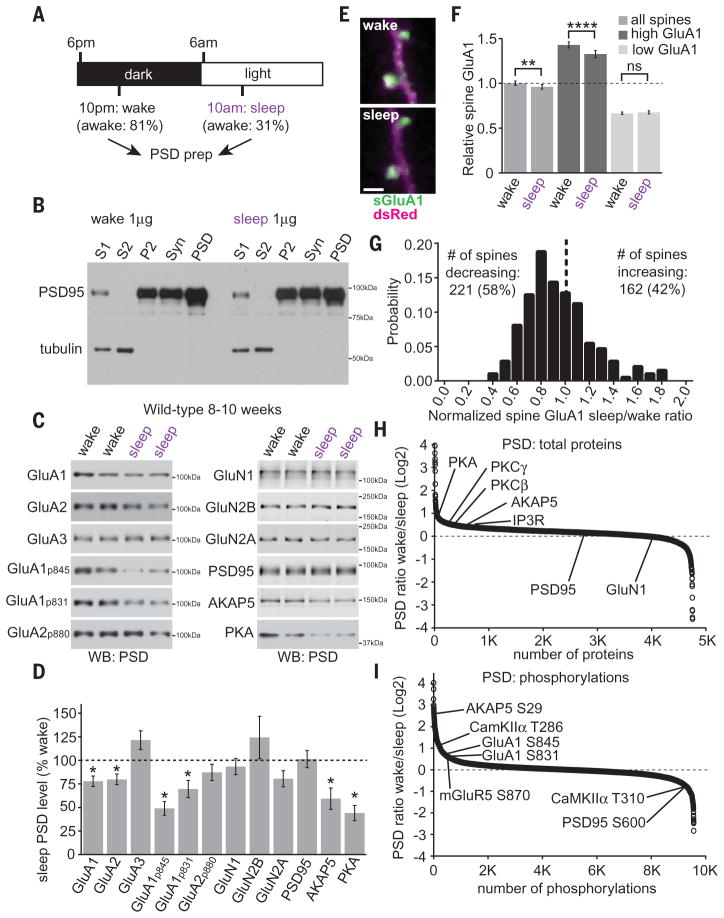
We first examined whether previously described synaptic changes during homeostatic scaling-down in vitro also occurred in mouse forebrain synapses during the dark/light cycle (12 hours dark/12 hours light). Four hours into the dark (wake) or light (sleep) phases, forebrains were dissected, followed by subcellular fractionation to isolate the postsynaptic density (PSD) (Fig. 1, A and B). Live-video recording confirmed that mice spent the majority of the first 4 hours of the dark or light phase awake or asleep, respectively. PSD fractions were analyzed by Western blot and quantitative proteomics. Homeostatic scaling-down involves a loss of synaptic AMPARs and AMPAR dephosphorylation (6, 9, 11), major determinants of synaptic strength (12). PSD samples collected during sleep contained significantly less GluA1 and GluA2 AMPAR subunits, decreased phosphorylation of GluA1 at S845 and S831, decreased catalytic subunit of PKA and A-Kinase Anchor Protein 5 (AKAP5) compared with PSDs prepared from the wake phase (3) (Fig. 1, C and D). There was no change in PSD-associated GluA3, N-methyl-D-aspartate (NMDA)–type glutamate receptor subunits, or core PSD scaffold molecule PSD95 (Fig. 1, C and D). Total forebrain levels of these proteins were not different, which suggests that the observed changes are specific to synapses (fig. S1).
Fig. 1. Forebrain postsynaptic densities are remodeled during the wake/sleep cycle.
(A) Experimental design. Time spent awake was measured during the first 4 hours of the dark or light phase by video recording as a fraction of total time. (B) Subcellular fractionation to yield S1, S2, P2, synaptosome (Syn), and postsynaptic density (PSD) fractions. (C and D) Western blot analysis of wake/sleep PSD fractions. N = 8 brains for each condition; *P < 0.05, Student’s t test. (E) Wake/sleep phase in vivo two-photon imaging of SEP-tagged GluA1 in dendritic spines (sGluA1, green) and dsRed (magenta) in layer V pyramidal neurons of the primary motor cortex. Scale bar, 2 μm. (F) Relative spine GluA1 is significantly reduced during sleep compared with wake. Spines that contain greater-than-average spine GluA1 during wake (high GluA1) show a greater change than spines with lower-than-average spine GluA1 (low GluA1). N = 383 spines from 4 mice; “high GluA1” N = 168 spines; “low GluA1” N = 215 spines; **P < 0.01; ****P < 0.0001; ns, not significant, Student’s t test. (G) Change in spine GluA1 during sleep (sleep/wake ratio) histogram. More spines show a decrease in spine GluA1 during sleep than an increase. N = 383 spines from 4 mice, significantly different from a randomized distribution, Kolmogorov-Smirnov test, P < 0.05. (H and I) Quantitative proteomics of PSD total proteome (H) or phosphoproteome (I). Positive and negative values indicate PSD enrichment during wake or sleep, respectively. Data obtained from 5 mice per condition. Error bars, mean ± SEM.
Next, we used in vivo two-photon imaging to examine wake/sleep synapse targeting of super-ecliptic pHluorin (SEP)–tagged GluA1 in layer V pyramidal neurons of primary motor cortex via a cranial window (13). Synapses were repeatedly imaged at 10 p.m. and 10 a.m. over multiple days. Spine GluA1 content and spine size were highly correlated (fig. S2) (13). Average spine GluA1 signal over all synapses imaged was reduced during the sleep phase compared with the wake phase (Fig. 1, E and F). Although some spines showed an increase in spine GluA1 during sleep, a greater number of spines showed reduced spine GluA1 during sleep (Fig. 1G). We separated synapses into two groups, “high” or “low” GluA1-expressing synapses, which contain greater or less than average spine GluA1 levels during wake, respectively. “High” synapses showed a disproportionate loss of GluA1, as well as reduced spine size during sleep, whereas “low” synapses showed no change in GluA1 or size (Fig. 1G and fig. S2). The correlation between wake spine GluA1 levels and the change in spine GluA1/size during sleep (sleep/wake ratio) showed a negative slope, suggesting that spines with more GluA1 during wake were most likely to lose GluA1 and shrink in size during sleep (fig. S2).
Next, we used quantitative proteomics to measure changes in PSD protein/phosphorylation levels (Fig. 1, H and I, and fig. S3). We quantified more than 4500 PSD proteins and close to 10,000 unique phosphopeptides. About 20% of PSD proteins and phosphorylation sites showed regulation during wake or sleep, including GluA1 phosphorylation, and signaling molecules PKA, classic protein kinase C isoforms (PKCβ/γ), calcium-and calmodulin-dependent kinase II (CaMKIIα), and type-1 inositol triphosphate receptor (IP3R) (Fig. 1, H and I, and tables S1 and S2). Kinase prediction algorithms suggest that during wake, more PSD proteins are targeted by PKA/PKC, whereas during sleep, more PSD proteins are targeted by CDK5 (fig. S4). Motif analysis revealed that the most highly enriched motifs during wake or sleep corresponded with consensus target sequences for PKA or CDK5, respectively (fig. S4).
We next attempted to dissect the underlying molecular mechanisms driving the described changes. Group I metabotropic glutamate receptors (mGluR1/5) form a signaling complex with PKC and IP3Rs linked by long forms of the scaffold Homer (14). Neurons can express an endogenous dominant-negative short variant, Homer1a, which disrupts mGluR1/5-IP3R complex formation (15). Homer1a and mGluR5 are important for the regulation of sleep and wakefulness (16–20) and homeostatic scaling-down in vitro and in response to electroconvulsive therapy in vivo (10). We therefore hypothesized that Homer1a drives remodeling of the mGluR1/5 complex during sleep.
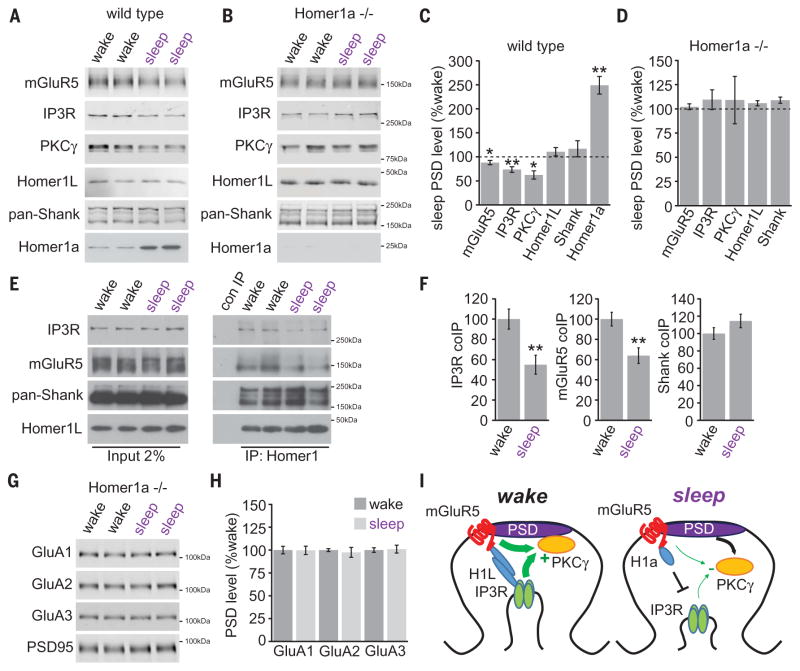
Whereas mGluR5, PKCγ, and IP3R showed a concerted decrease in PSD during sleep, PSD Homer1a levels drastically increased (Fig. 2, A and C), despite a decrease in Homer1a protein from whole-forebrain homogenate (fig. S1). Wake/sleep regulation of PSD-associated mGluR5, PKCγ, and IP3R was absent in Homer1a knock-out (KO) mice (Fig. 2, B and D). Using coimmunoprecipitation, we observed significantly less interaction between Homer1L, mGluR5, and IP3R during the sleep phase, whereas interaction between Homer1L and Shank (21) were unchanged (Fig. 2, E and F). Unlike in wild-type mice, wake/sleep regulation of PSD-associated AMPAR subunits and PKA/AKAP5 was abolished in Homer1a KO mice (Fig. 2, G and H, and fig. S5). These results agree with previous findings that scaling-down was absent in Homer1a KO neurons (10) and suggest that PSD targeting of Homer1a during sleep results in a loss of synaptic mGluR5 and associated signaling molecules, disassembly of the mGluR5-Homer1L-IP3R complex, and removal of synaptic AMPARs (summarized in Fig. 2I). We asked if these same changes occurred at synapses during scaling-down in vitro. Bicuculline-induced scaling-down (6) resulted in a loss of PSD mGluR5, PKCγ, and IP3R, an increase in PSD Homer1a (fig. S6), and decreased association of mGluR5 and IP3R (fig. S6).
Fig. 2. Wake/sleep remodeling of the mGluR5 signaling complex by Homer1a.
(A to D) Western blot analysis of mGluR5 signaling proteins in PSD fractions collected from wild-type or Homer1a KO mice during wake or sleep. N = 8 brains for each condition; *P < 0.05, **P < 0.01, Student’s t test. (E and F) Coimmunoprecipitation of mGluR5, IP3R, Shank, and Homer1L in forebrain P2 fractions during wake or sleep. N = 8; **P < 0.01, Student’s t test. (G and H) Western blot analysis of AMPARs in PSD fractions from Homer1a KO mice during wake or sleep. N = 8 brains for each condition; **P < 0.01, Student’s t test. (I) Model of Homer1a-dependent remodeling of mGluR5 signaling complex. Error bars, mean ± SEM.
In addition to uncoupling mGluR1/5 from IP3R (15), Homer1a binding activates constitutive ligand-independent mGluR1/5 signaling that drives homeostatic scaling-down (10, 22). Because Homer1a displaces mGluR1/5 from major signaling effectors IP3R/PKCγ (15), other downstream pathways, such as extracellular signal–regulated kinase 1/2 (ERK1/2), may be relevant during scaling-down and sleep (23, 24). Treatment of cultured neurons with the mGluR1/5-specific agonist dihydroxy-phenylglycine caused a significant increase in phosphorylated ERK1/2, which was completely occluded by bicuculline (fig. S6). Levels of phosphorylated ERK1/2 were significantly higher in forebrain homogenate and synaptosome fractions during the sleep phase (fig. S7) (23).
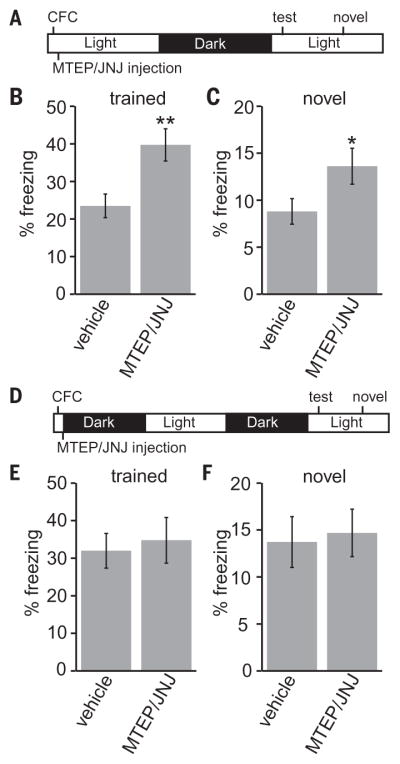
Next, we investigated whether mGluR1/5 signaling contributes to synaptic AMPAR removal and memory consolidation during sleep. Mice were treated by intraperitoneal injection during the wake or sleep phases with MTEP and JNJ6259685 (MJ), noncompetitive mGluR5/1 inhibitors. MJ injection during the sleep phase resulted in a small but significant increase in PSD-associated GluA1 and a decrease in phospho-ERK1/2 levels in synaptosomes, whereas treatment during the wake phase had no effect (fig. S7). Next, we trained mice in contextual fear conditioning (CFC), which is sleep sensitive (2), using a single uncued foot-shock. Training occurred either at the beginning of the sleep phase or immediately before the wake phase, followed by MJ injection (Fig. 3, A and D). Mice were tested for fear responses at the beginning of the sleep phase, 24 or 36 hours after training, to avoid the strong time-of-day effects of memory recall (25). Compared with vehicle, MJ injection significantly increased freezing responses in both trained (fearful) and novel (nonreinforced) contexts when injected during the sleep phase (Fig. 3, A to C), whereas injection immediately before the wake phase had no effect (Fig. 3, D to F). Conventional Homer1a KO mice did not show a contextual memory phenotype (fig. S5), likely due to developmental compensation. We suspect that blocking scaling-down by MJ injection during sleep resulted in a more intense fear memory but also impaired the ability of the mice to appropriately discriminate between the trained and untrained context.
Fig. 3. mGluR1/5 signaling during the sleep phase affects memory consolidation.
(A to C) Mice were trained in contextual fear conditioning at the beginning of the sleep phase, followed by intraperitoneal injection of vehicle or MJ. Mice were tested 24 hours later for freezing responses in the trained context (B) or a novel context (C). N = 19 vehicle, 19 MJ; *P < 0.05, **P < 0.01, Student’s t test. (D to F) Mice were trained and injected, as above, before the wake phase. Mice were tested for freezing responses >36 hours later at the same time of day as above in the trained context (E) or a novel context (F). N = 12 vehicle, 12 MJ; P > 0.05, Student’s t test. Error bars, mean ± SEM.
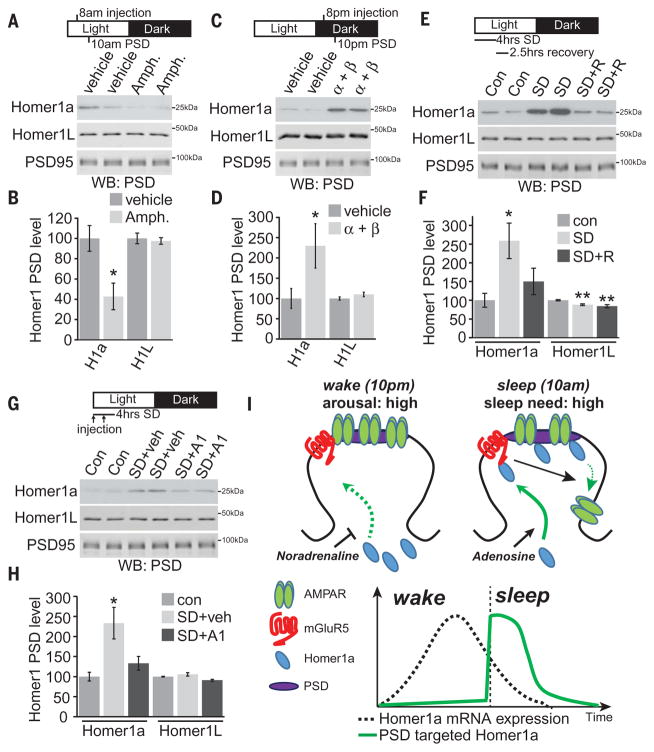
In our final experiments, we wished to determine the mechanisms controlling Homer1a synapse targeting. Homer1a gene expression is strongly linked with learning and neuronal activity (15). Accordingly, Homer1a mRNA is low during sleep and increases during wake, especially after sleep deprivation (19, 20). However, Homer1a protein is targeted to the PSD in the sleep phase (Fig. 2, A and C) and during scaling-down (fig. S6), suggesting that wake-related neuronal activity drives the expression of Homer1a mRNA but limits targeting of Homer1a protein to the PSD. We reasoned that release of the neuromodulator noradrenaline (NA), strongly linked with wake and arousal (26), may limit Homer1a synapse targeting during wake. Indeed, acute NA treatment reversed bicuculline-induced PSD targeting of Homer1a in cultured neurons (fig. S6), suggesting that NA is sufficient to limit Homer1a access to the PSD during scaling. To determine the role of NA in controlling Homer1a PSD targeting in vivo, we increased NA by injection of catecholamine re-uptake inhibitor D-amphetamine during the sleep phase (8 a.m.), when NA is normally low, or blocked NA signaling with the α and β adrenergic receptor inhibitors, prazosin and propranolol, during the wake phase (8 p.m.), when NA is high (26). Homer1a PSD levels were examined 2 hours after injection. D-amphetamine treatment significantly reduced Homer1a PSD levels (Fig. 4, A and B), whereas inhibition of NA receptors resulted in a significant increase in Homer1a PSD levels (Fig. 4, C and D). Neither of the drug treatments affected total cellular Homer1a protein levels (fig. S8).
Fig. 4. Homer1a PSD targeting is controlled by NA and adenosine signaling.
(A and B) Mice were injected with D-amphetamine (Amph.), 2 mg per kg of weight (mg/kg) at 8 a.m., and forebrain PSD was prepared 2 hours later at 10 a.m. Amphetamine treatment resulted in a significant decrease in Homer1a PSD targeting. N = 5; *P < 0.05, Student’s t test. (C and D) Mice were injected with a cocktail of α and β adrenergic receptor inhibitors, prazosin and propranolol (α + β) (2 mg/kg and 20 mg/kg) at 8 p.m., and forebrain PSD was prepared 2 hours later at 10 p.m. α + β treatment resulted in a large increase in Homer1a PSD targeting. N = 4; *P < 0.05, Student’s t test. (E and F) Mice were sleep deprived (SD) for 4 hours (6 to 10 a.m.) by placing mice into a new cage with or without recovery sleep (2.5 hours, SD+R) in their original cage, followed by forebrain PSD preparation. SD resulted in a significant increase in Homer1a PSD targeting that was reversed by recovery sleep. N = 8; *P < 0.05, **P < 0.01, Student’s t test with Bonferroni correction. (G and H) Mice were left in their home cage (con) or subjected to 4 hours SD (6 to 10 a.m.), with two injections, spaced 2 hours apart, of vehicle or adenosine A1 receptor inhibitor DPCPX (A1) (0.5 mg/kg), followed by PSD isolation and Western blot. A1 blockade prevented up-regulation of Homer1a in the PSD during SD. N = 6; *P < 0.05, Student’s t test with Bonferroni correction. (I) Model. Homer1a targeting to the PSD is inhibited by noradrenaline and promoted by adenosine. Homer1a in the PSD binds to mGluR5 and activates signaling to promote AMPAR removal. Black arrows indicate signaling pathways; green arrows indicate protein trafficking/translocation. Homer1a mRNA is expressed during wake after synaptic plasticity such as LTP and learning. Homer1a mRNA expression is low during sleep. The amount of scaling-down during sleep will be a function of the amount of Homer1a expressed during wake. Error bars, mean ± SEM.
To directly test whether Homer1a targeting to synapses is gated by sleep, mice were sleep deprived (SD) at the start of the sleep phase for 4 hours, with or without 2.5 hours of recovery sleep (SD+R). SD significantly increased Homer1a PSD levels, which was reversed after recovery sleep (Fig. 4, E and F). AMPAR PSD levels during SD were the same as control sleep, whereas mGluR5 and AKAP5 levels showed a further decrease (fig. S8). GluN1/GluN2B NMDA receptor (NMDAR) subunits also showed a significant decrease in response to SD (fig. S8). These results suggest that Homer1a PSD targeting is acutely regulated by increased sleep need, not strictly by time-of-day effects, and that the scaling-down pathway is engaged after prolonged wakefulness. Increased adenosine signaling mediates sleepiness during periods of increased sleep need (27). Mice were treated with vehicle or adenosine A1 receptor–selective antagonist DPCPX during 4 hours of SD. DPCPX completely blocked up-regulation of PSD Homer1a by SD (Fig. 4, G and H). Further confirming this finding, we found that acute treatment of cultured neurons with adenosine or A1 receptor–selective agonist CCPA significantly increased Homer1a PSD levels (fig. S6), showing that adenosine, through the A1 receptor, can promote Homer1a PSD trafficking. Together, these data suggest that Homer1a serves as a molecular integrator of arousal and sleep need through the opposing actions of NA and adenosine.
Sleep is governed by circadian and homeostatic components, such that sleep deprivation leads to accumulated sleep pressure, or sleep need, resulting in enhanced amplitude of delta oscillations during subsequent recovery sleep (5, 27). Mild sleep deprivation or activation of adenosine A1 receptors caused enhanced targeting of Homer1a protein to the PSD. Adenosine is a well-known mediator of sleep need (27), and polymorphisms in the Homer1a gene are genetically associated with the accumulation of sleep need (19, 20). Adenosine has also been shown to weaken excitatory synapses (28), which may occur in coordination with Homer1a (29). Thus, regulated targeting of Homer1a to synapses by adenosine provides a molecular mechanism linking the previously described genetic and chemical basis for the homeostatic accumulation of sleep need (5). Based on our data, we propose the following model. During waking life, learning-related synaptic activity drives the expression of Homer1a (15, 16, 19, 20), which is excluded from synapses due to high levels of NA. At the onset of sleep or after prolonged wakefulness, NA levels decline (26) and adenosine increases (27); Homer1a is then targeted to synapses where it binds mGluR1/5 and remodels/activates mGluR1/5 signaling to drive synapse weakening (Fig. 4I). This mechanism links wake-related learning and gene expression with remodeling of synapses during sleep. In neurons that underwent long-term potentiation (LTP) during waking life, scaling-down during sleep may facilitate memory consolidation by enhancing signal-to-noise ratios (5, 6), consistent with a recent study showing that neurons with the highest firing rates during wake show the greatest decrease in activity during sleep (30).
The synapse homeostasis hypothesis (5) (SHY) posits that synapses undergo a net strengthening during waking through information coding via LTP-type mechanisms, followed by a global weakening during sleep (3–5). Consistent with SHY, we find that synapses undergo changes in the levels of synaptic AMPARs and AMPAR phosphorylation through the wake/sleep cycle. Synaptic changes during sleep and homeostatic scaling-down are remarkably similar, and both processes require Homer1a (10), indicating a shared molecular mechanism. Our results further suggest that scaling-down may be up-regulated by adenosine during sleep deprivation. Sleep significantly improves, whereas sleep deprivation impairs, memory performance, suggesting that scaling-down may interact with sleep-specific patterns of neuronal activity to facilitate memory consolidation (1, 5). Whereas homeostatic scaling-down is engaged in cultured neurons in vitro by bicuculline-induced hyperactivity (6), scaling-down during sleep is likely under the control of a coordinated interplay of neuromodulators, such as NA and adenosine (26, 27). Recently, it was found that homeostatic scaling-up in visual cortex (7) only occurs during wake and is actually inhibited by sleep (8). These findings suggest that homeostatic scaling up and down fulfill distinct physiological functions and are engaged in vivo by distinct mechanisms, such as wake/sleep-patterned neuronal activity or chemical modulators. Our characterization of the large-scale remodeling of the synaptic proteome during the wake/sleep cycle will form a foundation to explore additional mechanisms by which sleep is able to support cognitive function. Finally, we provide mechanistic evidence that one physiological function of homeostatic scaling-down, previously described only in cultured neurons, is to remodel synapses during sleep.
Supplementary Material
Acknowledgments
All proteomics data obtained in this study are available in the PRIDE repository with the data set identifier PXD004537. The authors thank members of the Huganir laboratory, especially I. Hong, S. Heo, and N. Hussain, for insightful comments and critical reading of the manuscript. Image analysis software was developed by R. Cudmore and D. Linden, Department of Neuroscience, Johns Hopkins University. G.H.D. is a recipient of a fellowship award from the Canadian Institutes for Health Research. Funding was provided by an NIH grant (P50MH100024, RO1NS036715, to R.L.H.), an NIH shared instrumentation grant (S10OD021844, to A.P.), and the Center for Proteomics Discovery at Johns Hopkins University. Data are stored and curated on a secure server located in the Department of Neuroscience at Johns Hopkins University. Data will be made available upon request.
Footnotes
References
- 1.Diekelmann S, Born J. Nat Rev Neurosci. 2010;11:114–126. doi: 10.1038/nrn2762. [DOI] [PubMed] [Google Scholar]
- 2.Vecsey CG, et al. Nature. 2009;461:1122–1125. doi: 10.1038/nature08488. [DOI] [PMC free article] [PubMed] [Google Scholar]
- 3.Vyazovskiy VV, Cirelli C, Pfister-Genskow M, Faraguna U, Tononi G. Nat Neurosci. 2008;11:200–208. doi: 10.1038/nn2035. [DOI] [PubMed] [Google Scholar]
- 4.Liu ZW, Faraguna U, Cirelli C, Tononi G, Gao XB. J Neurosci. 2010;30:8671–8675. doi: 10.1523/JNEUROSCI.1409-10.2010. [DOI] [PMC free article] [PubMed] [Google Scholar]
- 5.Tononi G, Cirelli C. Neuron. 2014;81:12–34. doi: 10.1016/j.neuron.2013.12.025. [DOI] [PMC free article] [PubMed] [Google Scholar]
- 6.Turrigiano GG. Cell. 2008;135:422–435. doi: 10.1016/j.cell.2008.10.008. [DOI] [PMC free article] [PubMed] [Google Scholar]
- 7.Goel A, Lee HK. J Neurosci. 2007;27:6692–6700. doi: 10.1523/JNEUROSCI.5038-06.2007. [DOI] [PMC free article] [PubMed] [Google Scholar]
- 8.Hengen KB, Torrado Pacheco A, McGregor JN, Van Hooser SD, Turrigiano GG. Cell. 2016;165:180–191. doi: 10.1016/j.cell.2016.01.046. [DOI] [PMC free article] [PubMed] [Google Scholar]
- 9.Diering GH, Gustina AS, Huganir RL. Neuron. 2014;84:790–805. doi: 10.1016/j.neuron.2014.09.024. [DOI] [PMC free article] [PubMed] [Google Scholar]
- 10.Hu JH, et al. Neuron. 2010;68:1128–1142. doi: 10.1016/j.neuron.2010.11.008. [DOI] [PMC free article] [PubMed] [Google Scholar]
- 11.O’Brien RJ, et al. Neuron. 1998;21:1067–1078. doi: 10.1016/s0896-6273(00)80624-8. [DOI] [PubMed] [Google Scholar]
- 12.Huganir RL, Nicoll RA. Neuron. 2013;80:704–717. doi: 10.1016/j.neuron.2013.10.025. [DOI] [PMC free article] [PubMed] [Google Scholar]
- 13.Zhang Y, Cudmore RH, Lin DT, Linden DJ, Huganir RL. Nat Neurosci. 2015;18:402–407. doi: 10.1038/nn.3936. [DOI] [PMC free article] [PubMed] [Google Scholar]
- 14.Tu JC, et al. Neuron. 1998;21:717–726. doi: 10.1016/s0896-6273(00)80589-9. [DOI] [PubMed] [Google Scholar]
- 15.Brakeman PR, et al. Nature. 1997;386:284–288. doi: 10.1038/386284a0. [DOI] [PubMed] [Google Scholar]
- 16.Naidoo N, et al. PLOS ONE. 2012;7:e35174. doi: 10.1371/journal.pone.0035174. [DOI] [PMC free article] [PubMed] [Google Scholar]
- 17.Ahnaou A, Langlois X, Steckler T, Bartolome-Nebreda JM, Drinkenburg WH. Psychopharmacology. 2015;232:1107–1122. doi: 10.1007/s00213-014-3746-4. [DOI] [PubMed] [Google Scholar]
- 18.Ahnaou A, Raeymaekers L, Steckler T, Drinkenbrug WH. Behav Brain Res. 2015;282:218–226. doi: 10.1016/j.bbr.2015.01.009. [DOI] [PubMed] [Google Scholar]
- 19.Maret S, et al. Proc Natl Acad Sci USA. 2007;104:20090–20095. doi: 10.1073/pnas.0710131104. [DOI] [PMC free article] [PubMed] [Google Scholar]
- 20.Mackiewicz M, Paigen B, Naidoo N, Pack AI. Physiol Genomics. 2008;33:91–99. doi: 10.1152/physiolgenomics.00189.2007. [DOI] [PubMed] [Google Scholar]
- 21.Tu JC, et al. Neuron. 1999;23:583–592. doi: 10.1016/s0896-6273(00)80810-7. [DOI] [PubMed] [Google Scholar]
- 22.Ango F, et al. Nature. 2001;411:962–965. doi: 10.1038/35082096. [DOI] [PubMed] [Google Scholar]
- 23.Eckel-Mahan KL, et al. Nat Neurosci. 2008;11:1074–1082. doi: 10.1038/nn.2174. [DOI] [PMC free article] [PubMed] [Google Scholar]
- 24.Thandi S, Blank JL, Challiss RA. J Neurochem. 2002;83:1139–1153. doi: 10.1046/j.1471-4159.2002.01217.x. [DOI] [PubMed] [Google Scholar]
- 25.Chaudhury D, Colwell CS. Behav Brain Res. 2002;133:95–108. doi: 10.1016/s0166-4328(01)00471-5. [DOI] [PubMed] [Google Scholar]
- 26.Aston-Jones G, Bloom FE. J Neurosci. 1981;1:876–886. doi: 10.1523/JNEUROSCI.01-08-00876.1981. [DOI] [PMC free article] [PubMed] [Google Scholar]
- 27.Bjorness TE, et al. J Neurosci. 2016;36:3709–3721. doi: 10.1523/JNEUROSCI.3906-15.2016. [DOI] [PMC free article] [PubMed] [Google Scholar]
- 28.Chen Z, et al. J Neurosci. 2014;34:9621–9643. doi: 10.1523/JNEUROSCI.3991-13.2014. [DOI] [PMC free article] [PubMed] [Google Scholar]
- 29.Serchov T, et al. Neuron. 2015;87:549–562. doi: 10.1016/j.neuron.2015.07.010. [DOI] [PMC free article] [PubMed] [Google Scholar]
- 30.Watson BO, Levenstein D, Greene JP, Gelinas JN, Buzsáki G. Neuron. 2016;90:839–852. doi: 10.1016/j.neuron.2016.03.036. [DOI] [PMC free article] [PubMed] [Google Scholar]
Associated Data
This section collects any data citations, data availability statements, or supplementary materials included in this article.


