

Abstract
Rationale
Combining alcohol and caffeine is associated with increased alcohol consumption, but no prospective experimental studies have examined whether added caffeine increases alcohol consumption.
Objectives
This study examined how caffeine alters alcohol self-administration and subjective reinforcing effects in healthy adults.
Methods
Thirty-one participants completed six double-blind alcohol self-administration sessions: three sessions with alcohol only (e.g., Beverage A) and three sessions with alcohol and caffeine (e.g., Beverage B). Participants chose which beverage to consume on a subsequent session (e.g., Beverage A or B). Effects of caffeine on overall beverage choice, number of self-administered drinks, subjective ratings (e.g., Biphasic Alcohol Effects Scale), and psychomotor performance were examined.
Results
A majority of participants (65%) chose to drink the alcohol beverage containing caffeine on their final self-administration session. Caffeine did not increase the number of self-administered drinks. Caffeine significantly increased stimulant effects, decreased sedative effects, and attenuated decreases in psychomotor performance attributable to alcohol. Relative to nonchoosers, caffeine choosers reported overall lower stimulant ratings, and reported greater drinking behavior prior to the study.
Conclusions
Although caffeine did not increase the number of self-administered drinks, most participants chose the alcohol beverage containing caffeine. Given the differences in subjective ratings and pre-existing differences in self-reported alcohol consumption for caffeine choosers and nonchoosers, these data suggest decreased stimulant effects of alcohol and heavier self-reported drinking may predict subsequent choice of combined caffeine and alcohol beverages. These predictors may identify individuals who would benefit from efforts to reduce risk behaviors associated with combining alcohol and caffeine.
Keywords: caffeine, alcohol, caffeine and alcohol, energy drinks, AmED, self-administration, human, stimulant effects, sedative effects, alcohol reinforcement
Introduction
In 2010, the US Food and Drug Administration (FDA) described caffeine as an unsafe additive to alcoholic beverages and issued warning letters to manufacturers which resulted in the removal of pre-mixed caffeinated alcoholic beverages from the US marketplace (Food and Drug Administration 2010a). Despite warnings to manufacturers and consumers (Food and Drug Administration 2010b), many individuals continue to combine alcohol and energy drinks (i.e., caffeinated, sweetened beverages marketed for their stimulant and recreational effects; see Reissig et al. 2009) or purchase mixed drinks of alcohol combined with energy drinks in bar settings (e.g., “Vodka Red Bull” and “Jägerbomb”). Research conducted primarily among university students has yielded estimates that between 15% and 26% of students combined alcohol and energy drinks in the past month (see Vida and Rácz 2015 for review). Mixing alcohol and energy drinks is not limited to undergraduate samples, as studies have reported the practice in high school students, postgraduates, various non-collegiate nightlife scenes, and other samples of adults (Kponee et al. 2014; Martz et al. 2015; Meredith et al. 2016; Rutledge et al. 2016; Wells et al. 2013). Given the high prevalence of consuming alcohol with energy drinks across a wide range of adolescents and adults, it is important to understand increased risks that may accompany this combination.
Self-reported motivations and expectancy for combining alcohol with caffeinated energy drinks described in survey research include increasing stimulant effects of alcohol, reducing the sedative effects of alcohol, and facilitating increased alcohol consumption (Mackillop et al. 2012; Marczinski 2011; Peacock et al. 2013a). Laboratory studies in humans have demonstrated that caffeine increases self-reported stimulant effects and/or decreases alcohol-related sedation relative to alcohol alone (Buela-Casal et al. 1994; Drake et al. 2003; Ferreira et al. 2006; Marczinski et al. 2012; Peacock et al. 2013b; Smith 2013), consistent with research suggesting caffeine potentiates stimulant effects or decreases sedative effects of alcohol in animal models (Ferreira et al. 2004; Ferreira et al. 2013; Fritz et al. 2014). The increased stimulant effects and decreased sedative effects produced by adding caffeine to alcohol may alter the reinforcing effects of alcohol, thereby leading to increased alcohol consumption. Among the many risk behaviors now associated with the consumption of alcohol mixed with energy drinks (e.g., illicit drug use, sexual risk behavior, unsafe driving; see McKetin et al. 2015 for review), increased alcohol consumption may be of primary importance. Excessive alcohol consumption not only increases risk for alcohol use disorder, but also increases risk for numerous harmful alcohol-related behaviors and outcomes (e.g., drinking and driving, HIV and other sexually transmitted infections, liver disease, cancer; World Health Organization 2014; Stahre et al. 2014).
The relationship between mixing energy drinks with alcohol and increased alcohol consumption or problematic alcohol use has been repeatedly demonstrated in survey research (e.g., O’Brien et al. 2008; see McKetin et al. 2015 for review). Further, field research has linked co-consumption of caffeine and alcohol with increased breath alcohol concentration or a greater number of alcohol drinks consumed (Pennay et al. 2015; Thombs et al. 2010; Thombs et al. 2011; Verster et al. 2015). Animal research also suggests that some caffeine doses are associated with increased alcohol consumption (Dietze and Kulkosky 1991; Kunin et al. 2000; Rezvani et al. 2013). Although caffeine enhances the desire to drink alcohol in human laboratory studies (Heinz et al. 2013; Marczinski et al. 2013; Marczinski et al. 2016; McKetin and Coen, 2014), no prospective experimental studies have directly examined the effect of caffeine on human alcohol self-administration (i.e., how much alcohol one chooses to drink). Therefore, this study was designed to test the hypothesis that caffeine increases alcohol self-administration and subjective reinforcing effects in healthy adults. Under double-blind conditions, the present study examined whether: (1) more participants choose to consume an alcohol beverage with caffeine (relative to an alcohol beverage without caffeine), (2) caffeine increases alcohol self-administration, (3) caffeine alters subjective drug effects, ratings of beverage liking, or psychomotor performance, (4) self-administration or subjective effects differ for individuals who choose to consume the caffeinated beverage relative to the beverage without caffeine (i.e., caffeine choosers versus nonchoosers), and (5) whether caffeine choosers may differ from nonchoosers with regard to prior alcohol or caffeine use history in order to examine potential predictors of drinking alcohol combined with caffeine.
Method
Participants
Participants were 31 individuals recruited from Baltimore, Maryland, and vicinity via flyers, newspaper, online, and word-of-mouth. Eligibility was determined during a brief phone screening and confirmed at a subsequent in-person screening during which participants provided written informed consent, caffeine and alcohol use history, and general medical and psychiatric information (e.g., medical history, blood pressure, urine test for drugs of abuse, Symptoms Checklist-90). Eligible participants were: (1) between 21–50 years old, (2) consumed caffeine at least weekly, (3) consumed, on average, less than or equal to 300 mg/day of caffeine, (4) drank alcohol 2–15 times per month, with, on average, 4 or fewer drinks per drinking occasion, (5) had a history of at least one binge drinking episode defined as 4 or more drinks on one occasion for women and 5 or more drinks on one occasion for men, and (6) could read, write, and speak English fluently. Regular users of caffeine were enrolled to avoid including caffeine abstainers or light users who might find the effects of moderate doses of caffeine aversive. Those who used more than 300 mg/day were excluded to reduce the likelihood of tolerance to the study dose of caffeine. Similarly, moderate alcohol users were recruited to exclude those who might find the effects of alcohol aversive or be insensitive to modest alcohol doses.
Exclusion criteria were: (1) serious or unstable illnesses (e.g., Parkinson’s disease, seizure disorder, cardiovascular, gastroenterologic, or respiratory disease), (2) history of significant head trauma, (3) current psychiatric illness (e.g., bipolar disorder, psychotic disorder, untreated depression), (4) current drug dependence on alcohol, nicotine, or other drugs of abuse (except caffeine). Women who were pregnant (confirmed via urinalysis), breastfeeding, or who were not using an effective means of birth control (e.g., condoms) were also excluded from participation. Eighty-eight individuals were screened, 35 individuals met inclusion/exclusion criteria and enrolled in the study (i.e., began at least one alcohol session), data were excluded from one participant because the beverage was improperly mixed, and thirty-one individuals who met inclusion/exclusion criteria successfully completed the study. Adequacy of the sample size was estimated based on a power analysis utilizing data from a prior investigation of alcohol dosing and subjective and performance outcomes (Mintzer and Griffiths 2001).
Procedure
The Johns Hopkins University Institutional Review Board approved all study procedures, which were performed in accordance with the 1964 Declaration of Helsinki. Participants provided written informed consent. After a screening visit, each participant completed seven laboratory sessions designed to compare the self-administration of and choice of an alcohol-containing beverage with or without added caffeine. To differentiate the two beverage conditions, the beverages were labeled and referred to by different letter codes (e.g., Beverage A and Beverage B). Both participants and study staff were blind to which beverage contained caffeine, but were informed that both study beverages contained alcohol and only one of the two beverages contained caffeine. In the first six laboratory sessions, each participant was exposed to the two beverage conditions in alternating order three times each (e.g., A, B, A, B, A, B). The beverage condition that occurred first (i.e., alcohol with caffeine vs. alcohol without caffeine) was randomized across participants. The purpose of providing three exposures to each condition was to assure familiarity with the effects of the different conditions prior to choice. A similar strategy has been used in previous studies of alcohol and other drugs (e.g., Chutuape and de Wit 1994; Evans et al. 1996). The seventh laboratory session was a choice session in which the participant made a single choice at the beginning of the session about which beverage he or she would consume that day (Beverage A or Beverage B). The participant also guessed which beverage contained caffeine, but was provided no feedback as to the accuracy of the guess. The participant then consumed the chosen beverage according to the same methods in the previous six sessions.
Prior to the laboratory sessions, each participant was instructed to consume caffeine as he or she normally would (e.g., if the participant usually drank coffee in the morning, to drink that as usual), to eat a substantial breakfast, but not to eat within three hours of the session, which began at approximately 12:00 PM. During each laboratory session, a single participant was present. The participant was provided a small drinking cup from which to consume the beverage. The participant sat in a comfortable chair that was near a miniature refrigerator equipped with a beverage dispenser spout. With each push of a button on a table adjacent to the participant’s chair, the spout dispensed 36 ml of study beverage. The participant was instructed to completely consume the 36 ml drink before pushing the button for another delivery. An interval of at least 10 s was required between successive deliveries. A research assistant observed the session and monitored compliance with the study procedures. Each session consisted of a 2.5 hour self-administration period followed by a 3.5 hour post-drinking period. The opportunity for self-administration was 2.5 hours even if the participant appeared to have discontinued drinking. Sessions lasted at least six hours or until safe discharge criteria were met. Safe discharge criteria were: (1) breath alcohol concentration (BrAC) ≤ .04 g/210L and (2) the participant was judged to be unimpaired. No participant was allowed to drive an automobile after the session, and the study team arranged alternative transportation. Subjective effects, psychomotor performance, and BrAC were assessed at eight time points, once immediately before the drinking period and subsequently every 45 minutes after the start of drinking (i.e., 0, +45, +90, +135, +180, +225, +270, +315 minutes).
Beverage preparation
Pharmacy staff with no participant interaction prepared the study beverage. The beverage always contained 14 g of alcohol (i.e., 18.68 ml of 95% ethanol solution) per 180 ml of beverage, with the remaining beverage volume consisting of a fruit punch-flavored drink. The caffeine-containing alcohol beverage also contained 60 mg caffeine anhydrous per 180 ml of beverage. The alcohol beverage without caffeine contained 2.2 mg of quinine hydrochloride per 180 ml of beverage. This dose of quinine was chosen to produce equivalent bitter taste to the dose of caffeine in the caffeine-containing alcohol beverage (Bartoshuk, 1993).
Self-administration
In the first 15 min of self-administration, the participant was asked to push the beverage button and consume five 36 ml beverage deliveries (180 ml total containing 14 g of alcohol or one standard drink). During the remaining self-administration period, the participant could consume as much beverage as he or she wanted with two safety constraints. First, no participant was permitted to consume more than 30 beverage deliveries (i.e., six standard drinks) per hour. Second, if any BrAC measurement exceeded .12 g/210L, the participant was not permitted to consume any further drink or press the button for another drink until the BrAC level decreased to .09 g/210L. The number of drinks administered between each time point were observed and recorded by the research assistant and also recorded by the beverage dispenser. When not engaged in study activities, the participant was generally seated and were free to watch television, read, or play video games.
Subjective effects
Participants rated the stimulant (e.g., elated, energized) and sedative (e.g., heavy headed, inactive) subjective drug effects on a Likert scale ranging from 0 = “not at all” to 10 =“extremely” (Biphasic Alcohol Effects Scale, BAES, Martin et al. 1993). A visual analog scale assessed beverage liking (ranging from − 4 = “dislike very much” to + 4 = “like very much” and 0 = “neutral or no effect”). Subjective effects ratings for all items at all time points after drinking began were converted to change scores relative to the rating provided at the time point prior to drinking for each session. Change scores for the seven stimulant items and seven sedative items on the BAES were then averaged together to assess mean change in stimulant effects and mean change in sedative effects at each time point for each session. Participants rated ‘Want another drink right now’ on a visual analog scale ranging from 0 = “not at all” to 100 = “much more than usual” at all time points after the start of drinking. At these same time points, they rated perceived intoxication on a visual analog scale from 0 = “not at all” to 100 = “as intoxicated as I’ve ever been.” At 3 and 5.25 hr after the start of drinking, participants answered a multiple choice question about how much money they would be willing to pay for this beverage at a bar (i.e., More than $10.00, $10.00, $8.00, $6.00, $4.00, $2.00, $1.00, 50 cents, I would not buy this beverage at a bar) and were also asked whether they would: a) drive home (assuming they were not in the study and allowed to drive home) or b) find alternative transportation.
Psychomotor performance
As an objective measure of psychomotor impairment, participants completed the Circular Lights Task (Wayne Engineering, Skokie, IL) at each time point. This test of psychomotor impairment involves rapid hand-eye coordinated movements and the dependent measure is the number of correct button presses during a 60-s trial (e.g., Griffiths et al. 1983). Performance was analyzed as a proportion of the score at the time point before the start of drinking for each session. Lower proportions indicate poorer performance relative to the time point prior to drinking for each session.
Breath alcohol concentration
Expired air BrAC was measured using a handheld, evidential grade breathalyzer (Alco-Sensor IV, Intoximeters, Inc., St. Louis, MO). To prevent mouth alcohol contamination of readings, participants were required to rinse out their mouth with water immediately before breath alcohol measures.
Data Analysis
Each participant was categorized as a caffeine chooser or nonchooser based on whether he/she chose the caffeine-containing beverage to drink during the final self-administration session (Session 7). This categorization was independent of the participant’s self-reported reasons for choice described in the results. Exact binomial tests were used to statistically compare the ratio of choosers to nonchoosers within the sample, and the ratio of those who correctly guessed which beverage contained caffeine to those who guessed incorrectly. Data were examined during the first six self-administration sessions in order to compare number of self-administered drinks, BrAC, subjective effects, beverage liking, psychomotor impairment, willingness to drive, wanting another drink, perceived intoxication, and amount willing to pay for the drink when the beverage contained caffeine vs. no caffeine, and for caffeine choosers vs. nonchoosers. Data from the first six sessions were evaluated using repeated measures ANOVA with within-subjects factors of caffeine (caffeine vs. no caffeine), session (first, second, third), and time point (number of time points varied for different outcome measures) as well as the between-subjects factor of caffeine choice (caffeine chooser or nonchooser). Number of self-administered 36 ml drinks was examined as a session total.
The primary statistical outcomes were (1) the main effect of caffeine, (2) main effect of caffeine choice, (3) main effect of time point, (4) a caffeine by chooser interaction, (5) a caffeine by time point interaction, and (6) a time point by chooser interaction. Because willingness to drive home was assessed as a binary variable (i.e. Yes/No), this outcome was examined with repeated measures GEE for binary outcomes using within-subjects factors of caffeine, session, and time point as well as between-subjects factor of chooser (as above). For all analyses α = .05.
Results
Participants
Basic demographic information and frequency of caffeine use, alcohol use, and use of alcohol combined with caffeine are displayed in Table 1. The sample consisted of 18 men (58.1%) and 13 women (41.9%). Mean age of the sample was 25.3 years (SD = 3.6). The majority of participants identified as White (n = 21, 67.7%), with other participants identifying as Asian (n = 5, 16.1%), Black or African American (n = 4, 12.9%), and other (n = 1, 3.2%). The sample predominantly identified as Non-Hispanic (n = 29, 93.5%; 2 identified as Hispanic, 6.5%). Most of the sample indicated having tried alcohol combined with energy drinks at least once (n = 20; 65%). Those who had combined alcohol and energy drinks in the past described doing so almost never (n = 10; 32%) or infrequently (n = 10; 32%). No participants described how often they combined alcohol and energy drinks as “about half the time I drink”, “most of the time I drink”, or “almost every time I drink”.
Table 1.
Characteristics for the total sample and separately for caffeine choosers and nonchoosers
| Characteristic | Total sample (n = 31) |
Caffeine
Choosers (n = 20) |
Nonchoosers (n = 11) |
|||
|---|---|---|---|---|---|---|
| Demographics | ||||||
| Age in years, mean (SD) | 25.3 | (3.6) | 25.5 | (3.8) | 25.0 | (3.4) |
| Sex, count (%) | ||||||
| Male | 18 | (58.1) | 11 | (55.0) | 7 | (63.6) |
| Female | 13 | (41.9) | 9 | (45.0) | 4 | (36.4) |
| Race, count (%) | ||||||
| Asian | 5 | (16.1) | 2 | (10.0) | 3 | (27.3) |
| Black or African American | 4 | (12.9) | 2 | (10.0) | 2 | (18.2) |
| White | 21 | (67.7) | 15 | (75.0) | 6 | (54.5) |
| Other | 1 | (3.2) | 1 | (5.0) | ||
| Ethnicity, count (%) | ||||||
| Hispanic | 2 | (6.5) | 1 | (5.0) | 1 | (9.1) |
| Non-Hispanic | 29 | (93.5) | 19 | (95.0) | 10 | (90.9) |
| Level of Education, count (%) | ||||||
| High School Graduate | 2 | (6.5) | 2 | (10.0) | ||
| Some College | 5 | (16.1) | 4 | (20.0) | 1 | (9.1) |
| College Graduate | 20 | (64.5) | 11 | (55.0) | 9 | (81.8) |
| Graduate School | 4 | (12.9) | 3 | (15.0) | 1 | (9.1) |
| Alcohol and Caffeine Use | ||||||
| Alcohol use days per month, mean (SD) | 8.1 | (3.6) | 9.4* | (3.3) | 5.8 | (2.9) |
| Alcohol drinks per occasion, mean (SD) | 2.4 | (0.9) | 2.5 | (1.0) | 2.3 | (0.9) |
| Alcohol drinks per month, mean (SD) | 19.5 | (10.2) | 22.4* | (9.4) | 14.1 | (9.6) |
| Daily caffeine use (milligrams), mean (SD) | 159.5 | (67.6) | 156.9 | (59.3) | 164.1 | (83.7) |
| Combine alcohol and energy drinks, count (%) | ||||||
| Never | 11 | (35.5) | 6 | (30.0) | 5 | (45.5) |
| Almost Never | 10 | (32.3) | 7 | (35.0) | 3 | (27.3) |
| Infrequently | 10 | (32.3) | 7 | (35.0) | 3 | (27.3) |
Note. Demographic and alcohol and caffeine use information is presented for the total sample and separately for caffeine choosers and nonchoosers. Caffeine choosers are participants who chose to drink the beverage with caffeine on session 7.
Indicates that choosers and nonchoosers differed significantly (p ≤ .05)
Beverage Choice and Caffeine Discrimination
Of 31 participants, 20 (65%) chose to drink the beverage with caffeine during their final session, and 21 (68%) correctly guessed which beverage contained caffeine. Exact binomial tests indicate the p of 20 or more participants choosing alcohol with caffeine by chance is .07 (two-tailed p = .15), and the p of 21 or more participants correctly identifying the caffeinated beverage by chance is .04 (two-tailed p = .07). Roughly similar percentages of caffeine choosers and those who did not choose caffeine correctly guessed which beverage contained caffeine, 70% (n = 14) and 64% (n = 7), respectively. When asked the reasons for their choice, 17 participants indicated they chose the beverage because they thought it contained caffeine (13 of these were correct about which beverage had caffeine, 4 were incorrect). Thirteen participants indicated they chose the beverage because they thought the other beverage contained caffeine (7 were correct, 6 were incorrect). The reasons for beverage choice were not recorded for one caffeine chooser. Other (non-mutually exclusive) reasons for beverage choice were: wanting stimulant effects (e.g., feel more alert when drinking the beverage; n = 8), avoiding sedative effects (e.g., feel more sleepy when drinking the other beverage; n = 5), avoiding stimulant effects (e.g., feeling jittery when drinking the other beverage; n = 5). Six participants mentioned taste as part of the reason for beverage choice. Two indicated choosing the beverage because of “better” or “less bitter” taste, and four were attempting to use bitterness as a way to detect the presence of caffeine (only 2 out of these 4 participants correctly guessed which beverage contained caffeine).
Demographics and patterns of alcohol and caffeine use are compared between caffeine choosers and nonchoosers in Table 1. Caffeine choosers reported significantly more days of alcohol use per month (t(29) = 2.99, p = .006) and significantly more drinks per month (t(29) = 2.33, p = .03) than nonchoosers. Otherwise, the demographics of the caffeine choosers and nonchoosers generally were similar to each other and the overall sample.
Self-Administration
There was no significant difference in the number of self-administered 36 ml drinks during sessions when the beverage contained caffeine vs. when the beverage contained no caffeine (F(1, 29) = .94, p = .34; see Figure 1). Further, there was no significant difference in number of self-administered drinks between choosers and nonchoosers (F(1, 29) = 2.42, p = .13). There was a nonsignificant trend for nonchoosers to drink more of the beverage without caffeine (i.e., caffeine by chooser interaction; F(1, 29) = 2.66, p = .11).
Fig. 1.
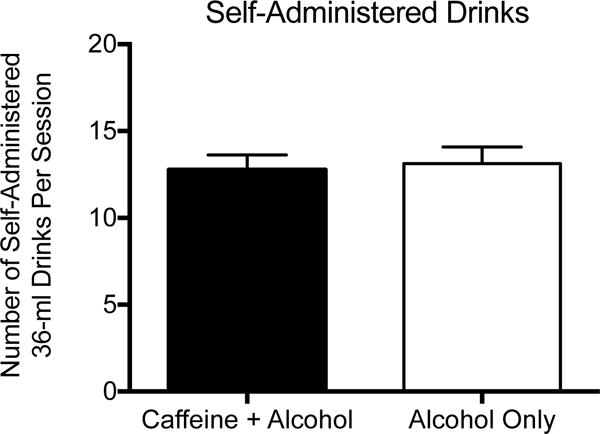
Number of self-administered alcohol drinks per session. Bars show means, brackets show 1 SEM above the mean from repeated measures ANOVA including the first 6 self-administration sessions. The filled bar shows data when the beverage contained caffeine and alcohol (60 mg caffeine per 180 ml of beverage + 14 g ethanol per 180 ml of beverage), and the unfilled bar shows data when the beverage contained alcohol, but no caffeine (2.2 mg quinine per 180 ml of beverage + 14 g ethanol per 180 ml of beverage)
Breath Alcohol Concentration
The top panel of Figure 2 shows BrAC as a function of time point of assessment for the alcohol beverage with and without caffeine. BrAC was not significantly affected by caffeine (F(1, 29) = 1.18, p = .29), nor were there significant caffeine interactions with time point (F(6, 174) = .39, p = .89) or caffeine choice (F(1, 29) = 2.60, p = .12). BrAC was not significantly different for choosers and nonchoosers (F(1, 29) = 2.15, p = .15), nor did caffeine choice interact with time point (F(6, 174) = .65, p = .69). There was a significant main effect of time point for BrAC (F(6, 174) = 104.61, p < .001). Figure 2 shows peak BrAC values occurring just before the end of the drinking period.
Fig 2.
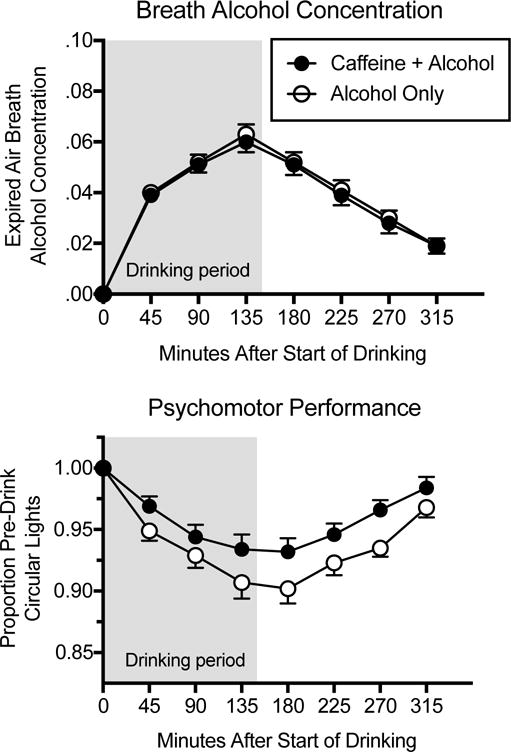
Breath alcohol concentration and proportion of pre-drinking performance on the Circular Lights psychomotor performance task. Data points show means, brackets show 1 SEM above or below the mean from repeated measures ANOVAs including the first 6 sessions as a function of time since the beginning of self-administration (the shaded area shows the self-administration period). Filled circles show data when the beverage contained caffeine and alcohol (60 mg caffeine per 180 ml of beverage + 14 g ethanol per 180 ml of beverage), and unfilled circles show data when the beverage contained alcohol, but no caffeine (2.2 mg quinine per 180 ml of beverage + 14 g ethanol per 180 ml of beverage)
Psychomotor Performance
As shown in the bottom panel of Figure 2, psychomotor performance tended to decrease during drinking relative to the time point prior to drinking, and gradually approached pre-drinking performance toward the end of the session. Caffeine significantly attenuated these decreases (F(1, 29) = 10.80, p = .003). There was no main effect of caffeine choice (F(1, 29) = .49, p = .49), no interaction between caffeine and caffeine choice (F(1, 29) = 1.58, p = .22), no interaction between caffeine choice and time point (F(6, 174) = .45, p = .85), and no interaction between caffeine and time point (F(6, 174) = 1.44, p = .20).
Beverage Liking
Ratings of beverage liking are displayed in Figure 3 as a function of time point in choosers (left panel) and nonchoosers (right panel) when the beverage did and did not contain caffeine. There was no significant main effect of caffeine or caffeine choice on beverage liking (F(1, 29) = 0, p = .99 and F(1, 29) = .33, p = .57, respectively), but there was a significant interaction between caffeine and caffeine choice (F(1, 29) = 9.85, p = .004) such that choosers reported liking the beverage containing caffeine more than the beverage without caffeine and nonchoosers reported liking the beverage without caffeine more than the beverage with caffeine. Follow-up analyses conducted within caffeine chooser and nonchooser groups indicate there was a significant main effect of caffeine on beverage liking for choosers (F(1, 19) = 9.10, p = .007), but the effect of caffeine on beverage liking was not significant in nonchoosers (F(1, 10) = 2.63, p = .14). In the main analysis including both caffeine choosers and nonchoosers, there was a significant main effect of time point (F(6, 174) = 7.99, p < .001), but time point did not significantly interact with caffeine choice (F(6, 174) = 1.89, p = .08) or caffeine (F(6, 174) = .68, p = .66).
Fig 3.
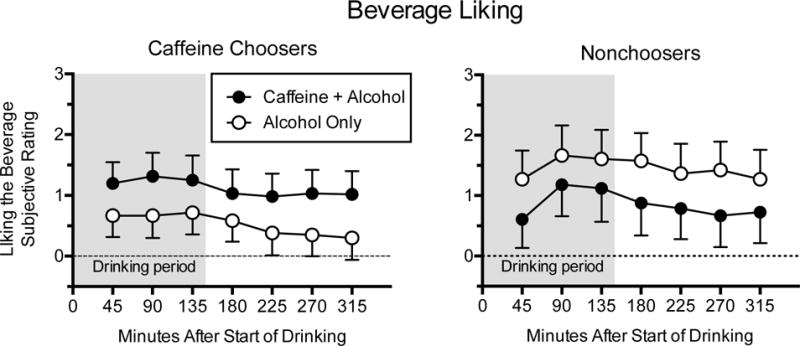
Subjective ratings of beverage liking. Data points show means, brackets show 1 SEM above or below the mean from repeated measures ANOVAs including the first 6 sessions as a function of time since the beginning of self-administration (the shaded area shows the self-administration period) in caffeine choosers (left panel) and nonchoosers (right panel). Caffeine choosers are participants who chose to drink the beverage with caffeine on session 7 (n = 20 caffeine choosers and n = 11 nonchoosers). Filled circles show data when the beverage contained caffeine and alcohol (60 mg caffeine per 180 ml of beverage + 14 g ethanol per 180 ml of beverage), and unfilled circles show data when the beverage contained alcohol, but no caffeine (2.2 mg quinine per 180 ml of beverage + 14 g ethanol per 180 ml of beverage). The 9-point scale for beverage liking ranged from - 4 = “dislike very much” to + 4 = “like very much” with 0 = “neutral or no effect”
Biphasic Alcohol Effects Scale
Mean change in subjective ratings for stimulant (upper panel) and sedative (lower panel) effects subscales on the BAES are displayed in Figure 4 as a function of time point in choosers (left panel) and nonchoosers (right panel) when beverage did and did not contain caffeine.
Fig 4.
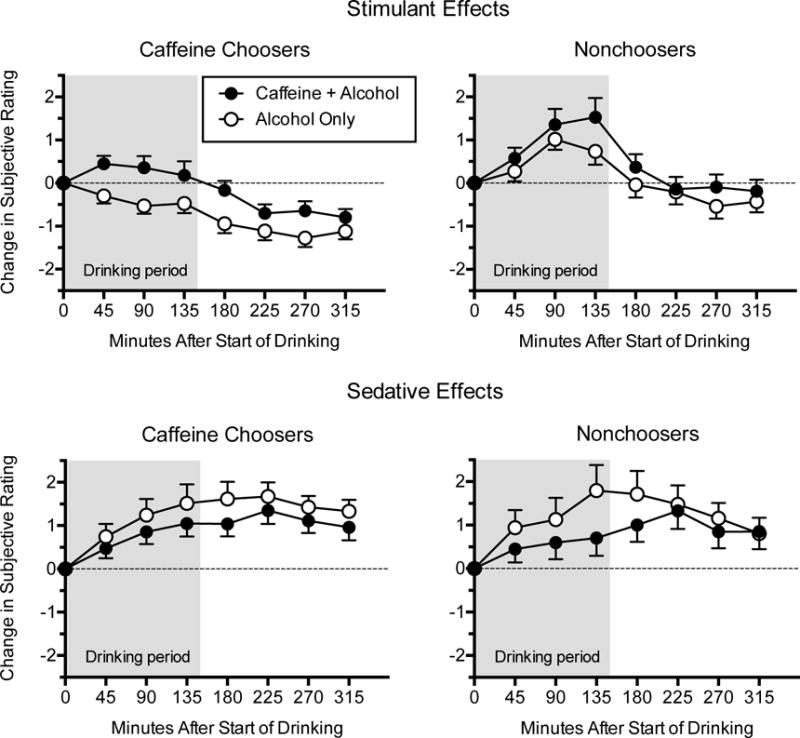
Subjective ratings of stimulant and sedative subscales on the Biphasic Alcohol Effects Scale. Data points show means, brackets show 1 SEM above or below the mean from repeated measures ANOVAs including the first 6 sessions as a function of time since the beginning of self-administration in caffeine choosers (left panel) and nonchoosers (right panel); shaded area shows the self-administration period. Caffeine choosers are participants who chose to drink the beverage with caffeine on session 7 (n = 20 caffeine choosers and n = 11 nonchoosers). Filled circles show data when the beverage contained caffeine and alcohol (60 mg caffeine per 180 ml of beverage + 14 g ethanol per 180 ml of beverage), and unfilled circles show data when the beverage contained alcohol, but no caffeine (2.2 mg quinine per 180 ml of beverage + 14 g ethanol per 180 ml of beverage)
Stimulant subscale
As suggested by data in the top panel of Figure 4, there was a significant main effect of caffeine on the stimulant subscale, such that changes on the stimulant subscale relative to the time point prior to drinking for each session were more positive when the beverage contained caffeine vs. when it did not (F(1, 29) = 7.25, p = .01). The effect of caffeine on stimulant ratings was not different for choosers vs. nonchoosers (i.e., caffeine × chooser interaction; F(1, 29) = .49, p = .49). There was a significant time point by caffeine interaction such that the tendency for stimulant ratings to be higher during caffeine sessions was generally greater at earlier time points (F(6, 174) = 2.62, p = .02). Overall, stimulant ratings varied significantly as a function of time point (F(6, 174) = 31.95, p < .001) reflecting greater stimulant effects during self-administration than at later time points. There was an overall difference in stimulant subjective effects for choosers vs. nonchoosers (i.e., main effect of chooser; F(1, 29) = 10.27, p = .003) and a difference in the pattern of stimulant subjective effects over time for choosers vs. nonchoosers (i.e., time point by chooser interaction; F(6, 174) = 3.40, p = .003). Overall, nonchoosers tended to show an increase in stimulant subjective effects during the drinking period for both beverages, whereas choosers of caffeine tended to show modest decreases in stimulant subjective effects during the drinking period when consuming alcohol only and modest increases in stimulant subjective effects when the beverage contained caffeine and alcohol.
Sedative subscale
As shown in the lower panel of Figure 4, increases in ratings on the sedative subscale were significantly lower when the beverage contained caffeine relative to when it did not (i.e., main effect of caffeine; F(1, 29) = 4.11, p = .05). A significant time point by caffeine interaction reflects that the effect of caffeine on sedative ratings tended to be greater at earlier time points (F(6, 174) = 2.77, p = .01). For sedative ratings, there was no main effect of caffeine choice (F(1, 29) = .07, p = .79), no significant caffeine by chooser interaction (F(1, 29) = .03, p = .86), and no significant time point by chooser interaction (F(6, 174) = .48, p = .82). A significant main effect of time point reflects increases then decreases in sedative ratings across time points during the session (F(6, 174) = 6.25, p < .001).
Additional Outcomes
There were no significant main effects of caffeine, main effects of caffeine choice, caffeine by chooser interactions, time point by chooser interactions, or time point by caffeine interactions for subjective ratings of willingness to drive, feelings of intoxication, wanting another drink, and dollar amount willing to pay for the beverage (see Table 2 and Table 3). However, there were significant main effects of time point for ratings of wanting another drink (F(6, 174) = 42.84, p < .001), perceived intoxication (F(6, 174) = 52.38, p < .001), and amount willing to pay for the drink (F(1, 29) = 5.51, p = .03), reflecting higher ratings during earlier parts of the session. In general, participants were significantly less willing to drive home at 3 hr after the start of administration than they were at 5.25-hr after the start of administration (i.e., log odds of willingness to drive at 3 hr were 2.29 less than log odds at 5.25-hr, Wald χ2 = 27, p < .001), which is consistent with the time course of BrAC and perceived intoxication.
Table 2.
Additional ratings across time point in caffeine choosers and nonchoosers for beverages with and without caffeine
| Caffeine Choosers |
Nonchoosers |
||||||||
|---|---|---|---|---|---|---|---|---|---|
| Caffeine + Alcohol |
Alcohol Only |
Caffeine + Alcohol |
Alcohol Only |
||||||
| Rating | Time Point | M | SEM | M | SEM | M | SEM | M | SEM |
| Want another drink right now a | +45 | 32.50 | 4.05 | 28.40 | 4.09 | 23.85 | 5.46 | 28.94 | 5.51 |
| +90 | 32.60 | 4.63 | 27.63 | 4.00 | 29.27 | 6.24 | 28.67 | 5.39 | |
| +135 | 30.75 | 4.56 | 25.77 | 4.12 | 23.58 | 6.15 | 28.27 | 5.56 | |
| +180 | 21.50 | 3.97 | 17.07 | 3.36 | 18.76 | 5.35 | 18.21 | 4.53 | |
| +225 | 15.03 | 2.90 | 10.45 | 2.61 | 12.91 | 3.91 | 14.06 | 3.53 | |
| +270 | 9.80 | 1.93 | 6.77 | 1.81 | 8.18 | 2.60 | 7.76 | 2.45 | |
| +315 | 7.02 | 1.66 | 5.08 | 1.34 | 6.76 | 2.24 | 3.64 | 1.80 | |
| How intoxicated do you feel right now a | +45 | 24.17 | 3.06 | 22.47 | 3.03 | 21.12 | 4.13 | 22.79 | 4.08 |
| +90 | 32.08 | 4.18 | 30.58 | 4.13 | 30.09 | 5.64 | 34.30 | 5.57 | |
| +135 | 35.68 | 5.31 | 35.55 | 5.00 | 34.21 | 7.16 | 39.09 | 6.74 | |
| +180 | 25.92 | 3.96 | 26.08 | 4.33 | 23.85 | 5.34 | 31.70 | 5.84 | |
| +225 | 15.52 | 2.76 | 16.25 | 2.71 | 13.73 | 3.72 | 16.58 | 3.65 | |
| +270 | 10.42 | 2.13 | 10.27 | 2.14 | 8.39 | 2.87 | 10.30 | 2.88 | |
| +315 | 6.40 | 2.02 | 6.00 | 1.51 | 4.27 | 2.72 | 5.03 | 2.04 | |
| Amount willing to pay for drink (USD) a | +180 | 2.07 | 0.36 | 1.78 | 0.34 | 1.41 | 0.49 | 1.70 | 0.45 |
| +315 | 1.85 | 0.34 | 1.54 | 0.33 | 1.33 | 0.46 | 1.47 | 0.44 | |
Note. Means (M) and standard error of the mean (SEM) from repeated measures ANOVAs presented across time points since the beginning of self-administration in caffeine choosers and nonchoosers for beverages with and without caffeine. Caffeine choosers are participants who chose to drink the beverage with caffeine on session 7 (n = 20 caffeine choosers and n = 11 nonchoosers). There was no significant (p ≤ .05) main effect of caffeine, main effect of chooser status, caffeine by chooser interaction, time point by chooser interaction, or time point by caffeine interaction. Subscript a indicates a significant main effect of time point
Table 3.
Willingness to drive across time point in caffeine choosers and nonchoosers for beverages with and without caffeine
| Caffeine Choosers |
Nonchoosers |
||||
|---|---|---|---|---|---|
| Caffeine + Alcohol |
Alcohol Only |
Caffeine + Alcohol |
Alcohol Only |
||
| Variable | Time Point | Mean Percent | Mean Percent | Mean Percent | Mean Percent |
| Indicated willingness to drive a | +180 | 23% | 25% | 33% | 30% |
| +315 | 80% | 77% | 85% | 79% |
Note. The percent of each group (caffeine choosers and nonchoosers) that indicated a willingness to drive at each time point averaged across sessions is displayed in the table. Willingness to drive was examined using repeated measures GEE for binary outcomes as described in text. There was no significant (p ≤ .05) main effect of caffeine, main effect of chooser, caffeine by chooser interaction, time point by chooser interaction, or time point by caffeine interaction. Subscript a indicates a significant main effect of time point
Discussion
The design of the current study permitted examination of the effects of added caffeine on multiple dimensions of alcohol self-administration including beverage choice, number of self-administered drinks, and subjective effect ratings. After equal exposure to both beverage conditions in six initial self-administration sessions, a majority of participants (65%) chose to drink the alcohol beverage containing caffeine instead of the alcohol beverage without caffeine on their final session. The tendency to choose the alcohol-caffeine beverage may be because added caffeine significantly increased stimulant drug effects and decreased sedative drug effects relative to the alcohol only beverage (see Figure 4).
The effects of caffeine on subjective stimulant and sedative drug effect ratings are consistent with the neuropharmacology of caffeine, which is an adenosine antagonist at A1 and A2A receptors. Co-administration of caffeine and alcohol may attenuate the sedative effects of alcohol by blocking alcohol-related increases in extracellular adenosine and increase the stimulant effects of alcohol by potentiating alcohol-induced dopamine release via the A2A-D2 receptor heteromer (Ferré 2016; Ferré and O’Brien 2011). Increases in stimulant drug effects and decreases in sedative drug effects under caffeine conditions are also consistent with previous literature (Buela-Casal et al. 1994; Drake et al. 2003; Ferreira et al. 2006; Marczinski et al. 2012; Peacock et al. 2013b; Smith 2013).
Expectancy may have played a role in subjective effects for the present study, because participants were aware that caffeine and alcohol would be administered and because after repeated exposure to both beverages the majority of the participants (n = 21, 68%) ultimately identified which beverage contained caffeine. In previous research, many alcohol drinkers agree with statements that alcoholic beverages mixed with energy drinks allow one to “stay alert longer,” to have “more energy to party,“ and to “get high or ‘buzzed’ quicker,” which would be consistent with the increased stimulant effects in the present study under caffeine conditions (MacKillop et al. 2012). It should be noted, however, that the guess as to which beverage contained caffeine occurred after repeated, double-blind administration of the study beverage. It is reasonable to think that the choice of beverage and the guess as to which beverage contained caffeine were guided by repeated experience with differential subjective effects of the two study beverages, rather than prior expectations primarily guiding the reported subjective effects. Many participants reported subjective effects as a reason for choice, and there was little evidence that participants could determine the presence of caffeine by methods other than noting differences in subjective effects (e.g., taste, bitterness). Future research should directly assess how expectancy for the effects of caffeine (e.g., Heinz et al. 2009), alcohol (e.g., Hull and Bond 1986), or combined caffeine and alcohol (MacKillop et al. 2012) may affect subjective ratings, beverage choice, and self-administration.
Contrary to what may be expected given the association between caffeine and alcohol use and increased alcohol consumption (e.g., O’Brien et al. 2008; Pennay et al. 2015; Thombs et al. 2010; Thombs et al. 2011; Verster et al. 2015) or increased desire for alcohol (Heinz et al. 2013; Marczinski et al. 2013; Marczinski et al. 2016; McKetin and Coen, 2014), in the present study, added caffeine did not affect the number of self-administered drinks. There may be several explanations for this result. In an effort to recruit participants who would be sensitive to modest doses of alcohol, study participation was constrained to individuals who drank on average four or fewer drinks per drinking occasion. In order to isolate the role of caffeine on alcohol self-administration, we used a fruit-flavored drink vehicle rather than using energy drinks. Thus, the present study did not address the potential role of energy drink components other than caffeine (e.g., taurine) in facilitating increased alcohol consumption. This study also limited alcohol self-administration to a fixed period of time during the experimental session. In naturalistic settings, greater alcohol consumption may occur because the duration of the drinking period is extended rather than drinking more over the same period of time. Therefore, increased alcohol consumption associated with caffeinated alcohol beverages observed in previous research may be because individuals drinking caffeine with alcohol choose to drink for longer periods of time, perhaps because of the reduced sedative effects such as was observed here. Further, our safety criteria may have limited some participants drinking as much as they wanted. No participants attempted to consume more than 30 beverage deliveries per hour, but nine participants’ BrAC exceeded .12 g/210L, which required a pause in drinking until BrAC decreased to .09 g/210L, for at least one time point (the most was three time points above .12 g/210L) throughout the seven sessions. Knowledge that high BrAC readings could have extended the length of they session may have deterred participants from consuming more alcohol, but the effects of this were likely minimized by the fixed 3.5 hour post-drinking period. It is possible that a different pattern of results would be obtained with heavier alcohol drinkers, if the study used energy drink mixers rather than fruit juice, or if participants were allowed to choose the length of their self-administration.
Because the study allowed participants to choose which beverage they drank on the final self-administration session, it is possible to compare the pattern of results for caffeine choosers relative to nonchoosers. As mentioned previously, the categorization as a caffeine chooser or nonchooser is descriptive and not meant to imply an explicit knowledge of the presence of caffeine or an explicit desire for caffeine. With regard to subjective effects, caffeine further increased stimulant alcohol effects and attenuated sedative drug effects relative to alcohol alone in the same manner for caffeine choosers and nonchoosers (see Figure 4). However, there was a significant difference in the overall pattern of stimulant drug effects for caffeine choosers relative to nonchoosers. Caffeine choosers overall showed less stimulant drug effects when consuming the study beverage relative to nonchoosers (Figure 4, top row). Nonchoosers tended to show increases relative to pre-drinking ratings in stimulant drug effects during the self-administration period for both beverages (Figure 4, top row, right panel), whereas caffeine choosers tended to show modest decreases in stimulant drug effects when drinking alcohol only and modest increases in stimulant drug effects when drinking caffeine and alcohol (Figure 4, top row, left panel). Although there were no significant differences in number of self-administered drinks or BrAC between caffeine choosers and nonchoosers, there was a nonsignificant trend for nonchoosers to drink more of the beverage without caffeine. These differences in self-administration may have contributed in part to differences in subjective ratings. Overall, though, these data suggest that decreased stimulant effects of alcohol may predict choice of combined caffeine and alcohol beverages. The decreased stimulant effects of alcohol as a predictor of choosing to drink the caffeine and alcohol beverage in the present study is consistent with prior studies showing that a low level of response to alcohol (e.g., lower rating of subjective “high”) is a predictor of later alcohol use disorders (e.g., Schuckit 1994). The present study suggests decreased response to modest doses of alcohol may be a common predictor of both caffeine and alcohol co-use and alcohol-related problems.
It is also noteworthy that there were pre-existing differences between caffeine choosers and nonchoosers in self-reported alcohol drinking behavior outside of the study. Caffeine choosers reported significantly more self-reported alcohol drinking days and alcohol drinks per month than nonchoosers. Self-reported caffeine consumption and other demographic variables, including prior history of combining alcohol and caffeinated energy drinks, were comparable across these self-selected groups. In this sample, the combination of alcohol and energy drinks outside of the laboratory occurred at generally low rates (i.e., n = 21 or 68% reported never or almost never combining alcohol and energy drinks). The low rate of combined alcohol and caffeine use in the sample may explain why there was no significant difference in prior history of combining alcohol and energy drinks between caffeine choosers and nonchoosers. Therefore, an interesting observation is that, in a sample with relatively infrequent prior use of caffeine combined with alcohol, prior heavier drinking was associated with choice of combined caffeine and alcohol in the laboratory. Prior research has frequently assumed that the correlation between combining caffeine and alcohol and heavy alcohol use reflects a causal relationship (e.g., alcohol combined with caffeine leads to heavier drinking; c.f., Rossheim et al. 2016). Pre-existing differences in alcohol drinking behavior that related to beverage choice during the study, combined with data suggesting no acute effect of added caffeine on the number of self-administered drinks, raises an alternative possibility that heavy drinking may predispose individuals to consume caffeinated alcohol beverages.
The present study provides new data about the effects of added caffeine on alcohol self-administration. The majority of the sample chose to consume the alcohol beverage containing caffeine in preference to the alcohol alone beverage on the final session. However, added caffeine did not increase the number of alcohol drinks consumed during the six self-administration sessions that preceded the choice. Future work should test the generality of these findings with respect to different experimental circumstances and examine the pattern of results across different populations. For example, it may be useful to compare regular consumers of alcohol mixed with energy drinks with infrequent consumers, younger participants with older participants, or males with females. Overall, the study suggests that decreased stimulant effects of alcohol and heavier drinking may be useful prospective predictors of drinking combined caffeine and alcohol beverages, a finding relevant to efforts to identify individuals who may benefit from interventions to reduce risk behaviors associated with combining alcohol mixed with energy drinks.
Acknowledgments
National Institutes on Drug Abuse grant R01DA003890 supported this work. NIDA grant T32DA07209 supported Mary Sweeney, Steven Meredith and Daniel Evatt. The authors thank Zainab Jackson for her assistance in conducting this research.
Footnotes
Author Note: Steven Meredith is now at the University of Connecticut Health Center, Calhoun Cardiology Center, 263 Farmington Avenue, Farmington, Connecticut 06030, USA. Daniel Evatt is now at the Defense Centers of Excellence for Psychological Health and Traumatic Brain Injury, 1335 East-West Highway, Silver Spring, Maryland 20910, USA.
Conflict of Interest: The authors declare that they have no conflict of interest.
References
- Bartoshuk LM. The biological basis of food perception and acceptance. Food Qual Prefer. 1993;4:21–32. [Google Scholar]
- Buela-Casal G, Sierra J, Caballo V, Lega L. Effects of alcohol and caffeine on some aspects of driving. Med Sci Res. 1994;22:515–517. [Google Scholar]
- Chutuape MA, de Wit H. Relationship between subjective effects and drug preferences: Ethanol and diazepam. Drug Alcohol Depend. 1994;34:243–251. doi: 10.1016/0376-8716(94)90163-5. [DOI] [PubMed] [Google Scholar]
- Dietze MA, Kulkosky PJ. Effects of caffeine and bombesin on ethanol and food intake. Life Sci. 1991;48:1837–1844. doi: 10.1016/0024-3205(91)90239-8. [DOI] [PubMed] [Google Scholar]
- Drake CL, Roehrs T, Turner L, Scofield HM, Roth T. Caffeine reversal of ethanol effects on the multiple sleep latency test, memory, and psychomotor performance. Neuropsychopharmacology. 2003;28:371–378. doi: 10.1038/sj.npp.1300026. [DOI] [PubMed] [Google Scholar]
- Evans SM, Griffiths RR, de Wit H. Preference for diazepam, but not buspirone, in moderate drinkers. Psychopharmacology (Berl) 1996;123:154–163. doi: 10.1007/BF02246172. [DOI] [PubMed] [Google Scholar]
- Ferré S. Mechanisms of the psychostimulant effects of caffeine: Implications for substance use disorders. Psychopharmacology (Berl) 2016 doi: 10.1007/s00213-016-4212-2. [DOI] [PMC free article] [PubMed] [Google Scholar]
- Ferré S, O’Brien MC. Alcohol and caffeine: The perfect storm. J Caffeine Res. 2011;1:153–162. doi: 10.1089/jcr.2011.0017. [DOI] [PMC free article] [PubMed] [Google Scholar]
- Ferreira SE, De Mello MT, Pompéia S, Souza-Formigoni MLO. Effects of energy drink ingestion on alcohol intoxication. Alcohol Clin Exp Res. 2006;30:598–605. doi: 10.1111/j.1530-0277.2006.00070.x. [DOI] [PubMed] [Google Scholar]
- Ferreira SE, Quadros IM, Trindade ÁA, Takahashi S, Koyama RG, Souza-Formigoni ML. Can energy drinks reduce the depressor effect of ethanol? An experimental study in mice. Physiol Behav. 2004;82:841–847. doi: 10.1016/j.physbeh.2004.06.017. [DOI] [PubMed] [Google Scholar]
- Ferreira SE, Abrahao KP, Souza-Formigoni ML. Expression of behavioral sensitization to ethanol is increased by energy drink administration. Pharmacol Biochem Behav. 2013;110:245–248. doi: 10.1016/j.pbb.2013.07.014. [DOI] [PubMed] [Google Scholar]
- Food and Drug Administration. Update on caffeinated alcoholic beverages: FDA announces progress on removal of certain caffeinated alcoholic beverages from the market. 2010a http://www.fda.gov/NewsEvents/PublicHealthFocus/ucm234900.htm.
- Food and Drug Administration. Serious concerns over alcoholic beverages with added caffeine. 2010b http://www.fda.gov/ForConsumers/ConsumerUpdates/ucm233987.htm.
- Fritz BM, Companion M, Boehm SL. Wired,” yet intoxicated: Modeling binge caffeine and alcohol co-consumption in the mouse. Alcohol Clin Exp Res. 2014;38:2269–2278. doi: 10.1111/acer.12472. [DOI] [PMC free article] [PubMed] [Google Scholar]
- Griffiths RR, Bigelow GE, Liebson I. Differential effects of diazepam and pentobarbital on mood and behavior. Arch Gen Psychiatry. 1983;40:865–873. doi: 10.1001/archpsyc.1983.01790070055007. [DOI] [PubMed] [Google Scholar]
- Heinz AJ, de Wit H, Lilje TC, Kassel JD. The combined effects of alcohol, caffeine, and expectancies on subjective experience, impulsivity, and risk-taking. Exp Clin Psychopharmacol. 2013;21:222–234. doi: 10.1037/a0032337. [DOI] [PMC free article] [PubMed] [Google Scholar]
- Heinz AJ, Kassel JD, Smith EV. Caffeine expectancy: Instrument development in the Rasch measurement framework. Psychol Addict Behav. 2009;23:500–511. doi: 10.1037/a0016654. [DOI] [PubMed] [Google Scholar]
- Hull JG, Bond CF. Social and behavioral consequences of alcohol consumption and expectancy: A meta-analysis. Psychol Bull. 1986;99:347–360. [PubMed] [Google Scholar]
- Kponee KZ, Siegel M, Jernigan DH. The use of caffeinated alcoholic beverages among underage drinkers: Results of a national survey. Addict Behav. 2014;39:253–258. doi: 10.1016/j.addbeh.2013.10.006. [DOI] [PMC free article] [PubMed] [Google Scholar]
- Kunin D, Gaskin S, Rogan F, Smith BR, Amit Z. Caffeine promotes ethanol drinking in rats: Examination using a limited-access free choice paradigm. Alcohol. 2000;21:271–277. doi: 10.1016/s0741-8329(00)00101-4. [DOI] [PubMed] [Google Scholar]
- MacKillop J, Howland J, Rohsenow DJ, Few LR, Amlung MT, Metrik J, Calise TV. Initial development of a measure of expectancies for combinations of alcohol and caffeine: The Caffeine + Alcohol Combined Effects Questionnaire (CACEQ) Exp Clin Psychopharmacol. 2012;20:466–472. doi: 10.1037/a0030539. [DOI] [PMC free article] [PubMed] [Google Scholar]
- Marczinski CA, Fillmore MT, Stamates AL, Maloney SF. Desire to drink alcohol is enhanced with high caffeine energy drink mixers. Alcohol Clin Exp Res. 2016;40:1982–1990. doi: 10.1111/acer.13152. [DOI] [PMC free article] [PubMed] [Google Scholar]
- Marczinski CA, Fillmore MT, Henges AL, Ramsey MA, Young CR. Mixing an energy drink with an alcoholic beverage increases motivation for more alcohol in college students. Alcohol Clin Exp Res. 2013;37:276–283. doi: 10.1111/j.1530-0277.2012.01868.x. [DOI] [PMC free article] [PubMed] [Google Scholar]
- Marczinski CA, Fillmore MT, Henges AL, Ramsey MA, Young CR. Effects of energy drinks mixed with alcohol on information processing, motor coordination and subjective reports of intoxication. Exp Clin Psychopharmacol. 2012;20:129. doi: 10.1037/a0026136. [DOI] [PMC free article] [PubMed] [Google Scholar]
- Marczinski CA. Alcohol mixed with energy drinks: Consumption patterns and motivations for use in U.S. college students. Int J Environ Res Public Health. 2011;8:3232–3245. doi: 10.3390/ijerph8083232. [DOI] [PMC free article] [PubMed] [Google Scholar]
- Martin CS, Earleywine M, Musty RE, Perrine MW, Swift RM. Development and validation of the Biphasic Alcohol Effects Scale. Alcohol Clin Exp Res. 1993;17:140–146. doi: 10.1111/j.1530-0277.1993.tb00739.x. [DOI] [PubMed] [Google Scholar]
- Martz ME, Patrick ME, Schulenberg JE. Alcohol mixed with energy drink use among U.S. 12th-grade students: prevalence, correlates, and associations with unsafe driving. J Adolesc Health. 2015;56:557–563. doi: 10.1016/j.jadohealth.2015.01.019. [DOI] [PMC free article] [PubMed] [Google Scholar]
- McKetin R, Coen A. The effect of energy drinks on the urge to drink alcohol in young adults. Alcohol Clin Exp Res. 2014;38:2279–2285. doi: 10.1111/acer.12498. [DOI] [PubMed] [Google Scholar]
- McKetin R, Coen A, Kaye S. A comprehensive review of the effects of mixing caffeinated energy drinks with alcohol. Drug Alcohol Depend. 2015;151:15–30. doi: 10.1016/j.drugalcdep.2015.01.047. [DOI] [PubMed] [Google Scholar]
- Meredith SE, Sweeney MM, Johnson PS, Johnson MW, Griffiths RR. Weekly energy drink use is positively associated with delay discounting and risk behavior in a nationwide sample of young adults. J Caffeine Res. 2016;6:10–19. doi: 10.1089/jcr.2015.0024. [DOI] [PMC free article] [PubMed] [Google Scholar]
- Mintzer MZ, Griffiths RR. Alcohol and false recognition: A dose-effect study. Psychopharmacology (Berl) 2001;159:51–57. doi: 10.1007/s002130100893. [DOI] [PubMed] [Google Scholar]
- O’Brien MC, McCoy TP, Rhodes SD, Wagoner A, Wolfson M. Caffeinated cocktails: Energy drink consumption, high-risk drinking, and alcohol-related consequences among college students. Acad Emerg Med. 2008;15:453–460. doi: 10.1111/j.1553-2712.2008.00085.x. [DOI] [PubMed] [Google Scholar]
- Peacock A, Bruno R, Martin FH. Patterns of use and motivations for consuming alcohol mixed with energy drinks. Psychol Addict Behav. 2013a;27:202–206. doi: 10.1037/a0029985. [DOI] [PubMed] [Google Scholar]
- Peacock A, Bruno R, Martin FH, Carr A. The impact of alcohol and energy drink consumption on intoxication and risk-taking behavior. Alcohol Clin Exp Res. 2013b;37:1234–1242. doi: 10.1111/acer.12086. [DOI] [PubMed] [Google Scholar]
- Pennay A, Miller P, Busija L, Jenkinson R, Droste N, Quinn B, Jones SC, Lubman DI. ‘Wide-awake drunkenness’? Investigating the association between alcohol intoxication and stimulant use in the night-time economy. Addiction. 2015;110:356–365. doi: 10.1111/add.12742. [DOI] [PubMed] [Google Scholar]
- Reissig CJ, Strain EC, Griffiths RR. Caffeinated energy drinks-A growing problem. Drug Alcohol Depend. 2009;99:1–10. doi: 10.1016/j.drugalcdep.2008.08.001. [DOI] [PMC free article] [PubMed] [Google Scholar]
- Rezvani AH, Sexton HG, Johnson J, Wells C, Gordon K, Levin ED. Effects of caffeine on alcohol consumption and nicotine self-administration in rats. Alcohol Clin Exp Res. 2013;37:1609–1617. doi: 10.1111/acer.12127. [DOI] [PMC free article] [PubMed] [Google Scholar]
- Rossheim ME, Thombs DL, Weiler RM, Barry AE, Suzuki S, Walters ST, Barnett TE, Paxton RJ, Pealer LN, Cannell B. Alcohol mixed with energy drink: Use may be a consequence of heavy drinking. Addict Behav. 2016;57:55–61. doi: 10.1016/j.addbeh.2016.02.013. [DOI] [PubMed] [Google Scholar]
- Rutledge PC, Bestrashniy JRBM, Nelson TF. Problematic drinking among postgraduate students: Binge drinking, prepartying, and mixing alcohol with energy drinks. Subst Use Misuse. 2016;51:1–11. doi: 10.3109/10826084.2016.1152499. [DOI] [PubMed] [Google Scholar]
- Schuckit MA. Low level of response to alcohol as a predictor of future alcoholism. Am J Psychiatry. 1994;151:184–189. doi: 10.1176/ajp.151.2.184. [DOI] [PubMed] [Google Scholar]
- Smith AP. Effects of caffeine and alcohol on mood and performance changes following consumption of lager. Psychopharmacology (Berl) 2013;227:595–604. doi: 10.1007/s00213-013-2991-2. [DOI] [PubMed] [Google Scholar]
- Stahre M, Roeber J, Kanny D, Brewer RD, Zhang X. Contribution of excessive alcohol consumption to deaths and years of potential life lost in the United States. Prev Chronic Dis. 2014;11:130293. doi: 10.5888/pcd11.130293.. [DOI] [PMC free article] [PubMed] [Google Scholar]
- Thombs DL, O’Mara RJ, Tsukamoto M, Rossheim ME, Weiler RM, Merves ML, Goldberger BA. Event-level analyses of energy drink consumption and alcohol intoxication in bar patrons. Addict Behav. 2010;35:325–330. doi: 10.1016/j.addbeh.2009.11.004. [DOI] [PubMed] [Google Scholar]
- Thombs D, Rossheim M, Barnett TE, Weiler RM, Moorhouse MD, Coleman BN. Is there a misplaced focus on AmED? Associations between caffeine mixers and bar patron intoxication. Drug Alcohol Depend. 2011;116:31–36. doi: 10.1016/j.drugalcdep.2010.11.014. [DOI] [PubMed] [Google Scholar]
- Verster JC, Benjaminsen JM, van Lanen JH, van Stavel NM, Olivier B. Effects of mixing alcohol with energy drink on objective and subjective intoxication: results from a Dutch on-premise study. Psychopharmacology (Berl) 2015;232:835–842. doi: 10.1007/s00213-014-3715-y. [DOI] [PMC free article] [PubMed] [Google Scholar]
- Vida K, Rácz J. Prevalence and consequences of the consumption of alcohol mixed with energy drinks :A literature review. J Caffeine Res. 2015;5:11–30. [Google Scholar]
- Wells BE, Kelly BC, Pawson M, Leclair A, Parsons JT, Golub SA. Correlates of concurrent energy drink and alcohol use among socially active adults. Am J Drug Alcohol Abuse. 2013;39:8–15. doi: 10.3109/00952990.2012.720320. [DOI] [PMC free article] [PubMed] [Google Scholar]
- World Health Organization. Global staus report on alcohol and health. World Health Organization; Geneva: 2014. [Google Scholar]