
Figure 3.
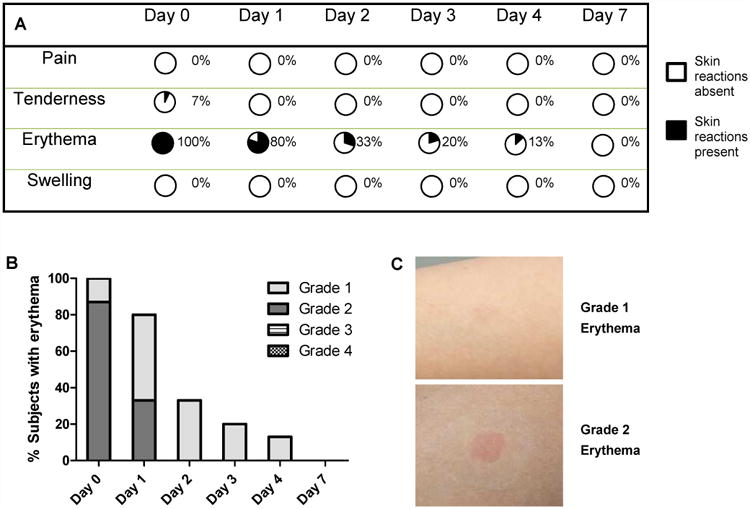
Skin tolerability after microneedle patch application. Skin sites were monitored and scored over a period of one week. (A) Summary of the prevalence of skin reactions at different time points. Percentages indicate the presence of skin reactions. (B) Intensity of erythema in the skin after microneedle patch application. Column bars show the percentage of subjects with different grades of erythema. None of the subjects had Grade 3 or 4 erythema scores. (C) Representative images of skin showing Grade 1 and Grade 2 erythema.