

Summary
We describe a spraying-plunging method for preparing cryo-EM grids with vitreous ice of controllable, highly consistent thickness using a microfluidic device. The new polydimethylsiloxane (PDMS)-based sprayer was tested with apoferritin. We demonstrate that the structure can be solved to high resolution with this method of sample preparation. Besides replacing the conventional pipetting-blotting-plunging method, one of many potential applications of the new sprayer is in time-resolved cryo-EM, as part of a PDMS-based microfluidic reaction channel to study short-lived intermediates on the time-scale of 10 to 1000 ms.
Keywords: apoferritin, EM grid preparation, ice thickness, PDMS-based microsprayer, time-resolved cryo-EM
eTOC blurb
Feng et al. present a novel microspraying-plunging method to prepare cryo-grids with vitreous ice of controllable, consistent thickness. Its performance is demonstrated by a 3.0-Å structure from ~4300 particles collected on grids sprayed with apoferritin suspension. One of many potential applications of the new sprayer is in time-resolved cryo-EM.

Introduction
Single-particle cryo-EM(Frank, 2006; Penczek et al., 1992) is a powerful technique in structural biology as it provides near-atomic-resolution structures for macromolecular assemblies in close-to-native conditions(Bartesaghi et al., 2015; Liu et al., 2016a). For more than three decades, the pipetting-blotting-plunging method(Adrian et al., 1984), by which the solution containing the molecules is applied to a cryo-EM grid via manual pipetting, then excess liquid is blotted away by filter paper, and next the grid is rapidly plunged into the cryogen, has been widely employed to prepare cryo-EM grids. This method has been used for all structures recently resolved at high resolution(Campbell et al., 2015; Du et al., 2015; Grant and Grigorieff, 2015; Guo et al., 2014; Li et al., 2015; Liu et al., 2016b; Merk et al., 2016; Sun et al., 2015; Wong et al., 2014; Wu et al., 2016; Yu et al., 2011). However, obtaining cryo-EM grids with highly consistent ice thickness is a major challenge(Razinkov et al., 2016) as the surface topography of blotting paper makes the blotting process uncontrollable and irreproducible. These problems motivated us to look for an alternative method yielding a more reliable and reproducible preparation of the cryo-EM sample.
The use of a sprayer to deposit sample onto the EM grid was introduced by Berriman and Unwin(Berriman and Unwin, 1994) as part of a novel method of time-resolved imaging, for studying transient states of the acetylcholine receptor(Unwin, 1995; Unwin and Fujiyoshi, 2012; Walker et al., 1995). In their experiment, a grid containing helical assemblies of the acetylcholine receptor was prepared in the standard way by pipetting-blotting and then sprayed with droplets of acetylcholine, setting off a reaction directly on the grid, which was subsequently plunged into the cryogen. In more recent implementations of time-resolved cryo-EM imaging, a reaction was performed directly in a microfluidic chip, and the reaction product was sprayed onto a dry EM grid(Lu et al., 2014; Lu et al., 2009; Shaikh et al., 2014). It is also worthwhile to mention that another kind of system called Spotion (Jain et al., 2012; Razinkov et al., 2016) was designed for dispensing specimen onto the EM-grid on the scale of picoliter to nanoliter volumes through piezo-electric inkjet technology, with which single droplets size is accurately controlled. However, this system is currently not suitable for time-resolved cryo-EM imaging. Conceivably, the piezo-electric inkjet head could be integrated with a micromixer and a microreactor, and the required spreading time of the droplet on the grid could be reduced to less than 10 milliseconds in a future design.
While time-resolved imaging is one of the promising applications of the sprayer, we focus here on its use as a means of controlled deposition of any sample on the grid, bypassing the need for pipetting and blotting. This aim entails the redesign of the sprayer since existing sprayers and spraying strategies produce droplets with varying ice thickness and varying coverage of the area available for imaging. As a consequence, the quality of data collected is generally inferior to that obtained by conventional means.
We designed a novel microsprayer chip for preparing cryo-grids. Use of PDMS as a base renders the chip easily-integrated with other microfluidic PDMS-based devices of different fluidic operations, such as micro-mixers and micro-reaction channels. This microsprayer chip has the potential to become widely adopted since its fabrication is cost-effective, highly reproducible, and easily modified. To characterize the performance of the microsprayer, the ice thickness under different spraying conditions was measured with the aim of identifying optimal parameters suitable for imaging. To demonstrate the performance of the sprayer under optimized conditions, we sprayed a suspension of apoferritin and determined its structure from ~4300 particles 3.0 Å resolution.
Results
Microsprayer chip design and experimental setup
A microsprayer (Figure 1A) was designed and fabricated (see STAR Methods for details) to generate a three-dimensional cone plume of sprayed droplets. This chip contains five components, glass slide and four PDMS-based components: channel for liquid, channel for nitrogen gas, liquid injector for producing liquid injector, and gas nozzle. Because of the presence of a mixing chamber inside the sprayer nozzle, the device is called an internal-mixing round-jet microsprayer (Lefebvre, 1980). Thus its design is different from that of Lu et al. (Lu et al., 2014; Lu et al., 2009), which is characterized by external mixing, prefilming, spraying and discharge of a thin sheet of droplets from their sprayer (see also STAR Methods for our rationale for choosing the internal-mixing principle).
Figure 1.
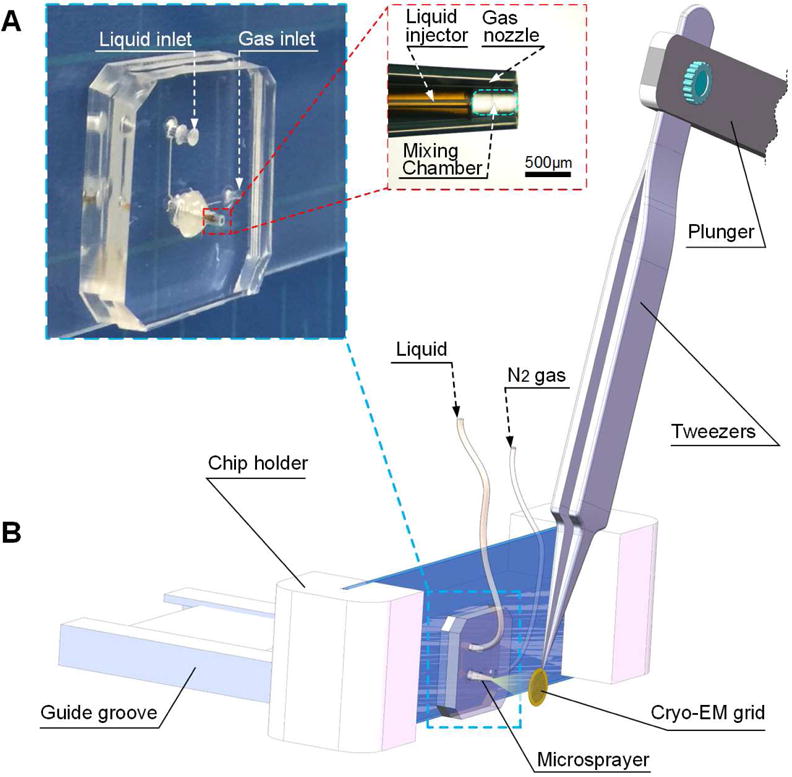
Design of the microsprayer chip and the schematic diagram of the experimental setup (A) Design of the microsprayer chip. The sprayer is composed of the liquid injector and gas nozzle with orifice diameters of 75 and 360 μm, respectively. The space between these two orifices is 500 μm long and forms the mixing chamber. The liquid is introduced into the microsprayer chip, issuing from the liquid injector as a cylindric liquid jet. Simultaneously, the nitrogen gas is fed into the chip, regulated by the gas nozzle as a co-flowing gas stream surrounding the liquid jet in the mixing chamber, which facilitates the atomization. (B) The experimental setup. The position of the tweezers shown is only one transient point of its trajectory (see Figure S1), with the cryo-EM grid in the process of intersecting the spray plume. For adjustment of the precise position of the microsprayer nozzle, the chip holder can be slid back and forth in the guide groove and the microsprayer chip can be slid up and down in the chip holder. Hence the solution in the form of droplets is sprayed onto the EM grid, which is then quickly plunged into the cryogen (see also Figure S1). The resulting grid bears thin blobs of vitreous ice where the droplets have impinged on the grid surface. See also Figure S1 and Supplemental movies.
The setup for testing the chip is shown in Figure 1B and Figure S1. The chip was held vertically in the chip holder, with the nozzle facing the cryo-EM grid. PBS buffer solution was fed into the device through 1/16″ polyetheretherketone (PEEK) capillary tubing (125 μm inner diameter) and 2.0 μm PEEK micro filters controlled by a computer-assisted liquid-pumping and grid-plunging apparatus designed by Howard White(White et al., 2003; White et al., 1998). Ea EM grid to be tested was mounted on sharp-tip tweezers. The angle between the tweezers and the plunger is manually adjustable for pre-alignment of grid trajectory with the spray cone (Figure 1) and the cryogen container. The other end of the plunger is mounted on a stepper motor whose rotating velocity is controlled by computer. For detailed information on the plunging machine, the reader is referred to (White et al., 2003). As cryogen liquid alkane was used, a nitrogen-cooled ethane/propane mixture (at 37%/63% ratio)(Tivol et al., 2008). This mixture is superior for producing vitreous ice since its freezing point is lower than that of either ethane or propane alone(Tivol et al., 2008). The averaged plunging speed (set at 2.0 m/s) can be controlled by the computer-assisted liquid-pumping and grid-plunging device. The distance from the sprayer nozzle to the surface of the liquid alkane can be adjusted down to a minimum value 5 mm so that the minimum plunging time is 2.5 ms (Figure S1). The whole microsprayer chip is enclosed within an environmental chamber(Chen et al., 2015) where the ambient conditions can be maintained at 24 ~ 26°C and 80% ~ 90% relative humidity.
The performance of the new chip in generating microdroplets was evaluated by spraying PBS buffer solution onto cryo-EM grids. Specifically, Quantifoil R1.2/1.3 EM grids (Quantifoil, Großlöbichau, Germany) were glow-discharged within 30 minutes before usage, employing a Gatan Solarus 950 (Gatan, Pleasanton, CA) with H2 at a flow rate of 6.4 standard cubic centimeters per minute (sccm) and O2 at a flow rate of 27.5 sccm at 25 W for 25 s. PBS buffer was injected into the microsprayer chip at a flow rate of 6 μL/s, which was kept constant for all the experiments. The pressures at the gas tank were controlled in the range of 16 ~ 48 psi (see STAR Methods for details). Compressed nitrogen gas was humidified by passing it through two consecutive water tanks.
In the spraying-plunging experiment, four different gas pressures (16, 24, 33 and 48 psi) were used to test the effectiveness of atomization (see Supplemental movies). In addition, two different distances (5 and 10 mm) of the microsprayer nozzle from the cryo-EM grid were tried since both gas pressure(Berriman and Unwin, 1994; Lu et al., 2009) and the distance between the sprayer orifice and grid(Berriman and Unwin, 1994) were found to be important in determining the size and distribution of the droplets. However, we find that the choice of those parameters affects not only the sprayed droplet size and distribution, but also the thickness of droplets caught on the EM-grid. Since ice thickness is of paramount importance in determining the quality of the image, our work was mainly focused on the optimization of ice thickness based on an analysis of the droplets on the grid under different spraying conditions.
Characterization of the performance of the sprayer
We characterized the performance of the sprayer on a given grid in terms of the following quantities: (i) proportion of broken vs. unbroken squares, (ii) ice thickness in unbroken squares, and (iii) total number of holes on the grid suitable for particle collection. Most importantly, we focused on measuring and optimizing the ice thickness distribution under a series of different spraying conditions.
There are several studies(Eusemann et al., 1982; Feja and Aebi, 1999; Malis et al., 1988; Stagg et al., 2006; Zeitler and Bahr, 1962) reporting on the thickness of vitreous ice layer formed by the blotting-plunging method, while investigations of ice thickness produced by the spraying-plunging method have been scarce. As a direct way to quantify ice layer depth, following the method pioneered by Angert(Angert et al., 1996), the lengths of tunnels burnt into the ice layer with a condensed EM beam were measured. In these experiments, the grid is first tilted to −30° and ~40 nm-diameter tunnels are drilled with the beam. Then the grid is tilted to +30° and the projections of the tunnels are imaged. With this geometry, the depth of the ice is directly measurable by the tunnel length(Feja and Aebi, 1999; Wright et al., 2006) (Figure 2).
Figure 2.
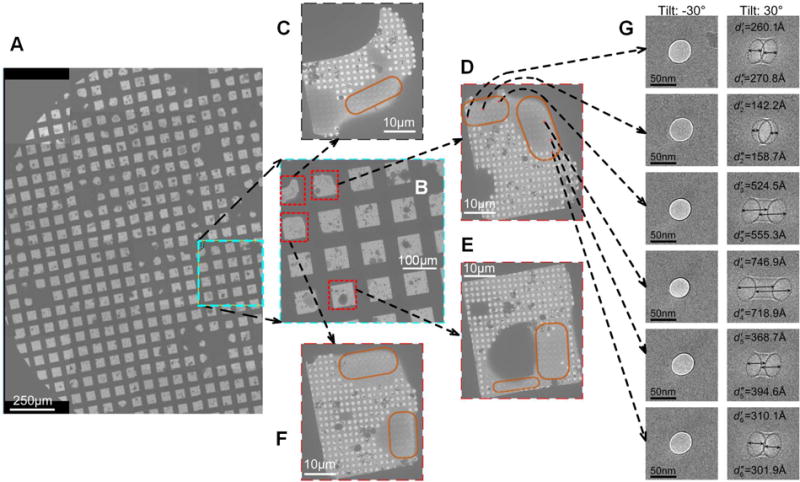
Measurements of ice thickness of droplets sprayed on the EM-grid with the following settings: liquid flow rate 6 μL/s, gas pressure 16 psi and sprayer-grid distance 5 mm. (A) Half of a grid showing the droplet distribution and the droplet size. (B) Area marked cyan in (A), at 120× magnification, was used to find a set of squares (red boxes) with particle-collectible droplets for further imaging. (C), (D), (E) and (F) Four squares targeted in (B) were imaged at 550×. Droplets with vitreous ice (marked with orange) allowing collection of particles are visible in these squares. (D) Positions of holes covered with ice were randomly chosen for drilling tunnels (red crosses). (G) A series of tunnels were drilled into the ice at the tilt angle of −30°. Then the grid was tilted to +30°, and images of projections of the tunnels were acquired. See also Figure S2.
We found an interesting phenomenon as we inspected the micrograph: the distribution of ice on most of the holes displays a special pattern that differs from grids conventionally prepared (see Figure 3A, B and Figure S3): the ice tends to be thinner on the leading side and thicker on the trailing side (referring to the direction of plunging), whereas in case of the blotting-plunging method, the ice is thinner in the center and uniformly thicker in the periphery(Stagg et al., 2006). In some cases, the variation of ice thickness within one hole is as large as 200 Å.
Figure 3.
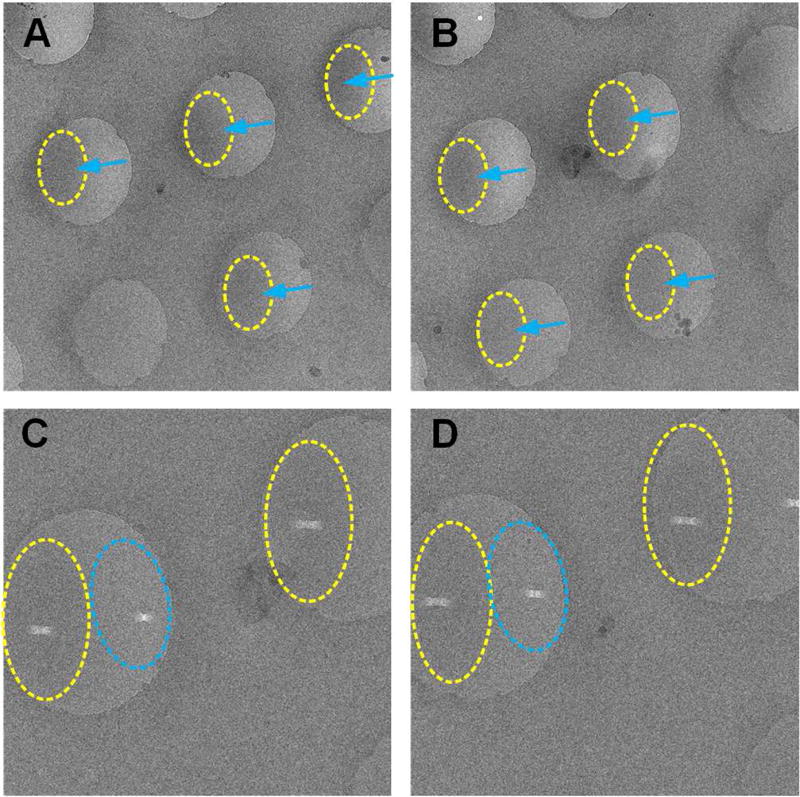
The ice distribution in the holes. (A) and (B) The ice thickness is different from the leading to the trailing side of each hole (blue arrows), which is different from grids obtained by the blotting method. (C) and (D) The ice is thinner on one side than the other side as indicated by the different lengths of the tunnels drilled on the two sides. The thicker ice region on each hole is marked in yellow, the thinner ones in blue. See also Figure S3.
In our measurements we drilled one tunnel for each hole, and chose the thinnest region in each case. In this way, more than a hundred tunnels were drilled for each of a variety of different spraying conditions. We conducted two measurements, and , on each tunnel (Figure 2G) and the mean value was considered the thickness.
Table 1 shows how the choice of gas/liquid mass flow rate ratio (G/L ratio) and other parameters affected the number of broken squares, the number of collectible holes, and ice thickness. From this table, it can be seen that the percentage of broken squares on each grid increased from less than 2% to nearly 50% when the G/L ratio went up from 1.02 to 7.15. It is obvious that when the liquid flow rate is kept constant, at 6 μL/s, the droplets sprayed under increased gas pressure come to hold higher momentum, which will inflict more damage to the grid. Although this puts a limit on the total area usable for data collection, the number of suitable holes we achieve is still sizeable, in the range of 2000 per grid. The mean thickness of the vitreous ice on the particle-collectable holes shows a rising trend over a gas pressure range from 16 to 48 psi. In particular, when the gas pressure is set at 16 psi, the mean ice thickness is 480 Å.
Table 1.
Effect of G/L ratio on number of broken squares, number of collectible holes, ice thickness and droplet size with a grid-sprayer distance of 5 mm
| G/L ratio | 1.02 | 2.04 | 4.22 | 7.15 |
| Gas pressure (psi) | 16 | 24 | 33 | 48 |
| Percentage of broken squares | 9/506=1.8% | 41/498=8.2% | 178/479=37.2% | 209/429=48.7% |
| Fraction of Droplets with diameter in 2.5~30μm | 54% | 43% | 36% | 28% |
| Collectable holes | 2747 | 2113 | 3015 | 3447 |
| Measured holes | 128 | 115 | 117 | 127 |
| Mean thickness (Å) | 480.4±231.3 | 616.2±238.3 | 667.8±316.3 | 730.0±350.8 |
We also compared the ice thickness distributions for different sprayer-grid distances (5 mm and 10 mm) in the range of gas pressures from 24 psi to 48 psi (Figure S4). A two-tailed paired t-test was performed to test statistical significance, with a significance level of 0.001, *P<0.001. P values were found to be all less than this level. Hence, we conclude that the ice layer tends to become thinner as the distance of the grid to the sprayer nozzle is decreased from 10 to 5 mm. With the sprayer-grid distance kept at 5 mm, we also conducted the t-test to evaluate the effect of different gas pressures, with the significance level set to 0.05, **P<0.05. The ice thickness for gas pressure of 33 psi showed no significant difference from those for 24 psi and 48 psi.
In addition, we observed that the size and distribution of the droplets on the grid change when the G/L ratio is increased (Table 1 and Figure S2). The fraction of droplets with diameter from 2.5 μm to 30μm decreases from 54% to 28%. The droplets on the grids became smaller as the G/L ratio was increased. The area each droplet covers varies from ~200 holes to ~40 holes when the G/L ratio was increased from 1.02 to 7.15 (Figure S5). The number of droplets distributed on the grid increased with increased gas pressure, from about one per square to about six per square.
A high-resolution apoferritin structure determined to test the spraying-plunging method
By using the microspraying-plunging method, we deposited apoferritin solution on the EM grid with the following settings: sprayer-grid distance 5 mm, gas pressure of 16 psi and liquid flow rate of 6 μL/s. Within one cryo-EM grid, the squares of thinnest ice based on the contrast were targeted. Within each square, we usually aimed at holes with the thinnest ice, which usually displayed the strongest brightness (Figure 2C, D, E and F). In our experience, the ice within holes close to the center of the droplet is too thick for imaging. But we also needed to avoid imaging in regions of crystalline ice, recognizable by its unusual brightness. All exposures in our experiment were taken in the thinner regions of the ice (Figure 3 and Figure S3). In our study, about 140 squares were selected and 1204 images were collected on the thinner side of each hole in one session (Figure 4A).
Figure 4.
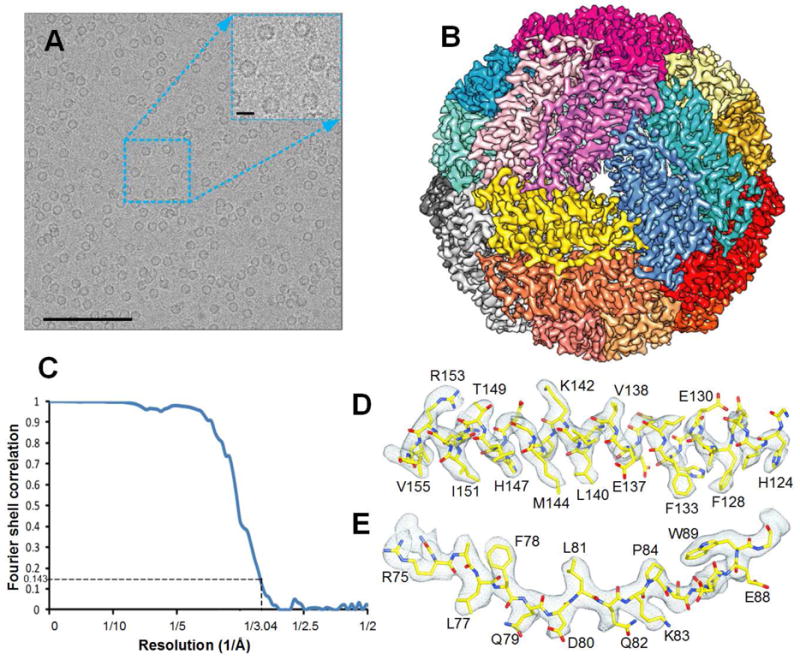
(A) High-quality electron micrograph of apoferritin from equine spleen (SIGMA A3641. 7 mg/ml in PBS buffer, 0.2 μm filtered) sprayed onto cryo-EM holy carbon grid and collected using the FEI Polara microscope with a Gatan K2 Summit direct electron detection camera. Scale bars for the micrograph and magnified region are 1000 and 100 Å, respectively. (B) Cryo-EM structure of apoferritin at 3.0 Å resolution with each subunit color-coded. (C) The FSC curve for the final cryo-EM 3D reconstruction, generated with Relion 1.4. (D) and (E) Representative cryo-EM densities (grey mesh), superimposed on our atomic model (main chain in yellow) for different apoferritin domains. See also Figure S6.
For image processing, particles were picked from 195 micrographs that were kept after screening for quality (see STAR Methods for details). After 2D and 3D classification, 4,590 particles were subjected to auto-refinement in RELION(Scheres, 2012) (Figure S6). The final map application of symmetry had a resolution of 3.0 angstrom (“gold-standard” protocol; FSC0.143) (Figure 4C). The density map shows the round overall shape of the apoferritin structure, as visualized before(Précigoux et al., 1994; Russo and Passmore, 2014), with α-helical regions being clearly visible (Figure 4B and Figure 5) and a short β-strand recognizable on the dimer interface (Figure 4D). The high-resolution map allowed us to confidently register most amino acid residues, guided by their characteristic signatures (Figure 4D, E), going by clues such as the size of rings from three aromatic amino acids and long side chains for base amino acids.
Figure 5.
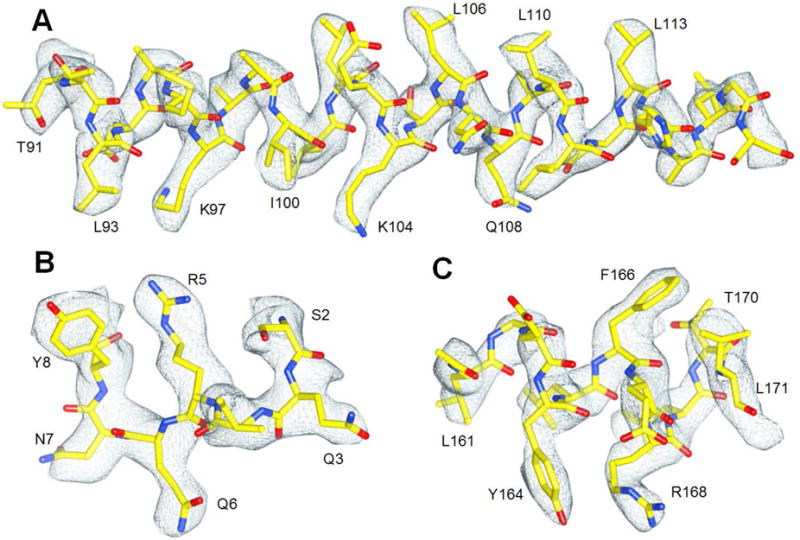
Three α-helical segments from one subunit. (A) The cryo-EM density of long α-helical segment is shown in blue mesh. The model was docked with rigid-body fitting using Chimera first, then manually optimized by fitting in Coot. (B) Short α-helical segment near the N-terminus. Long-base amino acid arginine is well preserved (R5). (C) The additional density accounting for the hydroxyl group of the tyrosine side chain (Y164) is clearly seen compared to the side chain for phenylalanine (F166). See also Figure S6.
Discussion
Here we have presented a newly designed microsprayer for depositing sample droplets on the EM grid, as an alternative to the conventional pipetting/blotting method of cryo-EM. We have established that ice thickness of the droplets can be controlled in a wide range (from 500 to 750 Å) by adjusting gas pressure and sprayer-grid distance. Furthermore, we have demonstrated the suitability of the microsprayer for high-resolution structure determination by solving the structure of apoferritin by single-particle cryo-EM to 3.0 Å resolution.
The phenomenon that the ice is thicker on the trailing side than the leading side of the hole, with reference to the plunging direction, has not been observed previously(Chen et al., 2015; Lu et al., 2014; Lu et al., 2009). In some cases, the difference in ice thickness within one hole is as large as 200 Å. This phenomenon can be explained as an effect of inertia. As the droplets emerging from the microsprayer impinge on the EM-grid, which moves downward at a linear velocity of 2 m/s, the water in the droplets as they are being accelerated tends to slide and bulge on the surface of the EM-grid in the direction opposite to the movement of the grid (Figure 3 and Figure S3). Therefore, when the droplets are vitrified, the ice will be thinner on the leading side of the hole than on the trailing side. Potentially, an increase in plunging velocity (>2 m/s) could be used to amplify this effect to produce a larger region of thinner ice.
For a given plunging velocity, the large droplets generated at lower G/L ratios can more readily move on the grid due to inertia effect, thereby resulting in thinner ice on the grid. This gives a possible explanation for thinner ice being obtained at the lower gas pressures (Table 1 and Figure S5). We expect that optimization of the device geometry (e.g., that of the mixing chamber) could allow the use of even lower pressures, thereby allowing the G/L ratio to be further decreased to obtain even thinner ice.
To obtain thinner ice, suitable for studying small molecules, additional measures can be taken. One is to use self-blotting grids (nanowire grids(Razinkov et al., 2016)), which greatly enhance the hydrophilicity of the grid surface and allow the droplet to spread more easily on the grid during spraying. Another is to use buffer solutions with lower surface tension, which determines the spread of the droplet on the surface of the grid.
Although the spraying-plunging method shows considerable advantages in specimen preparation, there is one important limitation. Compared with other deposition methods, e.g., Spotiton(Jain et al., 2012) or the conventional pipetting/blotting-plunging method(Dobro et al., 2010), ten times or more sample consumption are currently required for each burst of spray, which tends to overburden the upstream biochemistry, especially when the biological specimen is difficult to purify. In the current experimental setup, the spray plume is stabilized after one second as shown in Supplemental Movie, corresponding to a minimum sample consumption of 9 μL/grid. Possible solutions to tackle this problem are that multiple grids can be arranged on the forceps for each plunge and the time for stabilization of the spray can be shortened by changing the geometry of the sprayer.
In addition to offering an alternative to pipetting/blotting, the microsprayer can also be used in time-resolved imaging to trap short-lived states (in the 10–1000 ms range) of biological molecules(Chen and Frank, 2015; Chen et al., 2015; Fu et al., 2016). Recently developed time-resolved cryo-EM methods using the mixing-spraying method(Lu et al., 2009; Shaikh et al., 2014) are still limited in resolution as a consequence of low data yield compared to conventional cryo-EM using conventional pipetting/blotting. Our PDMS-based microsprayer can be readily integrated with other microfluidic components for time-resolved cryo-EM sample preparation, but this requires re-design of currently silicon-based chips(Lu et al., 2014; Lu et al., 2009) on a PDMS-based platform. In the future, the new microsprayer will be used as an integral component of a time-resolved microfluidic chip entirely based on PDMS. Overall, the redesigned time-resolved chip follows the design of the silicon-based chips developed by Lu and coworkers (Lu et al., 2009, 2014). It contains two inlets for reactants which are rapidly mixed in a micromixer (Feng et al., 2014), and then allowed to react in a reaction channel for a controlled period of time. The reaction product is sprayed onto the grid by means of the newly developed microsprayer.
STAR methods
Contact for reagent and resource sharing
Further information and requests for reagents should be directed to and will be fulfilled by the Lead Contact, Joachim Frank (jf2192@cumc.columbia.edu).
Method details
Fabrication of the microsprayer chip
The microsprayer chip is composed of a two-layer PDMS and two tubings (one used as liquid injector and the other as the gas nozzle). This type of device was fabricated in main part by using multilayer soft lithography(Xia and Whitesides, 1998). In brief, we cured Sylgard 184 (Dow Corning) mixed at 10:1 ratio (base: cure agent) on a 180-μm-thick patterned SU-8 2075 photoresist (MicroChem) to obtain a bottom PDMS layer with channel for liquid and an upper PDMS layer with channel for gas. The width for both channels is 400 μm. The bottom-layer PDMS was punched to gain both inlet and outlet for liquid and then bonded on a glass slide after plasma treatment. A polyimide-coated, fused silica capillary tubing (Polymicro Technologies TSP075375) was used as liquid injector with the Inner Diameter (I.D.) of 75 ± 3 μm, the Outer Diameter (O.D.) of 363 ± 10 μm and 6 mm length. The liquid tubing was inserted into the outlet of the bottom PDMS layer and then glued. The upper-layer PDMS was also punched to give two inlets (one for gas and one to be connected to the inlet of the bottom PDMS layer) and an outlet for gas. After treating the surfaces with oxygen plasma, we applied a drop of distilled water for lubrication, aligned the two PDMS layers and baked the matching PDMS bulk at 60°C for 3 h to bond them firmly. A pipette tip, cut to obtain a gas nozzle with I.D. 360 μm and O.D. 690 μm was fitted to the gas outlet. We adjusted the gas nozzle under a light microscope to keep the distance between the ends of the two tubings at 500 μm, and then glued the gas nozzle to the top PDMS layer. This fabrication process is simple and cost-effective.
Detailed experimental processes
The apparatus for preparation of sprayed cryo-grids is shown in Figure 1 and Figure S1. The computer-operated liquid-pumping and grid-plunging device(White et al., 2003) was developed by Howard White (Eastern Virginia Medical School). The environmental chamber(Chen et al., 2015), which monitors and maintains both temperature and humidity was redesigned to accommodate the different mounting geometry of the PDMS microsprayer. The chip holder slides in a guide groove, which is fastened to the bottom of the environmental chamber. Both the chip and the chip holder can be moved for adjustment of the microsprayer nozzle’s position in vertical and horizontal directions. The EM grid is clamped by the tweezers mounted on a mechanical rotating arm (the plunger), and the angle between the tweezers and the plunger can be adjusted. The plunging movement is driven by a stepper motor under computer control(White et al., 2003; White et al., 1998).
Prior to each spraying test, we adjust the tweezers such that the grid held on their tip travels along an arc starting from a height of a few centimeters above the nozzle, passing the nozzle, to the point where it plunges into the cryogen.
In all experiments, the condition inside the chamber was maintained at 80%~90% in relative humidity by a humidifier connected to the chamber, and kept at a temperature in the range of 24°C to 26°C. Compressed nitrogen gas, humidified by passing through two consecutive water tanks, was fed into the microsprayer at a manually-controlled gas pressure. Its flow rate was measured by a gas mass flowmeter (Omega Engineering, Inc.). Once the gas flow was stable, the liquid was injected into the microsprayer chip by a syringe pump under computer control and the liquid flow rate was set at 6 μL/s. At this point the sprayer started atomizing. Finally, the EM grid was passed through the spray cone and plunged into liquid alkane(Tivol et al., 2008). In detail, the steps of the experiments were as follows:
Fix the sprayer chip into the chip holder.
Mount the chip holder into the guide groove.
Connect the sprayer chip with the syringe pump with the tubing for feeding specimen solution.
Connect the sprayer chip with the nitrogen gas tank with the tubing for feeding gas.
Load solution into the syringe pump.
Plasma clean the EM-grid.
Hold the EM-grid by the tweezers.
Mount the tweezers on the plunger.
Align the EM-grid with the sprayer nozzle and adjust the distance in horizontal direction from the nozzle to the EM-grid.
Turn on the humidifier.
Turn on the nitrogen gas.
Move the liquid alkane container into correct position below the sprayer nozzle.
Wait for the humidity and the nitrogen gas flow are stable.
Turn on the syringe pump and activate the microsprayer to spray. After for stabilization of the spray plume, the plunger motor is activated by the computer(White et al., 2003), causing the EM grid to pass through the spray plume as shown in Figure 1b, and finally, immerse into the liquid alkane for vitrification. (Note that in our experiments we waited 3.5 s to allow stabilization of the plume, but we found out in a subsequent study (Supplemental Movies) that stabilization occurred within one second.)
Turn off the nitrogen gas.
Disassemble the tweezers from the plunger and move the EM-grid to a storage box in liquid nitrogen.
Both prior and subsequent to the spraying-plunging experiments, the microsprayer was pumped in deionized water for cleaning. Buffer solution was always pre-sprayed to ensure the sprayer chip is in good working state. Particularly, each sprayer chip was used for one kind of specimen only to avoid cross contamination.
Rationale for choosing an internal-mixing round-jet airblast microsprayer
We chose an internal-mixing design because of its efficiency in utilization of gas power. In external-mixing atomizers, the gas interacts with the liquid outside the external-mixing atomizer, which leads to rather inefficient gas utilization and requirement of relatively high pressures. In contrast, internal mixing generates finer atomization at higher relative velocities between nitrogen gas and the liquid, thereby allowing more efficient use of gas at considerably lower pressures.
We chose a round-jet atomizer design because round jets can more easily break up to generate fine droplets. In round-jet airblast atomizers, high relative velocities are achieved by injecting the liquid into a high-velocity gas stream, and the cylindrical liquid jet breaks up more thoroughly, resulting in finer droplets when compared to flat-sheet sprayers. This advantage is closely related to the unbroken length of a jet, which, defined as the length over which the jet remains connected to the exit plane of the liquid injector nozzle, is given by(Eroglu et al., 1991; Lasheras and Hopfinger, 2000; Lin and Reitz, 1998) . Here, D is the hydraulic diameter of the injector, ρg the gas density, Vr the liquid-gas relative velocity, σ the surface tension, and ρl, ul and μl respectively the liquid’s density, velocity, and kinetic viscosity. It has been shown by Eroglu, et al.(Eroglu et al., 1991) that under the same flow conditions, the unbroken length of a round jet is significantly smaller than that of a flat-sheet jet of the same hydraulic diameter. As the unbroken length is a measure of a jet’s resistance to breakup, by allowing a shorter unbroken length, a round jet can more easily break up to produce finer droplets.
Rationale for the choice of gas pressures
For sprayers used in conventional fields, such as industrial turbines, the rule is that finer droplets are desirable for producing higher heat-transfer and vaporization rates. However, the requirement is different for a microsprayer applied in the sample preparation of cryo-EM, as the quality of the prepared cryo-grids is determined not by the droplet size but ultimately by ice thickness, with the thinnest ice as a goal. As can be seen from Table 1 and Figure S2, when the gas pressure increases, the droplets tend to become smaller but the ice becomes thicker. Hence the key to controlling ice thickness is the adjustment of gas pressure in a certain critical range, the lower and upper boundaries of which were estimated on the following grounds.
We introduce the Sauter mean diameter (SMD), as the average of the droplet size. The following empirical expression(Lefebvre, 1980; Lorenzetto and Lefebvre, 1977) is used to estimate SMD:
| (1) |
where is the mass flow rate, and subscripts g and l denote gas and liquid. Suppose that the solution sprayed is water, the viscosity μ surface tension σ, density ρ are 0.89×10⁻³ Pa·s, 0.072 N/m, 1×10³ kg/m3, respectively. For a flow rate of the liquid of 6 μL/s, the mass flow rate of liquid is 0.0216 kg/h and the liquid velocity at the liquid injection nozzle is 1.34 m/s. The diameter of liquid injection orifice D is 75 μm. In our experiment, when we used gas pressures below 16 psi, the solution as it came out of the nozzle tended to drip down from it, rather than being sprayed out. Therefore, we chose 16 psi as the lower boundary. When we increase the gas pressure from 16 psi to 48 psi, the volumetric flow rate measured changes from 0.3 to 0.7 L/min. Hence, we see that as the mass flow rate of the gas ranges from 0.022 to 0.155 kg/h, the gas velocity increases from 49.1 to 114.6 m/s and the gas density increases from 1.23 to 3.68 kg/m3 (at a temperature of 299°K). From these ranges, we can calculate SMD to be in the range of 36.2 to 4.4 μm. If the gas pressure is higher than 48 psi, the SMD will be too small, and every vitreous ice blob tends to cover few holes and become too thick according to our ice thickness analysis. This led us to use the 16–48 psi pressure range in our Cryo-EM sample preparation experiments.
Data collection and single-particle data analysis
We recorded images from Tecnai Polara F30 (FEI, Hillsboro, Oregon) with the Gatan K2 Summit direct electron detector (Gatan, Pleasanton, CA) in super-resolution mode at a magnification of 39,000×, corresponding to a physical pixel size of 0.981 Å (or super-resolution pixel size of 0.4905 Å) (Figure 4a). The beam intensity was set to 8 e−/pixel/s. Images were recorded as stacks of 25 frames, with a total exposure time of 5 s. All data collection was done with the aid of Leginon 3.1 (Potter et al., 1999; Suloway et al., 2009). In the first step, we scanned each hole and selected potentially good areas for exposure (thinnest ice, not crystalline). Before data collection, a full alignment of the microscope was carefully done (astigmatism and coma were minimized, etc.). The defocus range was set to 1–2 μm. For setting defocus, z stage movement was employed rather adjustment of the objective lens. In order to arrive at the exposure location interactive stage movement was used rather than image shift. Before each exposure, a period of 40 s was waited to let the stage stabilize.
The unbinned frame stacks were aligned using the program motioncorr_v.2.1(Li et al., 2013) with a rolling average of 3 frames. Both averaged sum and corrected raw stacks were saved for further data processing. 195 micrographs were obtained by manual screening based on the quality of micrographs, defocus and numbers of particles. CTF estimation was done with CTFFIND 4.0.1(Rohou and Grigorieff, 2015). The resulting defocus ranged from 0.5 to 3.0 μm. Particles selection was performed using RELION 1.4(Scheres, 2012). Approximately 2000 good particles were picked first and a reference was generated from these by 2D classification. Automatic particle picking was followed by manual deletion of falsely picked aggregates or ice contamination. The particles number was reduced to 30,315 by choosing the classes with high-resolution features after two rounds of 2D classification with six-fold binned particles. Then all these particles were re-extracted with binning of 2 and put into auto-refinement. Particle polishing was applied, and a new round auto-refinement was carried out. Local 3D classification provided a single class with high-resolution features. Another round of auto-refinement and post-processing were carried out on this class (Figure 4b, c). The detailed data processing procedure can be found in Figure S6. As a result, and without any further correction, a 3.0 Å-resolution structure was obtained (Figure 4b).
Model Building
The apoferritin crystal structure (PDB 4v1w) was fitted into the cryo-EM map using UCSF Chimera(Goddard et al., 2007) and then refined in Coot(Emsley et al., 2010). The model was visually inspected in Coot and a few amino acid side chain rotamers were manually adjusted to improve the fit with the density (Figure 4d, e and Figure 5).
Quantification and statistical analysis
Ice thickness under different spraying conditions
To distinguish the ice thickness distributions for different sprayer-grid distances (5 mm and 10 mm) in the range of gas pressures from 24 psi to 48 psi (Figure S4), a two-tailed paired t-test was performed to test statistical significance, with a significance level of 0.001, *P<0.001. when we keep the sprayer-grid distance at 5 mm, the t-test was also conducted to evaluate the effect of different gas pressures, with the significance level set to 0.05, **P<0.05.
Data and software availability
All software used are reported in Method Details and indicated in the Key Resources Table. The accession number for the EM map of apoferritin reported in this paper is EMD: 8428.
Supplementary Material
Highlights.
Sample deposition by microspraying has advantages over the blotting method Thickness of vitreous ice is consistent and can be controlled by gas pressure A 3.0 Å structure was determined from cryo-EM grids sprayed with apoferritin One of many potential applications of the new sprayer is in time-resolved cryo-EM
Acknowledgments
This work was supported by the HHMI and NIH R01 GM55440 (to J.F.). Xiangsong Feng greatly acknowledges the financial support from China Scholarship Council (No. 201406120114).
Footnotes
Publisher's Disclaimer: This is a PDF file of an unedited manuscript that has been accepted for publication. As a service to our customers we are providing this early version of the manuscript. The manuscript will undergo copyediting, typesetting, and review of the resulting proof before it is published in its final citable form. Please note that during the production process errors may be discovered which could affect the content, and all legal disclaimers that apply to the journal pertain.
ACCESSION NUMBERS
The accession numbers for the structure reported in this paper is EMData Bank: map of apoferritin, EMD-8428.
SUPPLEMETAL INFORMATION
Supplemental Information includes six figures and four movies.
AUTHOR CONTRIBUTIONS
X.F., Z.F., S.K., B.C., Y.J., and Y.R. designed experiments. B.C., R.A.G., and M.S. assisted in experimental design. X.F., Z.F., S.K., Z.L., B.S., and A.J. performed experiments and analyzed data. H.J, J.F., and Q.L. supervised the study. X.F., Z.F., J.F., and Q.L. wrote the manuscript. X.F. and Z.F. contributed equally to the study. All authors discussed the results and commented on the manuscript.
Competing financial interests
The authors declare no competing financial interests.
References
- Adrian M, Dubochet J, Lepault J, McDowall AW. Cryo-electron microscopy of viruses. Nature. 1984;308:32–36. doi: 10.1038/308032a0. [DOI] [PubMed] [Google Scholar]
- Angert I, Burmester C, Dinges C, Rose H, Schröder RR. Elastic and inelastic scattering cross-sections of amorphous layers of carbon and vitrified ice. Ultramicroscopy. 1996;63:181–192. [Google Scholar]
- Bartesaghi A, Merk A, Banerjee S, Matthies D, Wu X, Milne JL, Subramaniam S. 2.2 Å resolution cryo-EM structure of β-galactosidase in complex with a cell-permeant inhibitor. Science. 2015;348:1147–1151. doi: 10.1126/science.aab1576. [DOI] [PMC free article] [PubMed] [Google Scholar]
- Berriman J, Unwin N. Analysis of transient structures by cryo-microscopy combined with rapid mixing of spray droplets. Ultramicroscopy. 1994;56:241–252. doi: 10.1016/0304-3991(94)90012-4. [DOI] [PubMed] [Google Scholar]
- Campbell MG, Veesler D, Cheng A, Potter CS, Carragher B. 2.8 Å resolution reconstruction of the Thermoplasma acidophilum 20S proteasome using cryo–electron microscopy. Elife. 2015;4:e06380. doi: 10.7554/eLife.06380. [DOI] [PMC free article] [PubMed] [Google Scholar]
- Chen B, Frank J. Two promising future developments of cryo-EM: capturing short-lived states and mapping a continuum of states of a macromolecule. Microscopy. 2015:dfv344. doi: 10.1093/jmicro/dfv344. [DOI] [PMC free article] [PubMed] [Google Scholar]
- Chen B, Kaledhonkar S, Sun M, Shen B, Lu Z, Barnard D, Lu TM, Gonzalez RL, Frank J. Structural dynamics of ribosome subunit association studied by mixing-spraying time-resolved cryogenic electron microscopy. Structure. 2015;23:1097–1105. doi: 10.1016/j.str.2015.04.007. [DOI] [PMC free article] [PubMed] [Google Scholar]
- Dobro MJ, Melanson LA, Jensen GJ, McDowall AW. Chapter Three-Plunge Freezing for Electron Cryomicroscopy. Methods in enzymology. 2010;481:63–82. doi: 10.1016/S0076-6879(10)81003-1. [DOI] [PubMed] [Google Scholar]
- Du J, Lü W, Wu S, Cheng Y, Gouaux E. Glycine receptor mechanism elucidated by electron cryo-microscopy. Nature. 2015 doi: 10.1038/nature14853. [DOI] [PMC free article] [PubMed] [Google Scholar]
- Emsley P, Lohkamp B, Scott WG, Cowtan K. Features and development of Coot. Acta Crystallographica Section D: Biological Crystallography. 2010;66:486–501. doi: 10.1107/S0907444910007493. [DOI] [PMC free article] [PubMed] [Google Scholar]
- Eroglu H, Chigier N, Farago Z. Coaxial atomizer liquid intact lengths. Physics of Fluids A: Fluid Dynamics (1989–1993) 1991;3:303–308. [Google Scholar]
- Eusemann R, Rose H, Dubochet J. Electron scattering in ice and organic materials. Journal of Microscopy. 1982;128:239–249. [Google Scholar]
- Feja B, Aebi U. Determination of the inelastic mean free path of electrons in vitrified ice layers for on-line thickness measurements by zero-loss imaging. Journal of microscopy. 1999;193:15–19. doi: 10.1046/j.1365-2818.1999.00436.x. [DOI] [PubMed] [Google Scholar]
- Frank J. Three-dimensional electron microscopy of macromolecular assemblies: visualization of biological molecules in their native state. Oxford University Press; 2006. [Google Scholar]
- Fu Z, Kaledhonkar S, Borg A, Sun M, Chen B, Grassucci Robert A, Ehrenberg M, Frank J. Key Intermediates in Ribosome Recycling Visualized by Time-Resolved Cryoelectron Microscopy. Structure. 2016;24:2092–2101. doi: 10.1016/j.str.2016.09.014. [DOI] [PMC free article] [PubMed] [Google Scholar]
- Goddard TD, Huang CC, Ferrin TE. Visualizing density maps with UCSF Chimera. Journal of structural biology. 2007;157:281–287. doi: 10.1016/j.jsb.2006.06.010. [DOI] [PubMed] [Google Scholar]
- Grant T, Grigorieff N. Measuring the optimal exposure for single particle cryo-EM using a 2.6 Å reconstruction of rotavirus VP6. Elife. 2015;4:e06980. doi: 10.7554/eLife.06980. [DOI] [PMC free article] [PubMed] [Google Scholar]
- Guo F, Liu Z, Fang PA, Zhang Q, Wright ET, Wu W, Zhang C, Vago F, Ren Y, Jakana J. Capsid expansion mechanism of bacteriophage T7 revealed by multistate atomic models derived from cryo-EM reconstructions. Proceedings of the National Academy of Sciences. 2014;111:E4606–E4614. doi: 10.1073/pnas.1407020111. [DOI] [PMC free article] [PubMed] [Google Scholar]
- Jain T, Sheehan P, Crum J, Carragher B, Potter CS. Spotiton: a prototype for an integrated inkjet dispense and vitrification system for cryo-TEM. Journal of structural biology. 2012;179:68–75. doi: 10.1016/j.jsb.2012.04.020. [DOI] [PMC free article] [PubMed] [Google Scholar]
- Lasheras J, Hopfinger E. Liquid jet instability and atomization in a coaxial gas stream. Annual Review of Fluid Mechanics. 2000;32:275–308. [Google Scholar]
- Lefebvre AH. Airblast atomization. Progress in Energy and Combustion Science. 1980;6:233–261. [Google Scholar]
- Li W, Liu Z, Koripella RK, Langlois R, Sanyal S, Frank J. Activation of GTP hydrolysis in mRNA-tRNA translocation by elongation factor G. Science advances. 2015;1:e1500169. doi: 10.1126/sciadv.1500169. [DOI] [PMC free article] [PubMed] [Google Scholar]
- Li X, Mooney P, Zheng S, Booth CR, Braunfeld MB, Gubbens S, Agard DA, Cheng Y. Electron counting and beam-induced motion correction enable near-atomic-resolution single-particle cryo-EM. Nat Meth. 2013;10:584–590. doi: 10.1038/nmeth.2472. [DOI] [PMC free article] [PubMed] [Google Scholar]
- Lin S, Reitz R. Drop and spray formation from a liquid jet. Annual Review of Fluid Mechanics. 1998;30:85–105. [Google Scholar]
- Liu Z, Guo F, Wang F, Li TC, Jiang W. 2.9 A Resolution Cryo-EM 3D Reconstruction of Close-Packed Virus Particles. Structure. 2016a;24:319–328. doi: 10.1016/j.str.2015.12.006. [DOI] [PMC free article] [PubMed] [Google Scholar]
- Liu Z, Gutierrez-Vargas C, Wei J, Grassucci RA, Ramesh M, Espina N, Sun M, Tutuncuoglu B, Madison-Antenucci S, Woolford JL, Jr, et al. Structure and assembly model for the Trypanosoma cruzi 60S ribosomal subunit. Proc Natl Acad Sci U S A. 2016b;113:12174–12179. doi: 10.1073/pnas.1614594113. [DOI] [PMC free article] [PubMed] [Google Scholar]
- Lorenzetto G, Lefebvre A. Measurements of drop size on a plain-jet airblast atomizer. AIAA Journal. 1977;15:1006–1010. [Google Scholar]
- Lu Z, Barnard D, Shaikh TR, Meng X, Mannella CA, Yassin AS, Agrawal RK, Wagenknecht T, Lu TM. Gas-assisted annular microsprayer for sample preparation for time-resolved cryo-electron microscopy. Journal of Micromechanics and Microengineering. 2014;24:115001. doi: 10.1088/0960-1317/24/11/115001. [DOI] [PMC free article] [PubMed] [Google Scholar]
- Lu Z, Shaikh TR, Barnard D, Meng X, Mohamed H, Yassin A, Mannella CA, Agrawal RK, Lu TM, Wagenknecht T. Monolithic microfluidic mixing–spraying devices for time-resolved cryo-electron microscopy. Journal of structural biology. 2009;168:388–395. doi: 10.1016/j.jsb.2009.08.004. [DOI] [PMC free article] [PubMed] [Google Scholar]
- Malis T, Cheng S, Egerton R. EELS log-ratio technique for specimen-thickness measurement in the TEM. Journal of electron microscopy technique. 1988;8:193–200. doi: 10.1002/jemt.1060080206. [DOI] [PubMed] [Google Scholar]
- Merk A, Bartesaghi A, Banerjee S, Falconieri V, Rao P, Davis MI, Pragani R, Boxer MB, Earl LA, Milne JL. Breaking Cryo-EM Resolution Barriers to Facilitate Drug Discovery. Cell. 2016 doi: 10.1016/j.cell.2016.05.040. [DOI] [PMC free article] [PubMed] [Google Scholar]
- Penczek P, Radermacher M, Frank J. Three-dimensional reconstruction of single particles embedded in ice. Ultramicroscopy. 1992;40:33–53. [PubMed] [Google Scholar]
- Potter CS, Chu H, Frey B, Green C, Kisseberth N, Madden TJ, Miller KL, Nahrstedt K, Pulokas J, Reilein A, et al. Leginon: a system for fully automated acquisition of 1000 electron micrographs a day. Ultramicroscopy. 1999;77:153–161. doi: 10.1016/s0304-3991(99)00043-1. [DOI] [PubMed] [Google Scholar]
- Précigoux G, Yariv J, Gallois B, Dautant A, Courseille C, Langlois d’Estaintot B. A crystallographic study of haem binding to ferritin. Acta Crystallographica Section D: Biological Crystallography. 1994;50:739–743. doi: 10.1107/S0907444994003227. [DOI] [PubMed] [Google Scholar]
- Razinkov I, Dandey V, Wei H, Zhang Z, Melnekoff D, Rice WJ, Wigge C, Potter CS, Carragher B. A new method for vitrifying samples for cryoEM. Journal of Structural Biology. 2016 doi: 10.1016/j.jsb.2016.06.001. [DOI] [PMC free article] [PubMed] [Google Scholar]
- Rohou A, Grigorieff N. CTFFIND4: Fast and accurate defocus estimation from electron micrographs. Journal of Structural Biology. 2015;192:216–221. doi: 10.1016/j.jsb.2015.08.008. [DOI] [PMC free article] [PubMed] [Google Scholar]
- Russo CJ, Passmore LA. Ultrastable gold substrates for electron cryomicroscopy. Science. 2014;346:1377–1380. doi: 10.1126/science.1259530. [DOI] [PMC free article] [PubMed] [Google Scholar]
- Scheres SHW. RELION: Implementation of a Bayesian approach to cryo-EM structure determination. Journal of Structural Biology. 2012;180:519–530. doi: 10.1016/j.jsb.2012.09.006. [DOI] [PMC free article] [PubMed] [Google Scholar]
- Shaikh TR, Yassin AS, Lu Z, Barnard D, Meng X, Lu TM, Wagenknecht T, Agrawal RK. Initial bridges between two ribosomal subunits are formed within 9.4 milliseconds, as studied by time-resolved cryo-EM. Proceedings of the National Academy of Sciences. 2014;111:9822–9827. doi: 10.1073/pnas.1406744111. [DOI] [PMC free article] [PubMed] [Google Scholar]
- Stagg SM, Lander GC, Pulokas J, Fellmann D, Cheng A, Quispe JD, Mallick SP, Avila RM, Carragher B, Potter CS. Automated cryoEM data acquisition and analysis of 284742 particles of GroEL. Journal of structural biology. 2006;155:470–481. doi: 10.1016/j.jsb.2006.04.005. [DOI] [PubMed] [Google Scholar]
- Suloway C, Shi J, Cheng A, Pulokas J, Carragher B, Potter CS, Zheng SQ, Agard DA, Jensen GJ. Fully automated, sequential tilt-series acquisition with Leginon. Journal of Structural Biology. 2009;167:11–18. doi: 10.1016/j.jsb.2009.03.019. [DOI] [PMC free article] [PubMed] [Google Scholar]
- Sun M, Li W, Blomqvist K, Das S, Hashem Y, Dvorin JD, Frank J. Dynamical features of the Plasmodium falciparum ribosome during translation. Nucleic Acids Research. 2015;43:10515–10524. doi: 10.1093/nar/gkv991. [DOI] [PMC free article] [PubMed] [Google Scholar]
- Tivol WF, Briegel A, Jensen GJ. An improved cryogen for plunge freezing. Microscopy and Microanalysis. 2008;14:375–379. doi: 10.1017/S1431927608080781. [DOI] [PMC free article] [PubMed] [Google Scholar]
- Unwin N. Acetylcholine receptor channel imaged in the open state. Nature. 1995;373:37–43. doi: 10.1038/373037a0. [DOI] [PubMed] [Google Scholar]
- Unwin N, Fujiyoshi Y. Gating movement of acetylcholine receptor caught by plunge-freezing. Journal of molecular biology. 2012;422:617–634. doi: 10.1016/j.jmb.2012.07.010. [DOI] [PMC free article] [PubMed] [Google Scholar]
- Walker M, Trinick J, White H. Millisecond time resolution electron cryo-microscopy of the M-ATP transient kinetic state of the acto-myosin ATPase. Biophysical journal. 1995;68:87S. [PMC free article] [PubMed] [Google Scholar]
- White H, Thirumurugan K, Walker M, Trinick J. A second generation apparatus for time-resolved electron cryo-microscopy using stepper motors and electrospray. Journal of structural biology. 2003;144:246–252. doi: 10.1016/j.jsb.2003.09.027. [DOI] [PubMed] [Google Scholar]
- White H, Walker M, Trinick J. A computer-controlled spraying-freezing apparatus for millisecond time-resolution electron cryomicroscopy. Journal of structural biology. 1998;121:306–313. doi: 10.1006/jsbi.1998.3968. [DOI] [PubMed] [Google Scholar]
- Wong W, Bai X-c, Brown A, Fernandez IS, Hanssen E, Condron M, Tan YH, Baum J, Scheres SH. Cryo-EM structure of the Plasmodium falciparum 80S ribosome bound to the anti-protozoan drug emetine. Elife. 2014;3:e03080. doi: 10.7554/eLife.03080. [DOI] [PMC free article] [PubMed] [Google Scholar]
- Wright ER, Iancu CV, Tivol WF, Jensen GJ. Observations on the behavior of vitreous ice at ~ 82 and ~ 12K. Journal of structural biology. 2006;153:241–252. doi: 10.1016/j.jsb.2005.12.003. [DOI] [PubMed] [Google Scholar]
- Wu S, Tutuncuoglu B, Yan K, Brown H, Zhang Y, Tan D, Gamalinda M, Yuan Y, Li Z, Jakovljevic J. Diverse roles of assembly factors revealed by structures of late nuclear pre-60S ribosomes. Nature. 2016;534:133–137. doi: 10.1038/nature17942. [DOI] [PMC free article] [PubMed] [Google Scholar]
- Xia Y, Whitesides GM. Soft lithography. Annual review of materials science. 1998;28:153–184. [Google Scholar]
- Yu X, Ge P, Jiang J, Atanasov I, Zhou ZH. Atomic model of CPV reveals the mechanism used by this single-shelled virus to economically carry out functions conserved in multishelled reoviruses. Structure. 2011;19:652–661. doi: 10.1016/j.str.2011.03.003. [DOI] [PMC free article] [PubMed] [Google Scholar]
- Zeitler E, Bahr GF. A photometric procedure for weight determination of submicroscopic particles quantitative electron microscopy. Journal of Applied Physics. 1962;33:847–853. [Google Scholar]
Associated Data
This section collects any data citations, data availability statements, or supplementary materials included in this article.