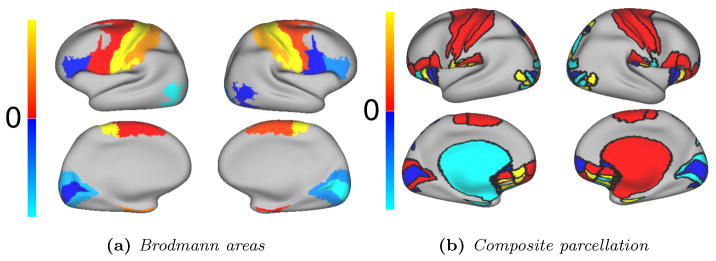
Figure 12.
Comparison of the performance of the group-wise parcellation w.r.t random parcellations for (a) the Brodmann map and (b) the composite parcellation Van Essen et al. (2012). Values higher than zero (red to yellow) have a higher overlap than random parcellations, worse overlaps are shown in blue. (a) For each parcel, we count the number of times a parcel overlaps better (+1) or worse (−1) for all subjects and parcellation resolutions. (b) Overlaps are compared for 200 parcels, and averaged over the 50 random parcellations. Yellow and cyan parcels have an overlap difference of more than 20 % between both parcellations, other cases are shown in red and blue.

