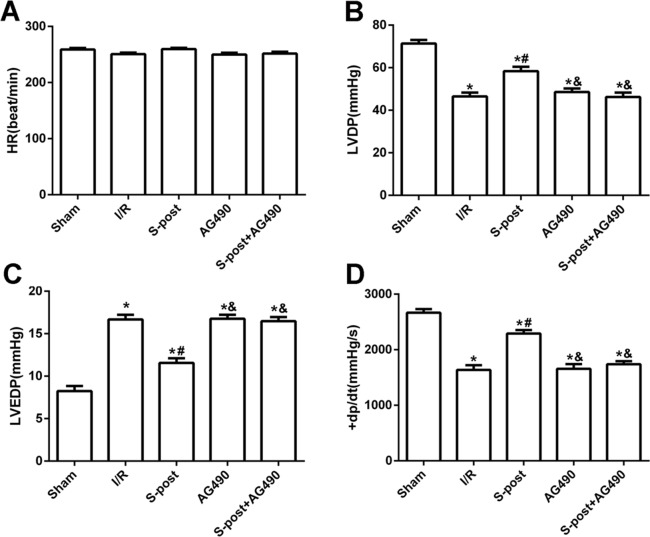
Figure 2. S-post improve myocardial function in vitro model.
Hemodynamic changes were measured at the end of reperfusion (n = 12/group). (A) Heart rate (HR, beat/per min); (B) left ventricular developed pressure (LVDP, mmHg); (C) left ventricular end-diastolic pressure (LVEDP, mmHg); (D) maximum rate of increase of LV pressure (+dp/dtmax, mmHg/s). *p < 0.05 compared with sham group, #p < 0.05 compared with I/R group and &p < 0.05 compared with S-post group.

