Abstract
At present, it has become evident that inflammation plays a critical role in tumor growth; meanwhile, chemotherapeutic agents using nanocarriers have been suggested as a promising strategy in cancer treatment. In this study, novel redox-responsive micelles were prepared from monomethoxy-poly(ethylene glycol)-chitosan-S-S-hexadecyl (C16-SS-CS-mPEG). These micelles were able to carry and deliver drugs into tumor cells. To serve as a control, monomethoxy-poly(ethylene glycol)-chitosan-C-C-hexadecyl (C16-CC-CS-mPEG) was developed in a similar fashion to that used to yield C16-CC-CS-mPEG without a redox-responsive disulfide bond. The cellular uptake mechanisms of both micelles were determined. The efficient intracellular drug release from micelles in MCF-7 cells was further confirmed. Results indicated that curcumin (Cur) could rapidly form C16-SS-CS-mPEG@ Cur micelles when exposed to reducing agents and efficaciously enhance intracellular accumulation. The cytotoxicity assay demonstrated that C16-SS-CS-mPEG@Cur exhibited satisfactory cytotoxicity against MCF-7 cells. Anti-inflammation assay results indicated that C16-SS-CS-mPEG@Cur treatment significantly downregulated tumor necrosis factor (TNF-α) expression and showed good anti-inflammatory effects in tumor microenvironment. Most importantly, antitumor effects in vivo showed satisfactory therapeutic effects with C16-SS-CS-mPEG@Cur. Hence, C16-SS-CS-mPEG@Cur micelles can be useful in tumor therapy.
Keywords: micelles, curcumin, anti-inflammatory effect, anti-tumor effect, tumor
Introduction
There is clear evidence that an inflammatory microenvironment is an essential component of all tumors, including some in which a direct causal relationship with inflammation is not yet proven.1–3 Obvious inflammation is a key factor in tumor formation, growth, and metastasis.4,5 These connections between cancer and inflammation inspire us to combine the treatment of inflammation and cancer to achieve better cancer therapeutic effects. For example, Marques et al6 reported application of nonsteroidal anti-inflammatory drugs in breast cancer therapy.
Recent studies show that a polymeric micelle is one of the most attractive nanocarriers for drugs to avoid their weaknesses such as poor water solubility and improve targeting through the enhanced permeability and retention (EPR) effect.7,8 Compared with other delivery systems, polymeric micelles confer some important advantages such as protecting drugs from adverse surrounding environments through entrapping these hydrophobic drugs into a hydrophobic inner core and a uniquely designed structure response to several individual factors in cancer cells, such as low pH and a redox environment.7–9 In the present study, chitosan (CS) was chosen as the backbone of the polymeric micelle. Monomethoxy-poly (ethylene glycol), C16-SS-COOH, or C16-CC-COOH has been grafted onto CS to form hydrophobic and hydrophilic structures so that self-assembly into nanosized micellar form was possible. C16-CC-COOH micellar forms were used in contrast with C16-SS-COOH forms to verify redox-responding controlled-release properties caused by glutathione (GSH).
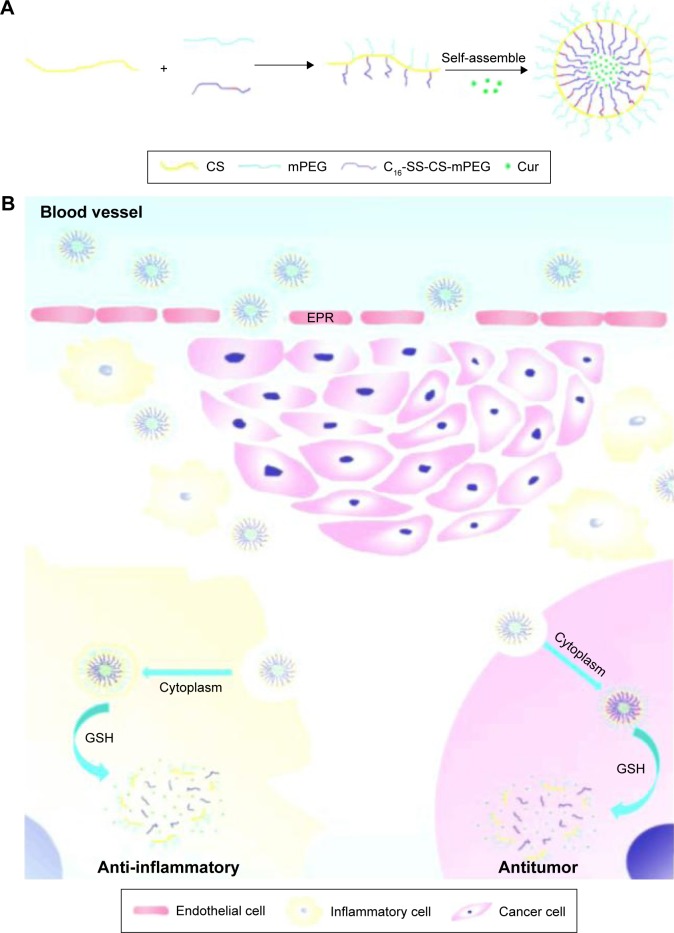
Curcumin (Cur), a polyphenol compound derived from the rhizome of the plant Curcuma longa, exhibits anti- inflammatory, anticancer, antioxidant, antimicrobial, and antiangiogenic activities.10–13 Among these pharmacological activities, the anticancer and anti-inflammatory activities have attracted the greatest attention because Cur could be a promising chemotherapeutic agent for use in solid tumor therapy.14,15 With poor water solubility and an insufficient cellular uptake rate, Cur was limited for further application.16,17 Therefore, loading Cur to improve its water solubility and to improve its anticancer and anti-inflammatory effects was desirous. From this standpoint, in this study, we optimized the synthesis of nanosized micelles formulated with different amphiphilic polymers and loaded Cur into micellar forms and examined their antitumor efficacy in vitro and in vivo. The anticancer efficacy of monomethoxy-poly(ethylene glycol)-chitosan-S-S-hexadecyl (monomethoxy-poly(ethylene glycol)-chitosan-S-S-hexadecyl with Cur) in recipient mice was evaluated as shown in Scheme 1. Our results indicated that C16-SS-CS-mPEG@Cur had inflammatory microenvironment-enhanced antitumor activity and fewer side effects in vivo, with potential clinical applications.
Scheme 1.
Schematic illustration of the preparation of C16-SS-CS-mPEG@Cur micelles as drug delivery system for efficient cancer therapy and inflammatory therapy.
Notes: (A) The formation of C16-SS-CS-mPEG@Cur micelles and (B) extracellular and intracellular trafficking for the delivery of Cur to cancer cells and inflammatory cells.
Abbreviations: C16-SS-CS-mPEG, monomethoxy-poly(ethylene glycol)-chitosan-S-S-hexadecyl; Cur, curcumin; EPR, enhanced permeability and retention; GSH, glutathione.
Materials and methods
Materials
All reagents and solvents were purchased commercially and used without further purification, unless specifically noted. N-Hydroxysuccinimide (NHS), 3,3′-dithiodipropionic acid, 1-hexadecanol, 4-dimethylaminopyridine (DMAP; 99%, J&K; Guangdong, People’s Republic of China), monomethoxy-poly(ethylene glycol) (mPEG; Mn =2,000 Da, Fluka; St Louis, MO, USA), 1-(3-dimethylaminopropyl)-3-ethylcarbodiimide hydrochloride (EDC·HCl; Shanghai Chemical Co., Shanghai, People’s Republic of China), N,N-dimethyl formamide (DMF), and Cur (Shanghai Yingxuan Co., Shanghai, People’s Republic of China). MCF-7, HEK293, and NIH/3T3 cells were purchased from American Type Culture Collection (ATCC, Manassas, VA, USA). Fetal bovine serum (FBS) was purchased from Gibco (Life Technologies AG, Switzerland). Ultrapure Milli-Q water (MW 18.2) was used in all experiments.
Synthesis of C16-SS-CS-mPEG and monomethoxy-poly(ethylene glycol)-chitosan-C-C-hexadecyl (C16-CC-CS-mPEG)
C16-SS-CS-mPEG was synthesized by a series of reactions. First, under argon atmosphere 3,3′-dithiodipropionic acid (4.2 g, 10 mM) and EDC (4.6 g, 11 mM) were dissolved in 60 mL of anhydrous DMF. Then, DMAP (0.48 g, 1 mM) and hexadecanol (9.6 g, 10 mM) were added to the solution and stirred at 0°C–5°C for 2 h, followed by stirring for another 4 h at 25°C. Second, 1.0 g of CS was dissolved in 100 mL of 1% acetic acid solution, and then 0.32 g C16-SS-COOH, 0.62 g EDC, and 0.12 g NHS were added to another beaker, activated for half an hour with 200 mL of methanol, and then CS acetic acid solution was added dropwise, which was magnetically stirred at 25°C for 72 h, and at the end of the reaction, to the reaction flask was added 60 mL aqueous ammonia, and the product was centrifuged for 5 min (speed 8,000 rpm); the resultant product was washed 3–5 times by methanol, and then the final product was transferred to a dialysis bag for 7 days and freeze-dried. Third, under a nitrogen atmosphere, C16-SS-CS-mPEG polymer was synthesized. Compound (0.261 g, 0.6 mM), EDC (0.136 g, 0.66 mM), and DMAP (0.015 g, 0.13 mM) were added to an mPEG solution (0.2 g, 0.1 mM) in 7 mL of anhydrous dichloromethane. The product was centrifuged for 5 min (speed 8,000 rpm), and the resultant product was washed 3–5 times by methanol, and then the final product was transferred to a dialysis bag for 7 days and freeze-dried. The synthesis procedure of C16-CC-CS-mPEG polymer was similar to that of C16-SS-CS-mPEG polymer but 3,3-dithiodipropionic acid was replaced with octanedioic acid.
Preparation of Cur-loaded micelles
Cur-loaded polymeric micelles were prepared by the dialysis method. Before loading Cur into the micelles, 10 mg of Cur was dissolved in 1 mL of alcohol. Then, C16-SS-CS-mPEG polymer (50 mg) or C16-CC-CS-mPEG polymer (50 mg) was added to the solution, which was stirred at 25°C for 24 h. The final mixture was transferred to a dialysis bag (MWCO 8000) and dialyzed against alcohol at 25°C for 24 h to remove the unloaded Cur. The water was exchanged six times during entire procedure. Then, the product was collected by freeze-drying. The Cur concentration in alcohol was determined by fluorescence measurement using a calibration curve constructed from Cur/alcohol solutions with different Cur concentrations.
Characterization
Fourier transform-infrared spectrometry (FTIR) samples were recorded using an Equinox 55 IR spectrometer in the range 500–4,000 cm−1 by the KBr-disk method. 1H nuclear magnetic resonance (1H NMR) spectra were recorded using a Mercury VX-300 spectrometer at 300 MHz with D2O as the solvent and tetramethylsilane as an internal standard. Samples of C16-SS-CS-mPEG and C16-CC-CS-mPEG were dropped onto a holey carbon film on copper grids, allowed to dry, and observed by transmission electron microscopy (TEM). The micrographs were obtained using Hitachi (H-7650, Tokyo, Japan) instrument for TEM, operated at an accelerating voltage of 80 kV. The size distribution and stability of the nanoparticles were measured using a Zetasizer Nano-ZS particle analyzer (Malvern Instruments Limited) at least three times.
In vitro reduction-triggered release of Cur from Cur-loaded micelles
Cur was dissolved in water to prepare the stock solution (1 mg/mL); after being sonicated for 5 min in an ultrasonic bath, the solution was diluted using methanol (aliquot of the standard solution) to reach the final concentration ranging from 0.5 to 2.0 μg/mL (working solution). Water was used as a blank. The fluorescence intensity was measured (420–475 nm, n=5). Linearity was evaluated by linear regression analysis, which was calculated by least-squares regression analysis and analysis of variance (ANOVA) test (a =0.05).
To investigate the action of the Cur-loaded micelles for Cur released. The Cur-loaded micelles of C16-SS-CS-mPEG and C16-CC-CS-mPEG were dispersed in 10 mL of phosphate-buffered saline (PBS) (pH 7.4) or PBS with 10 mM dithiothreitol (DTT) at 37°C. Aliquots (50 mL) were taken from the suspension at predetermined time intervals and replaced with an equal volume of the fresh medium, the released samples were centrifuged. The concentration of released Cur was determined by measurement of ultraviolet–visible (UV Vis) spectra at 425 nm based on the standard curve.
Endocytosis inhibition
MCF-7 cells were seeded with a density of 5×10⁵ cells per well and cultured in the six-well plates for 24 h. The cells were pretreated for 30 min with three different endocytosis inhibitors separately (5 mM methyl-β-cyclodextrin [MBCD], 0.45 mM sucrose, and 5 mM cytochalasin D). Then, the Cur-loaded C16-SS-CS-mPEG micelles or Cur-loaded C16-CC-CS-mPEG micelles were added at a final Cur concentration of 2 mg/mL. After incubation for 2 h, the medium was removed and cells were washed with PBS solution three times. The uptake was analyzed by confocal laser scanning microscope (CLSM) and flow cytometry (FCM).
Intracellular Cur release
MCF-7 cells were seeded with a density of 5×10⁵ cells per well and cultured in the six-well plates for 24 h. Then, the Cur-loaded C16-CC-CS-mPEG micelles or Cur-loaded C16-CC-CS-mPEG micelles were added at a final Cur concentration of 2 mg/mL. After incubation for 2, 12, 24 or 48 h, the cells were washed with PBS for 30 min at room temperature. The uptake was analyzed by CLSM and FCM.
In vitro cytotoxicity assays
The cytotoxicity of the synthesized nanoparticles was assessed using the MTT assay. Briefly, MCF-7 cells were seeded in 96-well plates at 1×10⁴ and incubated for 24 h at 37°C before MTT assay. The cells were then treated with various concentrations of Cur, C16-SS-CS-mPEG, C16-CC-CS-mPEG, C16-SS-CS-mPEG@Cur, and C16-CC-CS-mPEG@ Cur for 24 h, respectively. After incubation, cells were treated with MTT solution (final concentration, 0.5 mg/mL for each well) for 4 h at 37°C. The medium was removed carefully and 150 mL of dimethylsulfoxide (DMSO) was added to each well to dissolve the precipitate. The absorbance was measured on a microplate reader at 570 nm. To determine the cytotoxicities in normal cells of C16-SS-CS-mPEG and C16-CC-CS-mPEG as carriers, another MTT assay was performed in HEK293 cells, using the same abovementioned methods. All doses of complexes were parallel tested in triplicate, and the data were presented as averages of standard deviations (SDs) of three independent experiments.
TUNEL and DAPI costaining
For TUNEL and 4′,6-diamidino-2-phenylindole (DAPI) staining assays, MCF-7 cells were seeded in six-well plates with a density of 5×10⁵ cells per well, then incubated with Cur, C16-SS-CS-mPEG, C16-CC-CS-mPEG, C16-SS-CS-mPEG@Cur, and C16-CC-CS-mPEG@Cur for 24 h at a density of 1×10⁵ cells. The cells cultured in plates were fixed with 3.7% formaldehyde and then permeabilized with 0.1% Triton X-100 in PBS. Then, the cells were incubated with TUNEL reaction mixture containing nucleotide mixture and terminal deoxynucleotidyl transferase (TdT) for 1 h and 1 mg mL−1 of DAPI for 15 min at 37°C, respectively. Stain cells were then rinsed with PBS and observed under a fluorescence microscope (Nikon Eclipse 80i).
Apoptosis assay by FCM
The MCF-7 cells (5×10⁵ cells/well) in six-well culture plates were incubated with PBS, Cur, C16-CC-CS-mPEG, C16-SS-CS-mPEG, C16-CC-CS-mPEG@Cur, and C16-SS-CS-mPEG@Cur for 48 h, collected, and washed twice with PBS. To detect apoptosis, both adherent and floating cells were harvested together and resuspended in annexin V binding buffer (10 mM HEPES/NaOH, pH 7.4, 140 mM NaCl, 2.5 mM CaCl2) at a concentration of 1×10⁶ cells/mL. Subsequently, 5 mL of propidium iodide and 5 mL of FITC-conjugated annexin V were added to 100 mL of the cell suspension (1×10⁵ cells). The cells were incubated at room temperature for 15 min in the dark. Finally, 400 mL of annexin V binding buffer was added to each tube, and cells were analyzed by FCM (BD FACSAria).
Quantitative real-time polymerase chain reaction (Q-PCR) and Western blotting analysis
NIN/3T3 cells were precultured on six-well plates, at the density of 1×10⁵ per well, and cultured at 37°C in 5% CO2 atmosphere for 24 h. Then, the cells were incubated with lipopolysaccharide (LPS), C16-CC-CS-mPEG, C16-SS-CS-mPEG, Cur, C16-CC-CS-mPEG@Cur, C16-SS-CS-mPEG@Cur, and PBS for 24 h. The total RNA was collected and isolated from the cells using a TRIzol Reagent (Invitrogen, Carlsbad, CA, USA). A total of 1 μg of total RNA from each group was reverse transcribed into cDNA (20 μL) using the PrimeScript First Strand cDNA synthesis kit. Thereafter, 2 μL of cDNA was subjected to qPCR analysis using the SYBR Premix Ex TaqTM (TaKaRa Code: DRR041A).
NIH/3T3 cells (1×10⁵ cells/well) were seeded into 96-well plate and then cultured at 37°C for 24 h. The cells were pretreated with Cur, C16-SS-CS-mPEG@Cur, and C16-CC-CS-mPEG@Cur for 4 h prior to LPS stimulation. After 48 h treatment with the delivery system, the cells were incubated with lysis buffer (Beyotime, Shanghai, People’s Republic of China) to obtain total cellular proteins. The protein concentration in the lysate was determined using the bicinchoninic acid (BCA) assay. Samples (20 μg) were separated by sodium dodecyl sulfate–polyacrylamide gel electrophoresis (SDS-PAGE) with 12% acrylamide and transferred to a nitrocellulose membrane using a Western blot apparatus. Each membrane was blocked with 5% bovine serum albumin for 2 h, and then incubated overnight at 4°C with 1 μg/mL of a 1:2,000 dilution of primary antibody. HRP-conjugated tumor necrosis factor (TNF-α; a 1:10,000 dilution) was used as the secondary antibody. Protein expression levels were determined by signal analysis using an image analyzer (Fuji-Film, Tokyo, Japan). β-Actin was used to confirm the comparable amount of proteins in each sample.
Determination of the TNF-α secretion
NIH/3T3 cells (1×10⁵ cells/well) were seeded into 96-well plate and then cultured at 37°C for 24 h. The cells were pretreated with Cur, C16-SS-CS-mPEG@Cur, and C16-CC-CS-mPEG@Cur for 4 h prior to LPS stimulation. LPS in medium was added at a final concentration of 1.0 mg/mL. After incubating for 48 h, the cell supernatants were collected, centrifuged at 800 rpm for 5 min, and the concentration of TNF-α was detected by enzyme-linked immunosorbent assay (ELISA) assay kit.
Animals and tumor model
Female nude C57/BL/6 mice (6 weeks old) were purchased from Sun Yat-sen University. The animals received care under pathogen-free conditions. Nude mice were kept under conditions controlled 50%±5% of humidity and 25°C±1°C of temperature and allowed free access to sterilized tap water and laboratory rodent chow. All the animal operations complied with the institutional and Chinese government guidelines for the care and use of experimental animals, and were approved by the Animal Care and Use Committee of Jinan University. To develop the tumor model, 1×10⁶ MCF-7 cells suspended in 100 μL of PBS were subcutaneously injected into the right breast of each mouse. The mice were used when tumor volumes reached ∼100 mm3.
In vivo imaging
For in vivo imaging, 200 μL of saline (control), Cur, and C16-SS-CS-mPEG@Cur with a 0.54 mg/mL Cur equivalent concentration was intravenously injected into each mouse (doses: Cur mg/kg). In vivo fluorescence imaging was conducted using a Maestro in vivo optical imaging system (Cambridge Research and Instrumentation, Inc., Woburn, MA, USA). To detect Cur fluorescence, we used red light with the center wavelength at 661 nm as the excitation light and collected emission spectra from 600 to 850 nm. Spectral unmixing was conducted by the Maestro software to remove the autofluorescence background.
In vivo treatment
The mice model was intravenously injected with 2.5 mg/kg C16-SS-CS-mPEG@Cur and saline (control) every day. The mice tumor sizes and body weights were recorded every 3 days; the tumor sizes were measured by Vernier caliper and calculated as length × width × height. Then, these mice were killed, and all the tumors were immediately harvested and weighed.
Results
Characterization of C16-SS-CS-mPEG and C16-SS-CS-mPEG@Cur
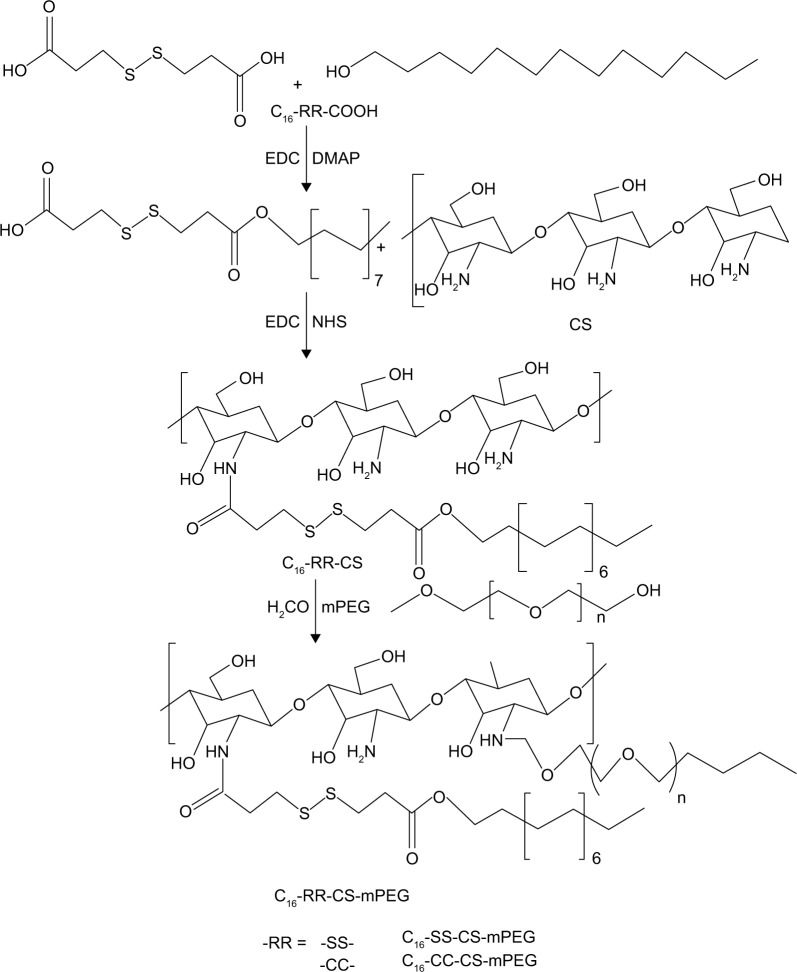
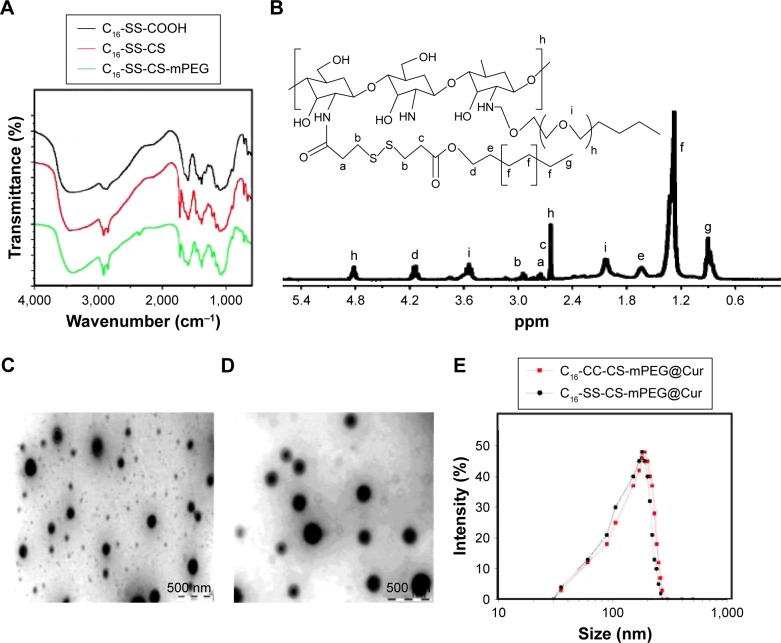
The synthesis procedure of C16-SS-COOH or C16-CC-COOH polymer is illustrated in Scheme 2. The synthesis of amphiphilic CS through the inclusion of mPEG, C16-SS-COOH, or C16-CC-COOH moieties using amine coupling chemistry was demonstrated by FTIR analysis. As shown in Figure 1A, peaks at 1,657 cm−1 and 1,600 cm−1 are the characteristic bands of CS. The slight increase in the amide I band at ∼1,650 cm−1 results from the amidation and simultaneous grafting of C16-SS-COOH or C16-CC-COOH into the CS. Furthermore, the slight increase in signal of methylene at ∼2,900 cm−1 was obtained from mPEG of C16-SS-CS-mPEG or C16-SS-CS-mPEG, proving that a graft reaction between CS and mPEG occurred. Further characterization of the chemical composition of different compounds was performed by 1H NMR analysis. Figure 1B shows the 1H NMR spectrum of C16-CC-CS-mPEG. A peak appeared at 2.0035 ppm, which indicated the acetyl group (–NH–O–CH3) protons from the acetylated residues in CS. The peaks at 3.753 and 4.255 ppm were assigned to mPEG. Also, the structure of C16-SS-COOH was confirmed by 1H NMR as shown in Figure S1; a peak appeared at 3.6876 ppm, which indicated the coupling of hexadecanol. The mPEG-CC-C16 polymer was similarly prepared and used as a control.
Scheme 2.
Synthesis pathway of the amphiphilic polymers.
Abbreviations: C16-SS-CS-mPEG, monomethoxy-poly(ethylene glycol)-chitosan-S-S-hexadecyl; C16-CC-CS-mPEG, monomethoxy-poly(ethylene glycol)-chitosan-C-C-hexadecyl; Cur, curcumin; EDC, 1-(3-dimethylaminopropyl)-3-ethylcarbodiimide; DMAP, 4-dimethylaminopyridine; NHS, N-hydroxysuccinimide.
Figure 1.
The characteristics of different micelles.
Notes: (A) FTIR spectra of C16-SS-COOH, C16-SS-CS, and C16-SS-CS-mPEG. (B) 1H NMR spectra of C16-SS-CS-mPEG polymer in D2O (ppm). TEM micrographs of (C) C16-SS-CS-mPEG@Cur micelles and (D) C16-CC-CS-mPEG@Cur micelles. The size distribution by DLS of (E) C16-SS-CS-mPEG@Cur micelles and C16-CC-CS-mPEG@Cur micelles.
Abbreviations: FTIR, Fourier transform-infrared spectrometry; C16-SS-CS-mPEG, monomethoxy-poly(ethylene glycol)-chitosan-S-S-hexadecyl; C16-CC-CS-mPEG, monomethoxy-poly(ethylene glycol)-chitosan-C-C-hexadecyl; Cur, curcumin; 1H NMR, 1H nuclear magnetic resonance; TEM, transmission electron microscopy.
In normal physiological aqueous environments, the conjugates spontaneously formed into micellar nanoparticles with hydrophobic and hydrophilic parts.18–20 As shown in Figure 1C and D, the C16-SS-CS-mPEG@Cur and C16-CC-CS-mPEG@Cur micelles were uniform and spherical with diameters between 95–121 nm and 87–155 nm as observed from TEM measurements, respectively. The hydrodynamic diameters of C16-SS-CS-mPEG@Cur and C16-CC-CS-mPEG@Cur micelles determined by dynamic light scattering (DLS) were 173±14 and 188±22 nm, respectively (Figure 1E). The average diameters were slightly larger than those found in the TEM results because of the different detection conditions used. TEM images are captured when nanoparticles are in a dried state, whereas DLS gives the hydrodynamic size thereof. Similar results arose elsewhere.21 These results indicated that both C16-SS-CS-mPEG@Cur and C16-CC-CS-mPEG@Cur formulations self-assembled into micelles with sizes suitable for passive intratumoral targeting accumulation of antineoplastic drug through the EPR effect.22,23
In vitro drug release from micelles
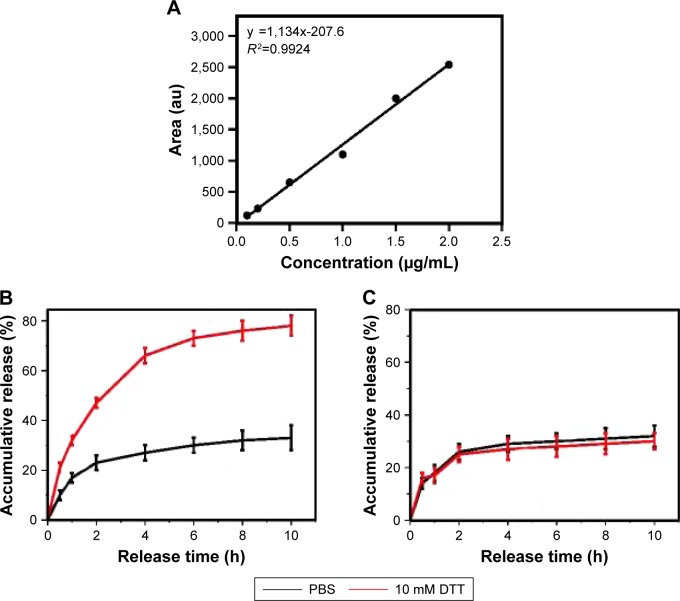
Disulfide linkages can be readily reduced into free thiols in the presence of reducing agents. The disulfide bridge linkage between CS and C16 makes C16-SS-CS-mPEG micelles reductively breakable in response to DTT, which leads to drug release. The calibration curves of Cur are shown in Figure 2A, and Cur load capacity of C16-SS-CS-mPEG and C16-CC-CS-mPEG was 7.62 and 8.21 wt%, respectively. The in vitro release behaviors of Cur from C16-SS-CS-mPEG@Cur were detected in water at different concentrations of DTT; C16-CC-CS-mPEG@Cur served as a control.
Figure 2.
In vitro drug release from micelles.
Notes: (A) Calibration curves of Cur at concentrations of 0.1–2.0 μg mL−1. Reduction-triggered release of Cur from (B) C16-SS-CS-mPEG@Cur micelles and (C) Cur-loaded C16-CC-CS-mPEG@Cur micelles in PBS (10 mM, pH 7.4) with, or without, 10 mM DTT. Data are shown as mean ± SD (n=3).
Abbreviations: C16-SS-CS-mPEG, monomethoxy-poly(ethylene glycol)-chitosan-S-S-hexadecyl; C16-CC-CS-mPEG, monomethoxy-poly(ethylene glycol)-chitosan-C-C-hexadecyl; Cur, curcumin; PBS, phosphate-buffered saline; SD, standard deviation.
As shown in Figure 2B and C, the release profiles showed a burst release at the early stage for Cur from C16-SS-CS-mPEG@Cur, 87.4% of Cur was released in the presence of 10 mM DTT in 10 h. However, there was only 25.9% Cur released from C16-SS-CS-mPEG@Cur after 10 h in the absence of DTT. In contrast, only 27.6% and 28.3% Cur was released from C16-CC-CS-mPEG@Cur with or without DTT, respectively, indicating that the addition of DTT had a negligible effect on the release of Cur from the C16-CC-CS-mPEG@Cur micelles. These results could have arisen because of the cleavage of the disulfide bond in the C16-SS-CS-mPEG@Cur polymer caused by DTT, which broke the structure of the micellar form. These results suggested that C16-SS-CS-mPEG@Cur micelles may achieve controlled-release drug effects in the presence of reducing agents.
Endocytosis inhibition
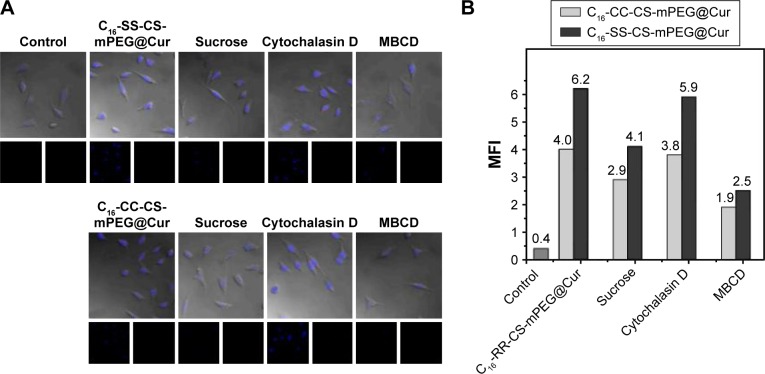
As a key factor for drug delivery nanoparticle systems, the endocytosis pathway of C16-SS-CS-mPEG@Cur and C16-CC-CS-mPEG@Cur micelles must be determined. There are three main endocytic pathways for nanoparticles: macropinocytosis, clathrin-mediated endocytosis, and caveolae-mediated endocytosis.24 In this assay, both C16-SS-CS-mPEG@Cur and C16-CC-CS-mPEG@Cur micelles were analyzed using CLSM and FCM. Three different types of endocytosis inhibitors were used to inhibit different endocytosis routes: we used 10 mM MBCD to inhibit caveolae-mediated endocytosis, 0.5 M hypertonic sucrose to inhibit clathrin-mediated endocytosis, and 10 mM cytochalasin D to inhibit macropinocytosis.
Figure 3A shows CLSM images of Cur fluorescence in MCF-7 cells after incubation with C16-SS-CS-mPEG@Cur and C16-CC-CS-mPEG@Cur micelles with, or without, endocytosis inhibitors for 2 h. For C16-SS-CS-mPEG@Cur micelles, the Cur fluorescence of cells treated with MBCD and hypertonic sucrose was weaker than that of cells incubated without an inhibitor: this was especially obvious in cells cultured with hypertonic sucrose. Cells cultured with cytochalasin D did not influence Cur fluorescence intensity compared with that in cells incubated without an inhibitor. The same result was obtained from the C16-CC-CS-mPEG@Cur micelle treatment group. The Cur fluorescence intensity represents the amount of cellular uptake of micelles. Meanwhile, the results from FCM showed the same behavior. As shown in Figure 3B, when treated with MBCD, the cellular uptake efficiencies of C16-SS-CS-mPEG@Cur and C16-CC-CS-mPEG@Cur micelles decreased to 70.3% and 68.6%, respectively. However, after treatment with hypertonic sucrose, the cellular uptake of C16-SS-CS-mPEG@Cur and C16-CC-CS-mPEG@Cur micelles significantly decreased to 43.8% and 44.2%, respectively. The inhibition with hypertonic sucrose and MBCD indicated that the pathways for micelle cellular uptake were caveolae-mediated endocytosis and clathrin-mediated endocytosis with the principal pathway being clathrin-mediated endocytosis. There was no obvious difference in uptake pathway between C16-SS-CS-mPEG@Cur and C16-CC-CS-mPEG@Cur micelles or even in cellular uptake efficiency. Therefore, both cellular uptake pathway and cellular uptake efficiency will not affect the following assays.
Figure 3.
Effect of endocytosis inhibitors on the uptake of different micelles.
Note: Effect of endocytosis inhibitors on the uptake of mPEG-S-S-C16@Cur micelles and mPEG-C-C-C16@Cur micelles on MCF-7 cells using CLSM (A) and FCM (B) analyses.
Abbreviations: C16-SS-CS-mPEG, monomethoxy-poly(ethylene glycol)-chitosan-S-S-hexadecyl; C16-CC-CS-mPEG, monomethoxy-poly(ethylene glycol)-chitosan-C-C-hexadecyl; Cur, curcumin; CLSM, confocal laser scanning microscope; FCM, flow cytometry; MFI, mean fluorescence intensity; MBCD, methyl-β-cyclodextrin.
Intracellular drug release
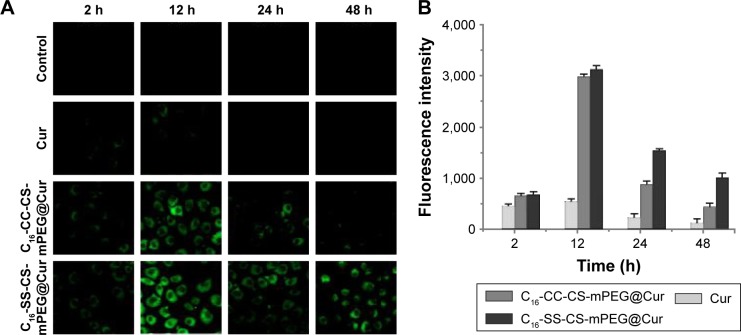
Since the internalization of both micelles (C16-SS-CS-mPEG@Cur and C16-CC-CS-mPEG@Cur) was mediated by the same endocytosis pathway, mainly by clathrin-mediated endocytosis, intracellular drug release of both micelles should be investigated. CLSM was used to observe MCF-7 cells after incubation with Cur-loaded micelles and free Cur for different times. As shown in Figure 4A and B, compared with free Cur treatment, cells treated with both C16-SS-CS-mPEG@Cur and C16-CC-CS-mPEG@Cur showed stronger fluorescence in the cytoplasm after 12 h. This may have been because of the drug delivery system enhancing the water solubility of Cur, which led to higher cellular uptake.25 Meanwhile, there was a significant difference between C16-SS-CS-mPEG@Cur and C16-CC-CS-mPEG@Cur. Both micelles could be accumulated by Cur rapidly in the cells in 2 h and reached their maximum concentration in 12 h. However, when treated with C16-SS-CS-mPEG@Cur they still showed strong fluorescence while fluorescence showed visible decreases when treated with C16-CC-CS-mPEG@Cur after 24 h, even remaining obvious after 48 h. These results may have been due to unreleased Cur in C16-CC-CS-mPEG@Cur being excreted with micelles, in contrast Cur released from C16-SS-CS-mPEG@Cur remained in the cells and played a pharmacodynamic role. Combined with the results of the drugs release assay (Figure 2), it was assumed that the C16-SS-CS-mPEG micelle structure would degrade when exposed to a reducing agent such as GSH in cells, and thus release drugs therein. Therefore, this C16-SS-CS-mPEG micelle was sensitive to reducing agents and could be a suitable redox-responsive drug carrier.
Figure 4.
(A and B) CLSM images of MCF-7 cells after treatment with PBS, Cur, C16-CC-CS-mPEG@Cur, and C16-SS-CS-mPEG@Cur for 2, 12, 24, and 48 h and corresponding quantitative analysis of Cur fluorescence intensity.
Note: The control exhibited no fluorescence.
Abbreviations: CLSM, confocal laser scanning microscope; PBS, phosphate-buffered saline; C16-SS-CS-mPEG, monomethoxy-poly(ethylene glycol)-chitosan-S-S-hexadecyl; C16-CC-CS-mPEG, monomethoxy-poly(ethylene glycol)-chitosan-C-C-hexadecyl; Cur, curcumin.
In vitro cytotoxicity assay
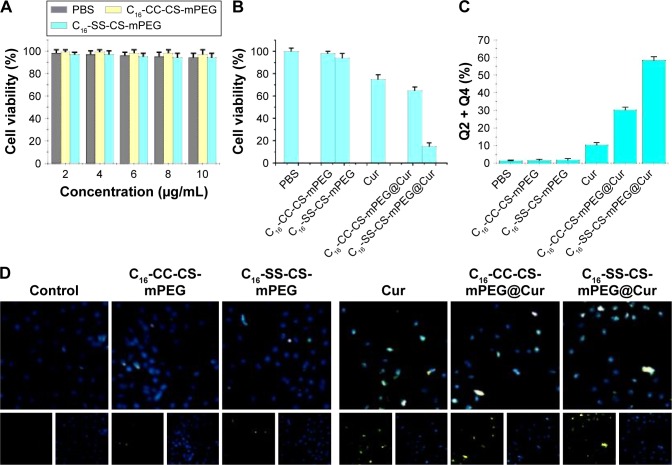
In this work, an MTT assay was conducted to compare the toxicities of different compounds against MCF-7 cells and HEK-293 cells. As shown in Figure 5A, compared with the control, HEK-293 cells were not influenced when incubated with both blank micelles, which indicated the noncytotoxicity and good biocompatibility of the two micelles, which was an essential property of such drug carriers.
Figure 5.
Cell viability and induction of apoptosis in MCF-7 cells.
Notes: (A) MTT assay of C16-SS-CS-mPEG micelles and C16-CC-CS-mPEG micelles in HEK293 cells after incubation for 24 h. (B) Cytotoxicity effects on MCF-7 cells of different micelles with, or without, drugs being loaded after incubation for 24 h. Measurement of cell apoptosis by (C) annexin V/PI double staining and (D) TUNEL assay and DAPI staining.
Abbreviations: C16-SS-CS-mPEG, monomethoxy-poly(ethylene glycol)-chitosan-S-S-hexadecyl; C16-CC-CS-mPEG, monomethoxy-poly(ethylene glycol)-chitosan-C-C-hexadecyl; Cur, curcumin; PBS, phosphate-buffered saline.
To investigate the cytotoxic effects, MCF-7 cells were incubated with different compounds for 24 h, followed by quantification of cell viability. Figure 5B shows that free Cur and drug-loaded micelles led to decreased cell viability after incubation. In detail, the cell survival rate was reduced to 72.2% after treatment with free Cur, while the value was 13.4% with the use of C16-SS-CS-mPEG@Cur. In addition, the cytotoxicity of C16-CC-CS-mPEG@Cur was slightly higher than that of the free Cur group with the cell survival rate of 63.3%. This could have been due to enhanced cellular uptake of drugs and the much faster release thereof from C16-SS-CS-mPEG micelles by cleavage of the disulfide bond, which was ensured by intracellular drug release assay (Figure 4). Consequently, the greater the dose released in cells, the higher the antitumor efficiency. The cell apoptosis was detected by annexin V/propidium iodide (PI) double staining and TUNEL assay and DAPI staining. As shown in Figure 5C and D, the cells incubated with the C16-SS-CS-mPEG@Cur cause obvious cells apoptosis than other nanoparticles. These results indicated that the drug delivery of redox-responsive C16-SS-CS-mPEG@ Cur systems had potential for chemotherapy and that it may have better tumor inhibition capability in vivo.
Anti-inflammation effects
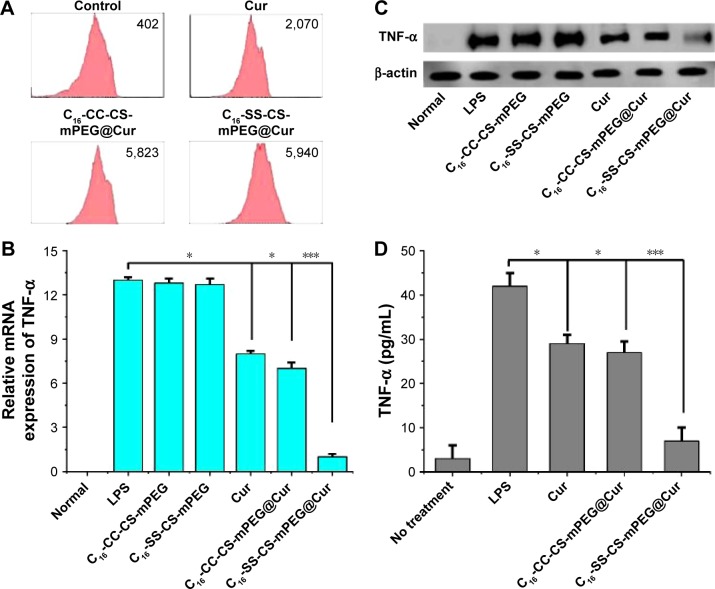
The inflammatory microenvironment around a tumor plays an important role in tumor formation, growth, and metastasis.26 In this work, one of the purposes of delivering Cur was to exploit its anti-inflammatory effect on the area around a tumor to achieve a combination therapy effect. Inflammatory cell models were established by NIH 3T3 cells stimulated with LPS.27 The cellular uptake of Cur was assessed by FACS analysis. Figure 6A shows that there was no significant difference in intracellular cumulative amount of Cur after treatment with C16-CC-CS-mPEG@Cur and C16-SS-CS-mPEG@Cur for 24 h, but there was about three times more than that found after treatment with free Cur, which indicated that drug-loaded micelles significantly enhanced the inflammatory cellular uptake of Cur.
Figure 6.
Anti-inflammatory effect in vitro.
Notes: (A) Histograms of Cur uptake in NIH/3T3 LPS-stimulated cells after 12 h incubation of Cur, C16-SS-CS-mPEG@Cur, and C16-CC-CS-mPEG@Cur. (B) Q-PCR analysis was used to evaluate mRNA levels. Anti-inflammatory effect of Cur, C16-SS-CS-mPEG@Cur, and C16-CC-CS-mPEG@Cur on TNF-α inflammatory mediator release in NIH/3T3 LPS-stimulated cells analyzed by (C) Western blot experiment and (D) enzyme-linked immunosorbent assay experiment. Data are shown as mean ± SD (n=3). *P<0.05, ***P<0.001.
Abbreviations: C16-SS-CS-mPEG, monomethoxy-poly(ethylene glycol)-chitosan-S-S-hexadecyl; C16-CC-CS-mPEG, monomethoxy-poly(ethylene glycol)-chitosan-C-C-hexadecyl; Cur, curcumin; LPS, lipopolysaccharide; Q-PCR, quantitative real-time polymerase chain reaction; TNF-α, tumor necrosis factor α; SD, standard deviation.
To test the anti-inflammatory effects of drug-loaded micelles, we investigated, in vitro, the effect of different compounds on the expression of TNF-α. TNF-α is a pro-inflammatory cytokine, which induces some pro- inflammatory cytokines including IL-1β, IL-6, IL-8, and itself by activation of NF-κB or MAPKs, and these cytokines play important roles in various inflammatory diseases.28,29 Decreased TNF-α expression can be used to measure the anti-inflammatory efficiency. The expression of TNF-α was determined by real-time quantification PCR (Q-PCR) analysis and Western blotting assay. As shown in Figure 6B, the mRNA expressions of TNF-α increase significantly after stimulation with LPS and then decrease gradually within C16-SS-CS-mPEG@Cur. As shown in Figure 6C, NIH 3T3 cells stimulated with LPS significantly enhanced the expression of TNF-α, whereas treatment with C16-SS-CS-mPEG@Cur significantly suppressed the expression of TNF-α in LPS-stimulated cells. Cur and C16-CC-CS-mPEG@Cur micelles slightly decreased TNF-α expression. These results could have been due to Cur-loaded C16-SS-CS-mPEG micelles being able to release Cur to cytoplasmic effect rapidly allowing it to play its anti-inflammatory pharmacological roles. In contrast, Cur encapsulated in C16-CC-CS-mPEG@Cur could not be released to exert its anti-inflammatory effects. This result was consistent with results of the previous intracellular drug release assay (Figure 4). Quantitative data from the ELISA experiment (Figure 6D) showed that, after stimulation with LPS, the concentration of TNF-α rose to ∼34.8 pg/mL. A total of 37.5 and 6.8 pg/mL of TNF-α were treated with C16-CC-CS-mPEG@Cur and C16-SS-CS-mPEG@Cur, respectively. This result confirmed the result of the previous Western blotting assay. Taken together, Cur could be released from C16-SS-CS-mPEG@Cur rapidly to play its anti-inflammatory role.
In vivo fluorescence imaging and biodistribution
As an effective delivery system for anticancer agents, a potential carrier should be able to deliver the drugs directly into tumor tissues to achieve tumor-targeted therapy. To evaluate whether C16-SS-CS-mPEG@Cur could efficiently assist in Cur accumulation in tumors, the fluorescence of Cur was observed using an IVIS Lumina imaging system at 4 h postadministration. Figure 7A shows the in vivo images after intravenous injection of free Cur and C16-SS-CS-mPEG@Cur into MCF-7 tumor-bearing nude mice. The fluorescence of tumor tissue, and other major organs of mice, is shown in Figure 7B. Through system modulation, there were no signals in the tumor tissues in the blank group (injected with saline), suggesting no autofluorescence interfered with the in vivo images, and the fluorescence signal intensity of in vivo imaging was close to a true reflection of Cur concentration. There was a significant difference in biodistribution of Cur between free Cur and C16-SS-CS-mPEG@Cur treatments. The C16-SS-CS-mPEG@Cur group showed strong fluorescence in the tumor region and was almost twice as strong as that in the free Cur group. Moreover, the fluorescence clearly accumulated in both the liver and kidney after treatment with free Cur; in contrast, there was only slight fluorescence accumulated in those regions. This increase in tumor-targeting efficiency provided by nanoparticle delivery might be due to an EPR effect and the controlled release property of C16-SS-CS-mPEG micelles. The results indicated that C16-SS-CS-mPEG@Cur has enhanced tumor-targeted delivery, which leads to enhance Cur accumulation in tumor.
Figure 7.
In vivo fluorescence imaging and fluorescence intensity of tissues.
Notes: (A) In vivo imaging of tumor-bearing mice after administration of saline, Cur, and C16-SS-CS-mPEG@Cur at 24 h. (B) Fluorescence intensity of tissues including tumor, heart, liver, spleen, lung, and kidney removed from tumor-bearing nude mice after sacrificing the mice at 24 h postinjection of saline, Cur, and C16-SS-CS-mPEG@Cur. The saline exhibited no fluorescence.
Abbreviations: C16-SS-CS-mPEG, monomethoxy-poly(ethylene glycol)-chitosan-S-S-hexadecyl; Cur, curcumin.
Antitumor effects in vivo
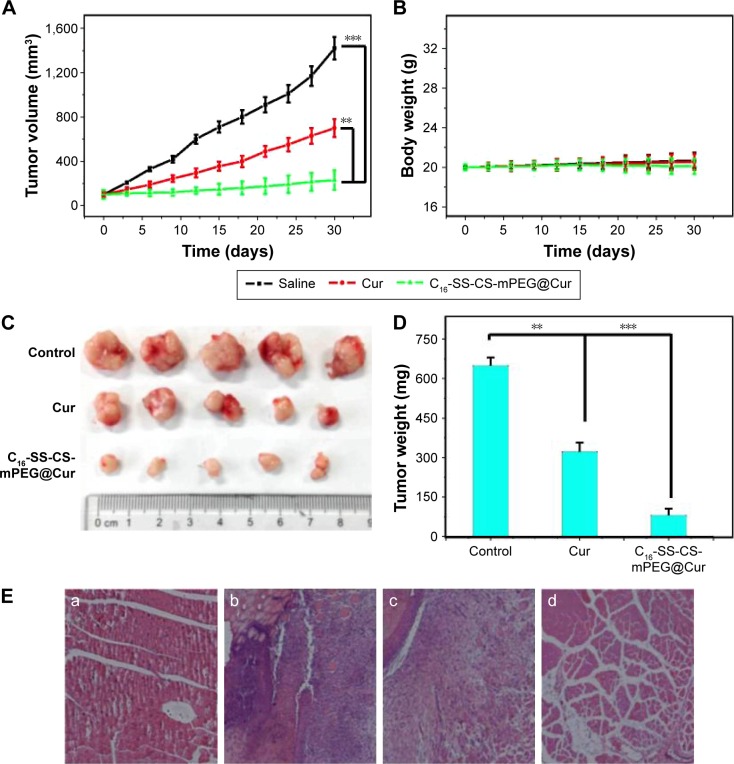
To investigate the therapeutic effect of C16-SS-CS-mPEG@Cur on tumors in vivo, a breast tumor xenograft model was established by subcutaneous injection of MCF-7 cells of nude mice (five per group). Treatments started when the tumor volume reached ∼100 mm3. Injections occurred for a total of seven times on alternate days, and both mouse body weights and tumor size were recorded simultaneously. The average volume of the tumor was monitored every 3 days. As shown in Figure 8A, evidence was provided of the therapeutic effect of C16-SS-CS-mPEG@Cur micelles. Tumors treated with saline and C16-SS-CS-mPEG showed continuous growth with similar tendencies at a relatively high rate with a final tumor volume of ∼1,300 mm3, suggesting that the MCF-7 tumor growth was unaffected by saline and non-drug-loaded micelles. Free Cur groups showed slight inhibition. Most importantly, the C16-SS-CS-mPEG@Cur-treated group exhibited the highest inhibition of those tested, with a final tumor volume of ∼205 mm3. Compared with the MTT assay (Figure 5), this result may have been due to passive targeting and the controlled release properties of C16-SS-CS-mPEG@Cur micelles.
Figure 8.
Anti-cancer and anti-inflammatory effects in vivo.
Notes: (A) Tumor volumes at different times after treatment. (B) The average mouse body mass was monitored using an electronic balance every 3 days. (C) The images of dislodged tumors from the mice 30 days posttreatment. (D) The mass of dislodged tumors from the mice in all five groups. **P<0.01, ***P<0.001. (E) Hematoxylin and eosin-stained images of skin sections around tumors collected from (a) healthy control, (b) saline, (c) Cur, and (d) C16-SS-CS-mPEG@Cur-injected mice bearing MCF-7 tumors 30 days postinjection. Data are shown as mean ± SD (n=5).
Abbreviations: C16-SS-CS-mPEG, monomethoxy-poly(ethylene glycol)-chitosan-S-S-hexadecyl; Cur, curcumin; SD, standard deviation.
After 30 days’ treatment, the mice were sacrificed, and the tumor masses were measured. Figure 8C shows the solid tumors from each group: intuitive, and similar, results were obtained among which, the C16-SS-CS-mPEG@Cur group exhibited the most dramatic inhibition of tumor growth. Figure 8D further reveals the inhibitory effect based on average tumor mass in each group. While the average tumor mass in the saline group was 0.635±0.027 g, that of the free Cur and C16-SS-CS-mPEG@Cur groups reached 0.337±0.045 g and 0.089±0.072 g, respectively. Now, tumor growth inhibition reached 47.2% and 85.9%, respectively. These results demonstrated that C16-SS-CS-mPEG@Cur can achieve satisfactory antitumor effects in vivo.
We also monitored the mass of the mice every 3 days (Figure 8B). There was a slight increase in body mass observed after the administration of saline and C16-SS-CS-mPEG micelles showing that both micelles were biocompatible in vivo. A slight body mass loss was observed after the administration of C16-SS-CS-mPEG@Cur, which may have been due to the decreased mass of tumor tissue. In addition, the anti-inflammatory effects of C16-SS-CS-mPEG@ Cur or Cur against the tumor microenvironment were further verified by histological analyses of skin sections around tumors (Figure 8E). Compared with healthy control, tissues around tumors showed signs of severe inflammation, and massive numbers of inflammatory cells were observed. Cur treatment showed no remission of inflammation in the tumor microenvironment. In contrast, significantly reduced numbers of inflammatory cells were observed after being treated with C16-SS-CS-mPEG@Cur, indicating strong anti-inflammatory effect in vivo. This result may be because C16-SS-CS-mPEG@Cur treatment enhances Cur accumulation in tumor microenvironment and leads to raised Cur uptake of inflammatory cells. The improvement of inflammation in tumor microenvironment contributes to the inhibition of tumor, and it plays a synergistic role in the treatment process.3 Taken together, this confirmed that C16-SS-CS-mPEG@Cur micelles could be efficient nanocarriers for redox-responsive controlled drug delivery in vitro and tumor-targeted therapy in vivo.
Conclusion
An amphiphilic polymer C16-SS-CS-mPEG was synthesized by conjugating the hydrophilic mPEG and the hydrophobic alkyl chain (by a reduction-responsive disulfide bond) to CS. The polymer self-assembled into nanosize micellar form in aqueous solution. In vitro release studies revealed that C16-SS-CS-mPEG@Cur micelles were sensitive to a reducing agent, such as DTT, which led to rapid drug release. Similar results were found by intracellular drug release assay; moreover, C16-SS-CS-mPEG@Cur efficiently enhanced cellular uptake of Cur, which led to the highest cytotoxicity. The anti-inflammatory effects of C16-SS-CS-mPEG@Cur have also been tested by measurement of the downregulated TNF-α expression. The result showed that C16-SS-CS-mPEG@Cur exhibited a satisfactory anti-inflammatory effect and could improve the inflammation in tumor microenvironment. Furthermore, C16-SS-CS-mPEG@Cur administered via intravenous injection could significantly inhibit tumor growth in vivo and C16-SS-CS-mPEG@Cur benefited from its redox-responsive controlled intracellular release at the tumor site and synergistic effect of inflammation treatment. The present study affords a promising strategy for redox-responsive drug delivery systems for cancer therapy.
Supplementary material
1H NMR spectra of C16-SS-COOH polymer in D2O (ppm).
Abbreviation: 1H NMR, 1H nuclear magnetic resonance.
Acknowledgments
This work was supported by the National Natural Science Foundation of China (21171070, 21371075), the Natural Science Foundation of Guangdong Province (2014A030311025, S2013010011660), and the Planned Item of Science and Technology of Guangdong Province (2016A020217011).
Footnotes
Disclosure
The authors report no conflicts of interest in this work.
References
- 1.Mantovani A, Allavena P, Sica A, Balkwill F. Cancer-related inflammation. Nature. 2008;454(7203):436–444. doi: 10.1038/nature07205. [DOI] [PubMed] [Google Scholar]
- 2.Grivennikov SI, Greten FR, Karin M. Immunity, inflammation, and cancer. Cell. 2010;140(6):883–899. doi: 10.1016/j.cell.2010.01.025. [DOI] [PMC free article] [PubMed] [Google Scholar]
- 3.Pollard J. Bacteria, inflammation and cancer. Nat Rev Immunol. 2015;15(9):528–543. doi: 10.1038/nri3899. [DOI] [PubMed] [Google Scholar]
- 4.Sica A, Allavena P, Mantovani A. Cancer related inflammation: the macrophage connection. Cancer Lett. 2008;267(2):204–215. doi: 10.1016/j.canlet.2008.03.028. [DOI] [PubMed] [Google Scholar]
- 5.Coussens LM, Werb Z. Inflammation and cancer. Nature. 2002;420(6917):860–867. doi: 10.1038/nature01322. [DOI] [PMC free article] [PubMed] [Google Scholar]
- 6.Marques JG, Gaspar VM, Costa E, Paquete CM, Correia IJ. Synthesis and characterization of micelles as carriers of non-steroidal anti-inflammatory drugs (NSAID) for application in breast cancer therapy. Colloids Surf B Biointerfaces. 2014;113:375–383. doi: 10.1016/j.colsurfb.2013.09.037. [DOI] [PubMed] [Google Scholar]
- 7.Ebrahim Attia AB, Oh P, Yang C, et al. Insights into EPR effect versus lectin-mediated targeted delivery: biodegradable polycarbonate micellar nanoparticles with and without galactose surface decoration. Small. 2014;10(21):4281–4286. doi: 10.1002/smll.201401295. [DOI] [PubMed] [Google Scholar]
- 8.Lukyanov AN, Torchilin VP. Micelles from lipid derivatives of water-soluble polymers as delivery systems for poorly soluble drugs. Adv Drug Deliv Rev. 2004;56(9):1273–1289. doi: 10.1016/j.addr.2003.12.004. [DOI] [PubMed] [Google Scholar]
- 9.Xiao Y, Hong H, Javadi A, et al. Multifunctional unimolecular micelles for cancer-targeted drug delivery and positron emission tomography imaging. Biomaterials. 2012;33(11):3071–3082. doi: 10.1016/j.biomaterials.2011.12.030. [DOI] [PMC free article] [PubMed] [Google Scholar]
- 10.Heger M, van Golen RF, Broekgaarden M, Michel MC. The molecular basis for the pharmacokinetics and pharmacodynamics of curcumin and its metabolites in relation to cancer. Pharmacol Rev. 2014;66(1):222–307. doi: 10.1124/pr.110.004044. [DOI] [PubMed] [Google Scholar]
- 11.Fan X, Zhang C, Liu D-B, Yan J, Liang H-P. The clinical applications of curcumin: current state and the future. Curr Pharm Des. 2013;19(11):2011–2031. [PubMed] [Google Scholar]
- 12.Boyanapalli SS, Kong A-NT. “Curcumin, the King of Spices”: epigenetic regulatory mechanisms in the prevention of cancer, neurological, and inflammatory diseases. Curr Pharmacol Rep. 2015;1(2):129–139. doi: 10.1007/s40495-015-0018-x. [DOI] [PMC free article] [PubMed] [Google Scholar]
- 13.Dhule SS, Penfornis P, He J, et al. The combined effect of encapsulating curcumin and C6 ceramide in liposomal nanoparticles against osteosarcoma. Mol Pharm. 2014;11(2):417–427. doi: 10.1021/mp400366r. [DOI] [PMC free article] [PubMed] [Google Scholar]
- 14.Naksuriya O, Okonogi S, Schiffelers RM, Hennink WE. Curcumin nanoformulations: a review of pharmaceutical properties and preclinical studies and clinical data related to cancer treatment. Biomaterials. 2014;35:3365–3383. doi: 10.1016/j.biomaterials.2013.12.090. [DOI] [PubMed] [Google Scholar]
- 15.Liang J, Wu W, Lai D, Li J, Fang C. Enhanced solubility and targeted delivery of curcumin by lipopeptide micelles. J Biomater Sci Polym Ed. 2015;26(6):369–383. doi: 10.1080/09205063.2015.1012034. [DOI] [PubMed] [Google Scholar]
- 16.Preetha A, Ajaikumar BK, Robert AN, Bharat BA. Bioavailability of curcumin: problems and promises. Mol Pharm. 2007;4(6):807–818. doi: 10.1021/mp700113r. [DOI] [PubMed] [Google Scholar]
- 17.Kim TH, Jiang HH, Youn YS, et al. Preparation and characterization of water-soluble albumin-bound curcumin nanoparticles with improved antitumor activity. Int J Pharm. 2011;403(1–2):285–291. doi: 10.1016/j.ijpharm.2010.10.041. [DOI] [PubMed] [Google Scholar]
- 18.Sarisozen C, Abouzeid AH, Torchilin VP. The effect of co-delivery of paclitaxel and curcumin by transferrin-targeted PEG-PE-based mixed micelles on resistant ovarian cancer in 3-D spheroids and in vivo tumors. Eur J Pharm Biopharm. 2014;88(2):539–550. doi: 10.1016/j.ejpb.2014.07.001. [DOI] [PMC free article] [PubMed] [Google Scholar]
- 19.Huh KM, Lee SC, Cho YW, Lee J, Jeong JH, Park K. Hydrotropic polymer micelle system for delivery of paclitaxel. J Control Release. 2005;101(1–3):59–68. doi: 10.1016/j.jconrel.2004.07.003. [DOI] [PubMed] [Google Scholar]
- 20.Yang Y, Xie X, Yang Y, et al. Polymer nanoparticles modified with photo- and ph-dual-responsive polypeptides for enhanced and targeted cancer therapy. Mol Pharm. 2016;13(5):1508–1519. doi: 10.1021/acs.molpharmaceut.5b00977. [DOI] [PubMed] [Google Scholar]
- 21.Hu FQ, Meng P, Dai YQ, et al. PEGylated chitosan-based polymer micelle as an intracellular delivery carrier for anti-tumor targeting therapy. Eur J Pharm Biopharm. 2008;70(3):749–757. doi: 10.1016/j.ejpb.2008.06.015. [DOI] [PubMed] [Google Scholar]
- 22.Maruyama K. Intracellular targeting delivery of liposomal drugs to solid tumors based on EPR effects. Adv Drug Deliver Rev. 2011;63(3):161–169. doi: 10.1016/j.addr.2010.09.003. [DOI] [PubMed] [Google Scholar]
- 23.Lee JH, Lee K, Moon SH, Lee Y, Park TG, Cheon J. All-in-one target-cell-specific magnetic nanoparticles for simultaneous molecular imaging and siRNA delivery. Angew Chem Int Ed Engl. 2009;48(23):4174–4179. doi: 10.1002/anie.200805998. [DOI] [PubMed] [Google Scholar]
- 24.Perumal OP, Inapagolla R, Kannan S, Kannan RM. The effect of surface functionality on cellular trafficking of dendrimers. Biomaterials. 2008;29(24–25):3469–3476. doi: 10.1016/j.biomaterials.2008.04.038. [DOI] [PubMed] [Google Scholar]
- 25.Basnet P, Hussain H, Tho I, Skalko-Basnet N. Liposomal delivery system enhances anti-inflammatory properties of curcumin. J Pharm Sci. 2012;101(2):598–609. doi: 10.1002/jps.22785. [DOI] [PubMed] [Google Scholar]
- 26.Nasser MW, Elbaz M, Ahirwar DK, Ganju RK. Conditioning solid tumor microenvironment through inflammatory chemokines and S100 family proteins. Cancer Lett. 2015;365(1):11–22. doi: 10.1016/j.canlet.2015.05.002. [DOI] [PMC free article] [PubMed] [Google Scholar]
- 27.Giorgia DA, Gemma N, Chiara DM, Pietro M, Vladimir T. Gellan gum nanohydrogel containing anti-inflammatory and anti-cancer drugs: a multi-drug delivery system for a combination therapy in cancer treatment. Eur J Pharm Biopharm. 2014;87:208–216. doi: 10.1016/j.ejpb.2013.11.001. [DOI] [PubMed] [Google Scholar]
- 28.Cho J, Lee K, Kim C. Curcumin attenuates the expression of IL-1β, IL-6, and TNF-α as well as cyclin E in TNF-α-treated HaCaT cells; NF-κB and MAPKs as potential upstream targets. Int J Mol Med. 2007;19(3):469–474. [PubMed] [Google Scholar]
- 29.Xiao B, Laroui H, Ayyadurai S, Viennois E, Charania MA, Zhang Y. Mannosylated bioreducible nanoparticle-mediated macrophage-specific TNF-alpha RNA interference for IBD therapy. Biomaterials. 2013;34(30):7471–7482. doi: 10.1016/j.biomaterials.2013.06.008. [DOI] [PMC free article] [PubMed] [Google Scholar]
Associated Data
This section collects any data citations, data availability statements, or supplementary materials included in this article.
Supplementary Materials
1H NMR spectra of C16-SS-COOH polymer in D2O (ppm).
Abbreviation: 1H NMR, 1H nuclear magnetic resonance.


