Abstract
Objectives
The purpose of this preclinical study was to investigate whether moderate chronic kidney disease is a factor in potentiating gadolinium (Gd) uptake in the brain.
Materials and Methods
A comparative study was performed on renally impaired (subtotal nephrectomy) rats versus rats with normal renal function. The animals received 4 daily injections of 0.6 mmol Gd/kg a week for 5 weeks (cumulative dose of 12 mmol Gd/kg) of gadodiamide or saline solution. The MR signal enhancement in the deep cerebellar nuclei was monitored by weekly magnetic resonance imaging examinations. One week after the final injection, the total Gd concentration was determined by inductively coupled plasma mass spectrometry in different regions of the brain including the cerebellum, plasma, cerebrospinal fluid, parietal bone, and femur.
Results
After the administration of gadodiamide, the subtotal nephrectomy group presented a significantly higher T1 signal enhancement in the deep cerebellar nuclei and a major increase in the total Gd concentration in all the studied structures, compared with the normal renal function group receiving the same linear Gd-based contrast agent. Those potentiated animals also showed a pronounced hypersignal in the choroid plexus, still persistent 6 days after the last injection, whereas low concentration of Gd was found in the cerebrospinal fluid (<0.05 μmol/L) at this time point. Plasma Gd concentration was then around 1 μmol/L. Interestingly, plasma Gd was predominantly in a dissociated and soluble form (around 90% of total Gd). Total Gd concentrations in the brain, cerebellum, plasma, and bones correlated with creatinine clearance in both the gadodiamide-treated groups.
Conclusions
Renal insufficiency in rats potentiates Gd uptake in the cerebellum, brain, and bones.
Key Words: deep cerebellar nuclei, choroid plexus, bone, magnetic resonance imaging, gadolinium uptake, renal failure, gadodiamide
Gadolinium (Gd) brain uptake after repeated administration of Gd-based contrast agents (GBCAs) is becoming a prominent issue. Indeed, it has clearly been shown that repeated administrations of linear GBCA (LGBCA) lead to T1 signal enhancement in specific brain structures, in particular, the globus pallidus (GP) and dentate nuclei (DN).1–4 Although it was previously thought that GBCAs do not cross a healthy blood-brain barrier,5 the presence of Gd has been demonstrated in these structures, and puncture Gd deposits have even been found within brain endothelial cells and the interstitium of DN of postmortem specimens.6 This is raising important questions concerning the potential neurotoxic consequences of such accumulation. The Food and Drug Administration and European Medicines Agency have therefore requested marketing authorization holders to investigate this phenomenon in-depth.7,8 Because clinical studies are currently limited by their retrospective study design and lack of access to brain tissue, a preclinical model on rats has been developed to standardize and better evaluate the mechanism and the GBCAs comparison. Robert et al9,10 demonstrated similar T1 signal enhancement in the deep cerebellar nuclei (DCN), and this model is now being used to carry out more in-depth investigations.
A causal link between nephrogenic systemic fibrosis (NSF, a pathology characterized by fibrosis of skin and connective tissues, leading to disabling contracture of the joints) and prior administrations of linear GBCAs was demonstrated in patients with severe renal impairment in 2006.11 Since then, health authorities have recommended that renal function should be systematically checked before considering the injection of a linear and thermodynamically less stable GBCA (ie, gadodiamide,12–14 gadopentetate dimeglumine, and gadoversetamide) and contraindicated the use of such agents in patients with stage 4 and 5 chronic kidney disease (CKD), that is, glomerular filtration rate (GFR) equal to or lower than 30 mL/min per 1.73 m2 or with acute kidney injury.15,16
Nowadays, many magnetic resonance imaging (MRI) examinations are performed in elderly patients. In a US series, stage 1 to 3 CKD was detected in 42% of patients aged 65 to 74 years and in 59% of patients aged 75 to 84 years.17 Poor renal function could sensitize patients to exposure to these LGBCAs.18,19 Therefore, it is of major importance to investigate Gd brain uptake in a relevant nonclinical model with moderate renal insufficiency to investigate whether reduced excretion and, as a consequence, increased systemic exposure to an LGBCA may favor the accumulation of Gd in the DCN. To test this hypothesis, we studied a population of subtotally nephrectomized (SNx) rats who received 20 injections of a clinical dose of an LGBCA, gadodiamide, or saline, over 5 weeks, and which were compared with a population of rats with normal renal function.
MATERIALS AND METHODS
All experimental procedures and animal care were carried out according to French regulations and in compliance with Directive 2010/63/EU of the European Parliament and of the Council on the protection of animals used for scientific purposes. All experiments (injections, MRIs, image analyses, and Gd measurements) were carried out blindly.
Animal Model and Administration Protocol
The general scheme of the protocol is illustrated in Figure 1. The study was carried out on SNx or sham female Sprague-Dawley rats (SPF/OFA female rats, Charles River, L'Arbresle, France) aged 10 weeks and weighing 232 ± 14 g for sham-operated rats and 217 ± 9 g for SNx rats at the beginning of the study. A subtotal nephrectomy (5/6 SNx) was performed at Charles River Laboratories: a first operation was performed when the rats were 6 weeks old to excise 1 kidney, and a second operation was performed 1 week later to remove the upper and lower poles of the remaining kidney. Similar surgery was performed at the same time in sham-operated control rats, but without kidney excision. After 1 week of recovery, and 1 additional week of acclimatization, the animals were randomized (n = 10/group). The rats were housed 2 per cage, at an ambient temperature of 22 ± 2°C, hygrometry of 45% ± 10%, in a room with 12/12 light/dark cycles. The animals had access to water and food ad libitum.
FIGURE 1.
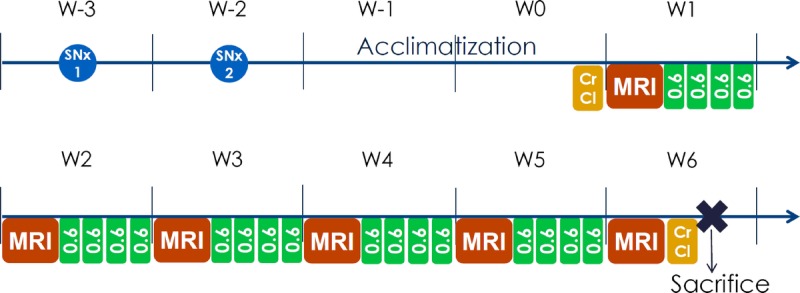
Protocol scheme of the study. SNx, subtotal nephrectomy of the 5/6 or sham operation; SNx 1 indicates first part of the surgery; SNx 2, second part of the surgery; CrCl, creatinine clearance. MRI was performed before the first injection, and then once a week (W). Twenty injections of gadodiamide, 0.6 mmol Gd/kg/injection, were distributed over 5 weeks, leading to a cumulative dose of 12 mmol Gd/kg. Killing was performed 6 days after the last injection.
The animals received 20 injections of 0.6 mmol Gd/kg (1.2 mL/kg) of gadodiamide (linear and nonionic GBCA, Omniscan, 500 mmol Gd/L; GE Healthcare, Chalfont St Giles, United Kingdom, batches 12691428 and 12824340) or 0.9% saline solution (CDM Lavoisier, Paris, France) (1.2 mL/kg) in control groups. The injections were intravenous performed in the tail vein once a day, 4 days a week for 5 weeks, under isoflurane anesthesia (IsoFlo; Axience, Pantin, France). The 0.6 mmol Gd/kg dose corresponds to the clinical dose (0.1 mmol Gd/kg) adjusted for the body surface area of the rat species, as specified in Food and Drug Administration guidelines.20 Endogenous creatinine clearance (CrCl) was calculated at the beginning (ie, 3 days before the first administration) and end of the study (ie, 5 days after the last injection) as according to the following formula:
Formula.

4.7 T MRI Protocol
Magnetic resonance imaging procedures were run once a week, using a dedicated phased-array quadrature head coil in a gradient/shims insert B-GA 12S HP (660 mT/m intensity and 4570 T/m/s maximum slew rate) on a 4.7 T preclinical magnet (Biospec 47/40, Bruker, Ettlingen, Germany). The first MRI was performed before the first injection, and subsequent MRI examinations were performed once a week (just before the first injection of the week, ie, 72 hours after the last injection of the previous week). An MRI examination consisted of a T1-weighted 2D FLASH (repetition time/echo time, 50/1.782 milliseconds; 48 averages; in-plane resolution, 164 × 164 μm2; slice thickness, 700 μm; acquisition time, 6 minutes 36 seconds; targeted only on the cerebellum [11 slices], and T1 mapping on the slice displaying the DCN), using a FAIR-RARE (flow-sensitive alternating inversion recovery–rapid acquisition with relaxation enhancement) sequence (repetition time/effective echo time, 36.9/2079.9 milliseconds; 4 averages; in-plane resolution, 164 × 164 μm2; slice thickness, 700 μm; acquisition time, 11 minutes 5 seconds), with 8 inversion times (0, 100, 200, 400, 600, 800, 1200, 2000 milliseconds).
Tissue Collection
Two days after the last MRI examination and the day after the last CrCl measurement (in week 6), an Irwin test was performed on the animals to check for substantial behavioral abnormalities. The animals were then anesthetized with a mix of ketamine-xylazine (67.5 mg/kg ketamine [Imalgene; Merial SAS, Lyon, France], 6.36 mg/kg xylazine [Rompun; Bayer Healthcare, Loos, France]) by intraperitoneal injection. The cerebrospinal fluid (CSF) was collected from the cisterna magna using a catheter according to Zarghami et al.21 Sublingual venous blood collection was performed, and the rats were then killed by exsanguination via the abdominal aorta, under isoflurane (overdose) anesthesia. The arterial blood was collected in 10 mL tubes with heparin, and the forebrain, cerebellum, parietal bone, and femur (epiphyses) were harvested and frozen at −20°C. The different brain structures were then dissected: the forebrain was divided into the cortical brain and the subcortical brain. Coronal sections through the cerebellum at 1 mm intervals were performed using a Brain Slicer Matrix (Stoelting Co, Wood Dale, IL). The DCN were carefully dissected from the cerebellar parenchyma (visually on cerebellum slices of 1 mm thick, with the help of the anatomic reference on the rat brain atlas).22 The brain stem was also collected.
Image Analysis
All image analyses were performed under blinded (for groups and time points) and randomized conditions. Both qualitative and quantitative evaluations of the DCN and the fourth ventricle (including the choroid plexus [CP]) T1 signal intensity were performed.
Qualitative Analysis of MR Examination Images
A blinded, qualitative evaluation of DCN enhancement was carried out by 4 different readers, blinded for the rat, group, and time point. A 3-point scoring scale for the DCN relative to adjacent areas was applied. A score of 0 was given for no enhancement in the DCN, 1 for doubtful enhancement, and 2 for definite enhancement. The mean score value was subsequently plotted for each reader.
Quantitative Analysis of MR Examination Images
Blinded quantitative analysis of the signal on randomized images was performed by positioning regions of interest (ROIs) in the different cerebellar structures: cerebellar parenchyma, brain stem, left and right DCN, and CP in the fourth ventricle.
Signal intensity was calculated as a ratio of the most visible of the 2 DCN zones a) to the cerebellar parenchyma signal (DCN-cerebellar parenchyma ratio) and b) to the brain stem signal (DCN-brain stem ratio). Signal intensity in the CP was calculated as a ratio of the lateral part of the CP of the fourth ventricle signal (the most visible) to the cerebellar parenchyma signal (CP-cerebellar parenchyma ratio).
R1 Mapping
R1 mapping was calculated on a pixel-by-pixel basis using an in-house developed software coded in MATLAB (The Mathworks Inc, Natick, MA), as described elsewhere.10
Determination of Total Gd Tissue Concentrations
Total Gd concentrations in the cortical brain, subcortical brain, cerebellar parenchyma, DCN, brain stem, CSF, plasma, femur, and parietal bone were determined by ICP-MS (inductively coupled plasma mass spectrometry) (7700x; Agilent Technologies, Santa Clara, CA) as described elsewhere,9 after sample mineralization in 65% nitric acid at 80°C for 8 hours. The lower limit of quantification (LLOQ) of Gd was 0.02 nmol/mL in plasma and CSF, 0.02 nmol/g in brain matrix, and 0.10 nmol/g in bone matrix. In the case of plasma, concentrations of Gd dissociated from its chelate (Gd3+) were determined according to Frenzel et al,23 by high pressure liquid chromatography (1260 Infinity Bioinerte; Agilent Technologies, Santa Clara, CA) equipped with a 1-mL Chelating Sepharose column (Hi-Trap, GE-Healthcare, Uppsala, Sweden), coupled to the ICP-MS system. The signal intensity of the 158Gd isotope was recorded and presented as a chromatogram. Dissociated Gd3+ was quantified against a calibration curve obtained with Gd nitrate ranging from 0.05 to 10 μM in rat plasma.
To calculate the means, standard deviations (SDs), and to run statistical tests, values less than LLOQ were arbitrarily replaced with LLOQ/2, and values less than limit of detection were replaced with 0. To have a sufficient amount of material for total Gd measurement, the DCN were pooled for each test group.
Statistical Analysis
Data are expressed as mean ± standard deviation (SD). Normality was assessed with the Shapiro-Wilk test or the Kolmogorov-Smirnov test, and homoscedasticity with Bartlett method.
Characterization of Renal Function
The Kruskal-Wallis test by ranks was performed, followed by Dunn multiple comparisons.
Qualitative Evaluation of T1 Enhancement in the DCN
A multinomial model was created, without 3-way interaction (group × reader × week). In case of significant 2-way interaction, pairwise comparisons were performed in both ways. P values were corrected with a Bonferroni-Holm adjustment, to control the family-wise error rate.
T1-Signal Changes in the Fourth Ventricle Including the CP
A 2-way analysis of variance (ANOVA) with repeated measures was then performed. If significant, Bonferroni method post-tests were applied on time for each group, and further unpaired t tests were used to compare the 2 groups in the same week.
Quantitative Evaluation of T1 Enhancement in the DCN
For each ratio, a mixed model was built with the factors group and week, and the interaction of both, to look for a potential significant difference between the groups. In the event of significant interaction, parameters were studied with pairwise comparisons, using a Tukey adjustment on generated P values.
R1 Mapping
A 1-way ANOVA was performed. If the effect was significant, Bonferroni multiple comparisons were performed.
Determination of Total Gd Concentrations in the Brain, Bones, and Plasma
A 1-way ANOVA was performed for each matrix. If the group effect was significant, pairwise comparisons were performed on all groups, with a Tukey adjustment on generated P values.
Correlation Between Tissue Gd Concentrations and Renal Function
A linear regression analysis was performed on all gadodiamide-treated rats, taken together or separated, with a logarithmic transformation if it fitted better, to find the best model.
All statistical tests were bilateral with a significance level equal to 5%, except for normality (1%). Analyses were performed either with SAS v9.4 (SAS, Cary, NC) or GraphPad Prism 4 (GraphPad Software Inc, La Jolla, CA).
RESULTS
At the beginning of the study, the body weight of SNx rats was significantly lower than that of sham rats (217 ± 9 g vs 232 ± 14, P < 0.01). Two animals did not complete the whole study. One rat from the saline + SNx group died during anesthesia at the first MRI examination, and one of the gadodiamide + SNx group died after 2 weeks of injections. In another rat from the gadodiamide + SNx group, skin lesions (a few localized scabs on the back skin) were observed.
Characterization of Renal Function
Figure 2 shows the mean of the CrCl values (determined before and after the injection period). A slight but statistically significant recovery in CrCl was observed in both SNx groups between the beginning and end of the study (respectively, saline + SNx: 0.19 ± 0.02 mL/min/100 g vs 0.24 ± 0.05 mL/min/100 g, P = 0.02; gadodiamide + SNx: 0.20 ± 0.08 mL/min/100 g vs 0.26 ± 0.09 mL/min/100 g, P = 0.002), whereas the CrCl of animals with normal renal function remained stable (saline sham: 0.49 ± 0.13 mL/min/100 g vs 0.51 ± 0.07 mL/min/100 g, P = 0.71 not significant [NS]; gadodiamide sham: 0.51 ± 0.18 mL/min/100 g vs 0.51 ± 0.20 mL/min/100 g, P = 0.85 [NS]). Subtotal nephrectomy resulted in a decrease in renal function by 63% ± 11% compared with the animals with normal renal function at the start of the study, the gap reduced to 53% ± 13% at the end of the study (week 6). Gadodiamide did not significantly impact CrCl compared with saline, in both the sham-operated (P = 0.35) and SNx groups (P = 0.47).
FIGURE 2.
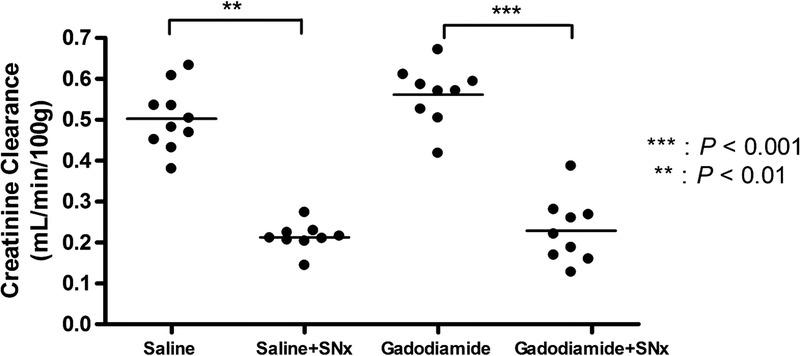
Individual CrCl values (mean of the 2 determinations) of the 4 different groups.
Qualitative Evaluation of T1 Enhancement in the DCN
Figure 3 shows typical images of the different groups at week 6 (last MRI examination). The 4 different blinded readers individually scored 228 randomized images (38 rats × 6 MRI examinations/rat). As an example, 1 qualitative scoring is presented in Figure 4. Overall, repeated administration of gadodiamide resulted in a significant score increase in the sham group compared with the saline sham group from week 5 (P < 0.01). In SNx rats, gadodiamide injections induced a significant score increase compared with saline from week 3 (P < 0.001). The score for the gadodiamide + SNx group was significantly increased compared with the gadodiamide sham group in weeks 4 and 5 (P < 0.01). Therefore, T1 signal enhancement was evidenced visually in the DCN of all gadodiamide-treated rats, and this effect was more obvious in SNx rats (from only 8 injections, corresponding to a cumulative dose of 4.8 mmol Gd/kg).
FIGURE 3.

Typical T1w MR images obtained at week 6 (1 rat per group). DCN T1 hypersignal was observed in the 2 gadodiamide groups (white arrows). ROI refer to DCN (green and red), cerebellar parenchyma (blue), and brain stem (yellow).
FIGURE 4.
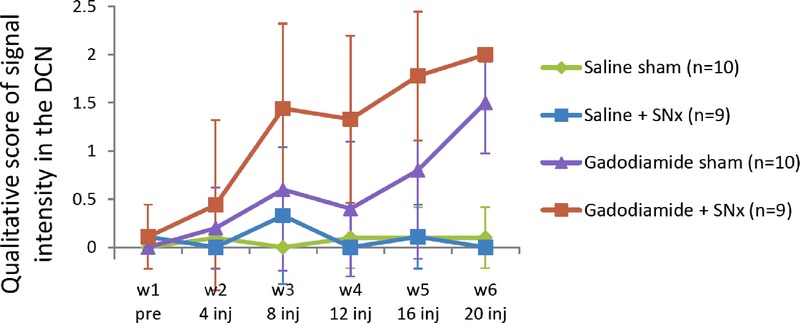
Typical qualitative blinded evaluation: temporal changes in T1w signal enhancement between the DCN and surrounding cerebellar parenchyma, over the course of the injections (week 1: before the first injection; week 6: after 20 injections) (values are mean ± SD).
Quantitative T1-Signal Changes in the Fourth Ventricle Including the CP
Eight of 9 animals from the gadodiamide + SNx group presented T1-enhancement in the fourth ventricle and the CP, occurring from 2 weeks of injections. Typical images of this specific enhancement are shown in Figure 5. The CP-brain stem and CP-cerebellar parenchyma ratios calculated at week 1 and 6 (ie, before and after the treatment period) for the gadodiamide + SNx and gadodiamide sham groups are presented in Figure 6. While before injection of gadodiamide, the CP-brain stem ratio was 0.82 ± 0.10 in SNx rats versus 0.84 ± 0.05 in sham rats (NS), this ratio increased after the injection period (P < 0.05 for the gadodiamide sham group, P < 0.001 for the gadodiamide + SNx rats). However, CP enhancement was significantly higher in SNx rats compared with sham rats after gadodiamide injections (ratio of 1.13 ± 0.10 vs 0.92 ± 0.06, P < 0.001). A similar observation was made in the CP-cerebellar parenchyma ratio, although there was no significant increase between week 1 and week 6 in sham rats (0.93 ± 0.05 vs 0.99 ± 0.06 [NS], compared with 0.91 ± 0.10 versus 1.25 ± 0.12 in SNx rats [P < 0.001]).
FIGURE 5.

A, Hypersignal in the choroid plexus (3 distinct areas) in the fourth ventricle of gadodiamide + SNx rats, in T1w MRI examinations performed in week 6, and (B) darkest blue areas are referred as choroid plexus (“chp”) of the fourth ventricle (“4 V”) in the Paxinos and Watson atlas, 2007 (Bregma, −11.88 mm). (Reproduced with permission from22.) C, ROI refer to choroid plexus of the fourth ventricle (red, blue, and green), cerebellar parenchyma (pink), and brain stem (yellow).
FIGURE 6.

Change in the choroid plexus/cerebellar parenchyma signal ratio and choroid plexus/brain stem signal ratio between week 1 and week 6 for gadodiamide sham (n = 10) and gadodiamide + SNx (n = 9) rats (mean + SD).
It should be noted that, in the SNx rat receiving gadodiamide which was found dead, the T1 hypersignal in the DCN and CP was visually evidenced after only 1 week of injection.
Quantitative Analysis of T1 Enhancement in the DCN
Quantitatively, no significant T1 signal changes were observed in both saline groups. In the gadodiamide-treated groups, a significant increase in the DCN-brain stem T1 signal ratio was shown after 3 weeks of injections in the gadodiamide sham group (W1 vs W4 to W6: P < 0.001; W2 vs W5 and W6: P < 0.001; W3 vs W5 and W6: P < 0.05) and after only 2 weeks of injections (ie, 1 week earlier) in the gadodiamide + SNx group (W1 vs W3 to W6: P < 0.001; W2 vs W3: P < 0.05; W2 vs W4 to W6: P < 0.001) (Fig. 7A). A similar effect was seen with the DCN/cerebellar parenchyma ratio (Fig. 7B) for the gadodiamide sham group from 3 weeks of injections, and for the gadodiamide + SNx group, leading to a higher ratio for this group compared with the other groups from 2 weeks of injections (because no significant effect was found for the interaction group × week, no further statistical tests were performed). Therefore, renal failure was associated with an earlier and greater increase in both ratios after gadodiamide administration.
FIGURE 7.

Evolution of DCN/cerebellar parenchyma and DCN/brain stem T1w signal ratio, over the course of the injections (mean ± SD). Statistical comparisons are described in the Results section.
R1 Mapping
Typical images of cerebellum and DCN R1 mapping are shown in Figure 8. At the end of the injection period, the R1 value in the DCN was significantly higher in the gadodiamide + SNx group compared with the saline sham and SNx group (Fig. 9): gadodiamide + SNx (1.39 ± 0.04 s−1) compared with the controls: saline sham (1.33 ± 0.02 s−1) and saline + SNx (1.34 ± 0.02 s−1) (P < 0.01); gadodiamide sham (1.37 ± 0.03 s−1) (NS vs all groups).
FIGURE 8.

Typical R1 mapping in week 6. An important R1 increase is evidenced in the DCN of gadodiamide-treated rats. However, a diffuse increase in R1 value is also observed in the cerebellar parenchyma and the brain stem.
FIGURE 9.
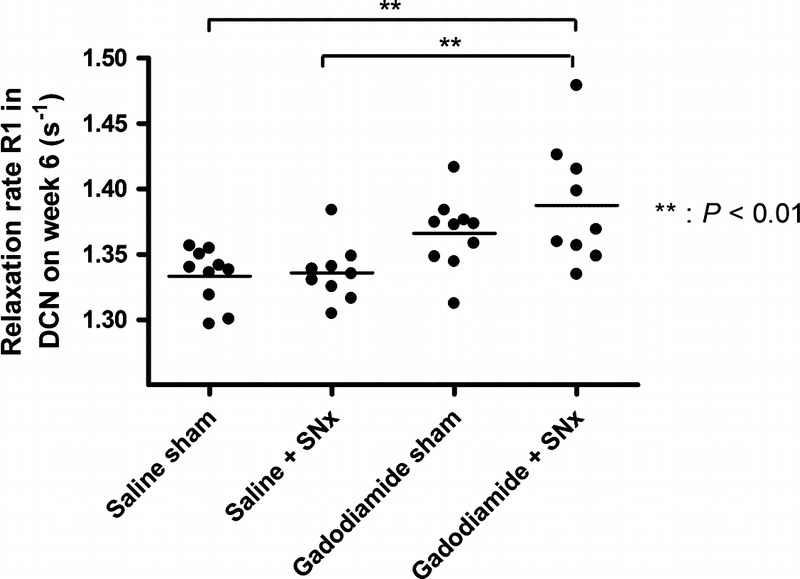
Relaxation rate R1 (s−1) determined in the DCN from T1 mapping performed at week 6.
Determination of Total Gd Concentrations in the Brain, Bones, and Plasma
For gadodiamide-treated rats, renal insufficiency resulted in increased total Gd concentrations in all the brain areas compared with the sham-operated control rats (cortical brain: 5.6 ± 1.5 vs 2.5 ± 0.3 nmol/g [P < 0.001]; subcortical brain: 7.5 ± 2.3 vs 3.4 ± 0.5 nmol/g [P < 0.001]; cerebellar parenchyma: 10 ± 2.8 vs 4.7 ± 0.5 nmol/g [P < 0.001]; brain stem: 5.1 ± 1.2 vs 2.6 ± 0.9 nmol/g [P < 0.001], and pooled DCN: 19.9 vs 12.3 nmol/g) (Fig. 10).
FIGURE 10.
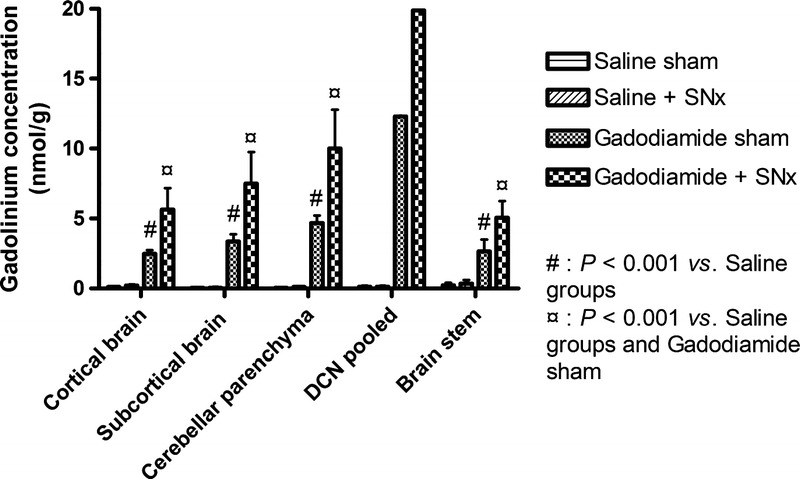
Gadolinium concentration determined by ICP-MS in the cortical and subcortical brain, cerebellar parenchyma, DCN (pooled by groups), and brain stem (mean ± SD). The Gd concentration in the gadodiamide + SNx group was significantly greater in all structures compared with the other groups (P < 0.001).
Total Gd concentration was determined in 2 different bones (femur and parietal bone) (Fig. 11). Renal insufficiency considerably increased the total Gd concentration in both bones (2.6 times in the parietal bone (134 ± 43 nmol/g vs 351 ± 97 nmol/g), and 2.8 times in the femur (185 ± 26 nmol/g vs 546 ± 171 nmol/g). No statistical test was performed versus the saline sham group because the total Gd concentrations were always below the limit of detection.
FIGURE 11.
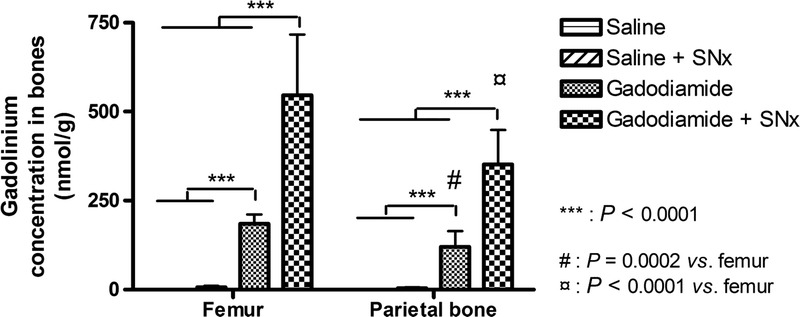
Gadolinium concentration in 2 different bones (mean ± SD).
Circulating Gd (determined in plasma) was still present 6 days after the last gadodiamide administration, in relatively low concentrations for animals with normal renal function (0.11 ± 0.04 nmol/mL) (P < 0.001 vs saline + SNx group), but at a higher concentration in SNx rats (0.85 ± 0.60 nmol/mL) (P < 0.001 vs all groups). Liquid chromatography inductively coupled plasma mass spectrometry measurements indicated that, in both gadodiamide-treated groups, 93.6% ± 18% of the circulating Gd in sham rats + gadodiamide and 85.0% ± 23% of the circulating Gd in SNx + gadodiamide were in soluble dissociated form (Fig. 12).
FIGURE 12.
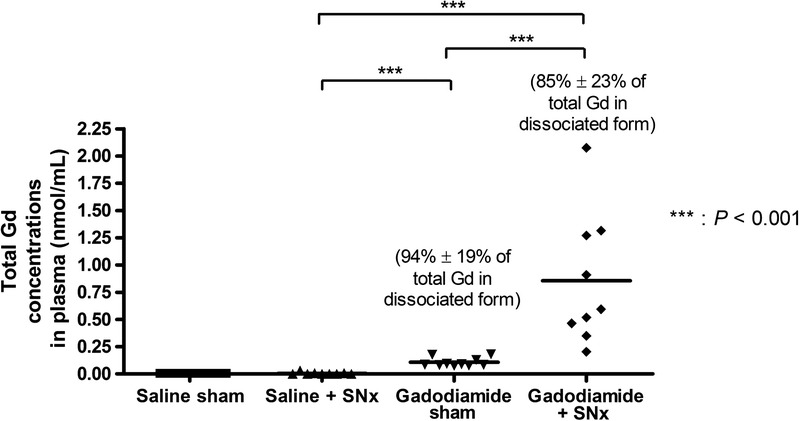
Total gadolinium concentration determined by ICP-MS in plasma collected 6 days after the last injection. Percentages (± SD) represent the proportion of dissociated Gd, determined by liquid chromatography inductively coupled plasma mass spectrometry.
For the CSF, in all samples that were not contaminated with blood (ie, 24 of 38 samples), a total Gd concentration lower than 0.05 nmol/mL was found. In blood-contaminated samples from gadodiamide treated groups, a total Gd concentration of up to 1.14 nmol/L was found.
Correlation Between Tissue Gd Concentrations and Renal Function
Correlations between CrCl (mean between W1 and W6) and tissue total Gd concentrations (Fig. 13) were determined in the gadodiamide-treated groups.
FIGURE 13.
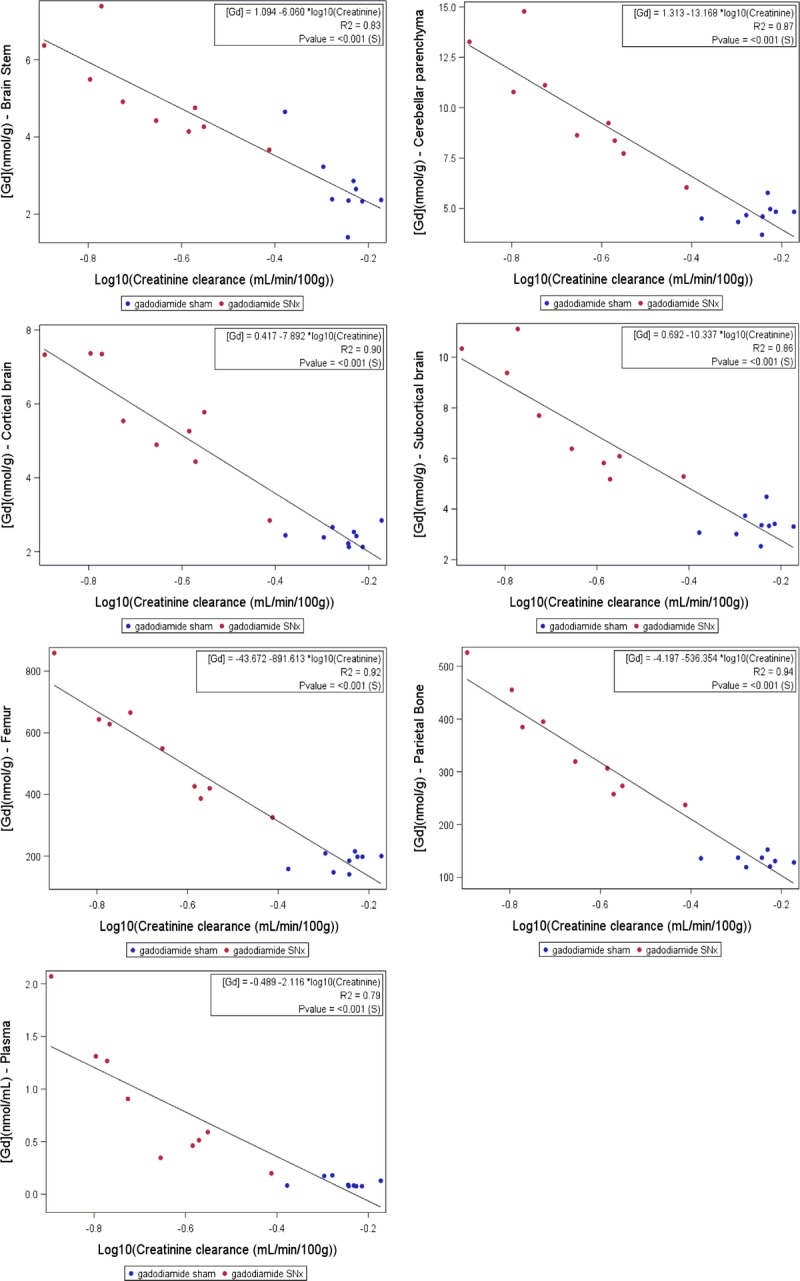
Logarithmic correlations between total Gd concentration in the studied tissues and CrCl.
In all cases, a significant correlation was found with renal function. The best regression model was obtained after logarithmic transformation of the data, according to the formula:
Formula.

The lower the CrCl, the higher the total Gd concentration in all tested tissues.
DISCUSSION
Under the conditions of the present study, repeated injections of a linear GBCA in rats with poor renal function significantly potentiated Gd brain uptake and T1 hypersignal in the DCN.
Impact of Renal Function on T1 Hypersignal
While prevented from contracting NSF due to health authorities' recommendations, the specific population with stage 1 to 3 CKD is widely represented in everyday clinical practice and is therefore worth studying.
With our model of subtotal nephrectomy, a mean decrease in CrCl of 58% ± 13% (which would roughly correspond to stage 3 CKD in humans) was found. However, CrCl values ranged from 0.39 mL/min/100 g (similar to normal renal function) to 0.13 mL/min/100 g (75% decrease compared with 0.56 ± 0.07 mL/min/100 g in the sham gadodiamide group). In our study, this wide range of CrCls allowed a realistic link to be established between renal function and brain uptake of Gd and also T1 signal enhancement.
Unlike another rat model of renal failure involving the addition of adenine in the diet,24 subtotal nephrectomy represents a consistent model for studying moderated CKD. On exactly the same model of subtotal nephrectomy, Pietsch et al25 determined Gd exposure after gadodiamide injection to be 3 times longer compared with healthy rats (area under the curve, 962.9 ± 245.4 mmol/L min in SNx rats vs 321.7 ± 53.9 mmol/L min in sham rats).
In both gadodiamide-treated groups, a significant T1 enhancement in the DCN was observed. This effect was significantly higher in the renally impaired group. The T1 effect in the gadodiamide sham group was significantly higher than that of the saline groups after 4 weeks of injections, whereas in the gadodiamide + SNx group, the effect was observed 2 weeks earlier. Quantitatively (for both the DCN-cerebellar parenchyma and DCN-brain stem T1 signal ratio), the same time evolution of T1-enhancement was observed. We could speculate that the delay in T1 effect observed in the gadodiamide sham group versus the gadodiamide + SNx group reflects a delay in DCN Gd concentration. The 2-week interval in DCN T1 signal enhancement observed between gadodiamide + SNx and gadodiamide sham groups is also consistent with the pharmacokinetic profiles of gadodiamide in sham and SNx rats.25 For the gadodiamide + SNx group, a wide variance was measured, but this value is assumed to be the result of the CrCl heterogeneity in this group.
Reference Tissue for T1 Enhancement
The relevance of the T1 DCN ratio versus the cerebellar parenchyma or the brain stem could be disputed owing to the nonnegligible concentrations of total Gd found in these areas. However, none of the measured tissues was found to be Gd-free, therefore there was no rigorous reference structure. Under our conditions, a slightly higher increase in the T1 signal was observed in both gadodiamide-treated groups over time in the cerebellar parenchyma compared with the brain stem (data not shown). Therefore, the DCN-brain stem and CP-brain stem ratios may be more reliable. Total Gd concentrations found in the gadodiamide sham group were consistent with those reported by Robert et al,9,10 whereas in these studies, the killing was performed 3 weeks later, suggesting no washout effect during this 3-week period. Overall, total Gd concentrations are doubled in the case of renal failure (ratios of 1.6 in the DCN, 1.9 in the brain stem, 2.1 in the cerebellar parenchyma, 2.3 in the cortical and subcortical brain), suggesting that Gd exposure in moderately renally impaired rats is twice that of a healthy control population, for the same GBCA dose. Furthermore, in our study, the pooled DCN-brain stem Gd concentration ratio was 4.7 in gadodiamide sham rats compared with 4.1 in gadodiamide + SNx rats, that is, a similar ratio. The total Gd concentration ratios for the pooled DCN-cerebellar parenchyma were, respectively, 2.6 and 2.1. This is consistent with a similar relative distribution of total Gd respective to these brain structures.
The quantification of the R1 relaxation rate in DCN (Fig. 9) prevents from standardization by a reference region, potentially containing Gd, to calculate the signal intensity ratio. This analysis confirms the aforementioned observations.
Interestingly, circulating Gd was still found 6 days after the last administration, notably in the renally impaired group. It is worth noting that almost all circulating Gd was in dissociated form (Fig. 12), which supports the hypothesis of in vivo dissociation of the nonionic LGBCA gadodiamide. A similar effect has already been reported in renally impaired rats treated with the same compound.14
Impact of Renal Function on Gd Concentration
For gadodiamide-treated rats, renal insufficiency resulted in a 2-fold increased total Gd concentration in the brain structures compared with those from sham rats. A longer washout period after completion of GBCAs administration would allow investigating whether the large difference in the Gd tissue concentration between healthy and 5/6 nephrectomized rats subsists.
Renal failure also substantially increased the total Gd concentration in bone tissue. The concentration ratio between SNx and sham gadodiamide-treated rats was 2.6 in the parietal bone and 3.0 in the femoral bone. It is widely acknowledged that bone tissue is a deep compartment for Gd storage.26–28 The form in which Gd is stored in bone tissue remains unclear. Some authors suggest that Gd binds to hydroxyapatite,27,29 a major component of the cortical bone tissue. Alternatively, Gd may be preferentially trapped in the bone marrow.28,30 In our study, the Gd concentration was found to be higher in the femoral bone than in the tested flat bone, the latter being rich in bone marrow. However, we cannot conclude that there is preferential storage in the cortical bone because only femoral epiphyses were sampled.
Discrepancy Between Gd Concentration in the Cerebellar Parenchyma and T1w MR Signal
Basically, several hypotheses can be proposed after gadodiamide administration: (a) Gd remains in chelated form and gadodiamide is sequestrated in the tissue; (b) gadodiamide releases dissociated and soluble Gd. In such case, Gd would be associated with a macromolecule, inducing an even greater T1 effect31; or (c) Gd is in a dissociated, insoluble form. In the latter case, no obvious T1 effect would be expected.14,32 Of course, these possibilities are qualitatively not self-excluding. However, in the DCN, the insoluble Gd form is unlikely to be the predominant form.
The presence of Gd in the cerebellar parenchyma (notably the granular layer) at a similar concentration to the DCN has recently been found using LA-ICP-MS.33 In our study, total Gd concentrations in the cerebellar parenchyma were 4.7 ± 0.5 nmol/g and 10.0 ± 2.8 nmol/g in the sham and SNx gadodiamide-treated groups, respectively. However, no T1 enhancement was observed, unlike in the DCN. This may suggest that intratissue Gd is sequestrated in the cerebellar parenchyma in a different form, without associated T1 effect.
Location of Hypersignal in the CP
When the CSF was not contaminated by blood during the sampling procedure (ie, 24 of 38 samples), total Gd concentrations were lower than 0.05 μmol/L, 6 days after the last injection, whereas T1 enhancement was still evident in the fourth ventricle 4 days after the last injection. This suggests that the T1 enhancement was associated with the CP, and not the CSF itself. Furthermore, CSF turnover in rats is very short: it is renewed 11 times a day in 3-month-old rats compared with 3 to 4 times a day in humans.34 T1 enhancement in the CP (in addition to GP and DN enhancement) was recently observed in hemodialyzed patients.19 Our data strengthen the possibility that, with renal failure (ie, in the case of an increased exposure to LGBCA), Gd may also be trapped in the CP, in a form that leads to a T1 effect. This tissue is well known for sequestering toxic heavy metals and metalloid ions.35 It is therefore assumed that Gd can cross the blood-cerebrospinal barrier, which would represent a passageway to the adjacent interstitium, as seen for “general toxicants” such as mercury, cadmium, or arsenic.35 Indeed, tight junctions of the blood-CSF barrier are more permeable than those of the blood-brain barrier.36,37 Moreover, Jost et al38 recently demonstrated T1 enhancement in the CSF 1 minute after a single injection of all categories of GBCAs in rats, and Naganawa et al39 reported T1 enhancement in the CSF after injection of a single dose of gadoteridol in healthy volunteers, from 1.5 hours postinjection, increasing until 3 hours postinjection, and then slowly decreasing. The DCN are adjacent to the CP of the fourth ventricle and are particularly rich in metals such as iron, copper, and zinc.40,41 It could be speculated that, because GBCAs (all of them) may enter to the CSF through a transportation from CP, the local accumulation in the DCN (which are in the vicinity of the CP) in the case of LGBCAs with poor thermodynamic stabilities, would be the result of a competition between local endogenous metals and Gd.12
Alternatively, renal impairment has been shown to increase the permeability of and active transports across the blood-brain barrier, including the blood-cerebrospinal fluid barrier.42,43 It may therefore be speculated that this phenomenon plays a role by potentiating the GBCA access to the brain interstitium.
Clinical Consequences of Brain Gd Retention
In the case of severe kidney disease, T1 enhancement in the CSF has been found to be associated with confusion and cognitive disorders.44–46 In 3 patients with impaired renal function and vascular calcification (2 with confirmed NSF), unenhanced T1-weighted MRIs showed a high signal intensity in the dentate nucleus and the GP after they had been repeatedly exposed to LGBCAs. Interestingly, all 3 patients had transient signs of neurological disorders of undetermined cause.18
The cerebellum is an important target for many toxicants, including metals.47 No overt behavioral abnormalities were observed under our experimental conditions. It is worth noting that no in-depth neurocognitive investigation was performed in this study and that the animals were killed shortly after the last administration. Because total Gd measurements were performed in the brain areas, no tissue was available for histological analysis. In-depth neurotoxicological studies are therefore warranted to investigate the risk associated with brain GBCA uptake.
Interestingly, the animal that died after only 2 weeks of injections presented the worst renal function at the beginning of the study (0.09 mL/min/100 g), and barely gained any bodyweight compared with the others. In this case, death could be the result of excessive renal insufficiency, independent from the gadodiamide injections. Indeed, the MRI examination performed after 1 week of injections already showed T1 signal enhancement in the DCN and CP. Furthermore, the animal that had skin lesions at the end of the study had the second worst renal function.
When the CrCl values of both gadodiamide-treated groups were analyzed together as a continuum, the total Gd concentrations in the brain structures were correlated to the renal function. The poorer the renal function, the more sensitized the subject, suggesting an accelerated Gd uptake in the tissues. A recent study in renally impaired mice concluded that renal failure, while increasing short-term retention of Gd in most organs (such as the liver, spleen, bones, and kidneys), did not affect brain retention.48 These results are not consistent with our data. The discrepancy may be ascribed to differences in the experimental models. Notably, an 8-fold higher cumulated dose was administrated compared with our study. Taking into account the body surface area normalization for converting doses (rat: x6, mouse: x12 compared with the human dose),20 this would correspond to a 4-fold higher cumulated dose. This may attenuate the impact of renal failure on Gd brain concentrations. In a subsequent study with the same protocol, the same team demonstrated that, in the various brain areas of both renally impaired and naive mice treated with gadodiamide, the Gd clearance was limited over the time.49
It is generally reported that T1 signal enhancement may occur in the DCN and GP of patients who received repeated administrations of LGBCAs and have normal renal function.2 Few studies have focused on patients with renal failure. Daily clinical practice sees a substantial population of patients with moderate renal failure.17 Health authorities guidelines strictly contraindicate gadodiamide in patients with an estimated GFR below 30 mL/mn/1.73 m2 and recommend that estimated GFR must be systematically measured in all gadodiamide-treated patients.15,16 It may be speculated that these rules are not systematically followed in daily practice, as shown in recent studies.50,51
Future studies will compare the various molecular categories of GBCAs in renally impaired rats. In-depth neurotoxicological studies are also needed to identify the clinical consequences of Gd deposits in the brain.
In conclusion, our results indicate that renal impairment substantially increases T1 signal enhancement in the DCN and tissue total Gd concentrations in gadodiamide chronically treated rats. Our data suggest that underlying poor renal function may increase the risk of brain (and other tissues) uptake of Gd in a form that remains to be elucidated. Our results advocate for a special warning in patients with moderate CKD treated with gadodiamide.
ACKNOWLEDGMENTS
The authors thank Cecile Factor, PhD, Gaëlle Jestin-Meyer, BS, and Izabela Strzeminska, MS, for the Gd determination in tissues; Claire Delannoy, PhD, Soladis for the statistical study; and Sonya Mountford-Jones, PhD, for reviewing the English language. The authors are grateful to Jean-Sebastien Raynaud, PhD, Mario Manto, MD, PhD, Jean-Luc Guerquin-Kern, PhD, and Sergio Marco, PhD, for the helpful discussions.
Footnotes
Conflicts of interest and sources of funding: All authors are employees of Guerbet.
REFERENCES
- 1.Kanda T, Ishii K, Kawaguchi H, et al. High signal intensity in the dentate nucleus and globus pallidus on unenhanced T1-weighted MR images: relationship with increasing cumulative dose of a gadolinium-based contrast material. Radiology. 2014;270:834–841. [DOI] [PubMed] [Google Scholar]
- 2.Errante Y, Cirimele V, Mallio CA, et al. Progressive increase of T1 signal intensity of the dentate nucleus on unenhanced magnetic resonance images is associated with cumulative doses of intravenously administered gadodiamide in patients with normal renal function, suggesting dechelation. Invest Radiol. 2014;49:685–690. [DOI] [PubMed] [Google Scholar]
- 3.Weberling LD, Kieslich PJ, Kickingereder P, et al. Increased signal intensity in the dentate nucleus on unenhanced T1-weighted images after gadobenate dimeglumine administration. Invest Radiol. 2015;50:743–748. [DOI] [PubMed] [Google Scholar]
- 4.Runge VM. Safety of the gadolinium-based contrast agents for magnetic resonance imaging, focusing in part on their accumulation in the brain and especially the dentate nucleus. Invest Radiol. 2016;51:273–279. [DOI] [PubMed] [Google Scholar]
- 5.Geenen RWF, Krestin GP. Non-tissue specific MR contrast media. In: Thomsen HS, ed. Contrast Media. Safety Issues and ESUR Guidelines. Berlin, Hedeilberg, New York: Springer; 2006:107–120. [Google Scholar]
- 6.McDonald RJ, McDonald JS, Kallmes DF, et al. Intracranial gadolinium deposition after contrast-enhanced MR imaging. Radiology. 2015;275:772–782. [DOI] [PubMed] [Google Scholar]
- 7.Food and Drug Administration. FDA Drug Safety Communication: FDA evaluating the risk of brain deposits with repeated use of gadolinium-based contrast agents for magnetic resonance imaging (MRI). July 27, 2015. Available at: http://www.fda.gov/Drugs/DrugSafety/ucm455386.htm. Accessed July 14, 2016.
- 8.European Medicine Agency. PRAC List of Questions. Procedure No. EMEA/H/A-31/1437. Available at: http://www.ema.europa.eu/docs/en_GB/document_library/Referrals_document/gadolinium_contrast_agents_31/Procedure_started/WC500203485.pdf. Accessed July 14, 2016.
- 9.Robert P, Lehericy S, Grand S, et al. T1-Weighted hypersignal in the deep cerebellar nuclei after repeated administrations of gadolinium-based contrast agents in healthy rats: difference between linear and macrocyclic agents. Invest Radiol. 2015;50:473–480. [DOI] [PMC free article] [PubMed] [Google Scholar]
- 10.Robert P, Violas X, Grand S, et al. Linear gadolinium-based contrast agents are associated with brain gadolinium retention in healthy rats. Invest Radiol. 2016;51:73–82. [DOI] [PMC free article] [PubMed] [Google Scholar]
- 11.Grobner T. Gadolinium—a specific trigger for the development of nephrogenic fibrosing dermopathy and nephrogenic systemic fibrosis? Nephrol Dial Transplant. 2006;21:1104–1108. [DOI] [PubMed] [Google Scholar]
- 12.Port M, Idée JM, Medina C, et al. Efficiency, thermodynamic and kinetic stability of marketed gadolinium chelates and their possible clinical consequences: a critical review. Biometals. 2008;21:469–490. [DOI] [PubMed] [Google Scholar]
- 13.Idée JM, Port M, Dencausse A, et al. Involvement of gadolinium chelates in the mechanism of nephrogenic systemic fibrosis: an update. Radiol Clin North Am. 2009;47:855–869. [DOI] [PubMed] [Google Scholar]
- 14.Fretellier N, Idée JM, Dencausse A, et al. Comparative in vivo dissociation of gadolinium chelates in renally impaired rats: a relaxometry study. Invest Radiol. 2011;46:292–300. [DOI] [PubMed] [Google Scholar]
- 15.European Medicine Agency. Assessment report for Gadolinium-containing contrast agents. Procedure No. EMEA/H/A-31/1097. July 1, 2010. Available at: http://www.ema.europa.eu/docs/en_GB/document_library/Referrals_document/gadolinium_31/WC500099538.pdf Accessed July 14, 2016.
- 16.Food and Drug Administration. FDA Drug Safety Communication: New warnings for using gadolinium based contrast agents in patients with kidney dysfunction. October 9, 2010. Available at: http://www.fda.gov/Drugs/DrugSafety/ucm223966.htm. Accessed July 14, 2016.
- 17.Duru OK, Vargas RB, Kermah D, et al. High prevalence of stage 3 chronic kidney disease in older adults despite normal serum creatinine. J Gen Intern Med. 2009;24:86–92. [DOI] [PMC free article] [PubMed] [Google Scholar]
- 18.Barbieri S, Schroeder C, Froehlich JM, et al. High signal intensity in dentate nucleus and globus pallidus on unenhanced T1-weighted MR images in three patients with impaired renal function and vascular calcification. Contrast Media Mol Imaging. 2016;11:245–250. [DOI] [PMC free article] [PubMed] [Google Scholar]
- 19.Cao Y, Zhang Y, Shih G, et al. Effect of renal function on gadolinium-related signal increases on unenhanced T1-weighted brain magnetic resonance imaging. Invest Radiol. 2016;51:677–682. [DOI] [PubMed] [Google Scholar]
- 20.Food and Drug Administration. US Department of Health and Human Services. Center for Drug Evaluation and Research. Guidance for Industry. Estimating the maximum safe starting dose in initial clinical trials for therapeutics in adult healthy volunteers. July 6, 2005. Available at: http://www.fda.gov/downloads/Drugs/.../Guidances/UCM078932.pdf. Accessed October 3, 2016.
- 21.Zarghami A, Alinezhad F, Pandamooz S, et al. A modified method for cerebrospinal fluid collection in anesthetized rat and evaluation of the efficacy. Int J Mol Cell Med. 2013;2:97–98. [PMC free article] [PubMed] [Google Scholar]
- 22.Paxinos G, Watson C. The Rat Brain in Stereotaxic Coordinates. Academic Press; 2007. [DOI] [PubMed] [Google Scholar]
- 23.Frenzel T, Lengsfeld P, Schirmer H, et al. Stability of gadolinium-based magnetic resonance imaging contrast agents in human serum at 37 degrees C. Invest Radiol. 2008;43:817–828. [DOI] [PubMed] [Google Scholar]
- 24.Fretellier N, Bouzian N, Parmentier N, et al. Nephrogenic systemic fibrosis-like effects of magnetic resonance imaging contrast agents in rats with adenine-induced renal failure. Toxicol Sci. 2013;131:259–270. [DOI] [PubMed] [Google Scholar]
- 25.Pietsch H, Lengsfeld P, Steger-Hartmann T, et al. Impact of renal impairment on long-term retention of gadolinium in the rodent skin following the administration of gadolinium-based contrast agents. Invest Radiol. 2009;44:226–233. [DOI] [PubMed] [Google Scholar]
- 26.Hirano S, Suzuki KT. Exposure, metabolism, and toxicity of rare earths and related compounds. Environ Health Perspect. 1996;104(suppl 1):85–95. [DOI] [PMC free article] [PubMed] [Google Scholar]
- 27.Vidaud C, Bourgeois D, Meyer D. Bone as target organ for metals: the case of f-elements. Chem Res Toxicol. 2012;25:1161–1175. [DOI] [PubMed] [Google Scholar]
- 28.Lancelot E. Revisiting the pharmacokinetic profiles of gadolinium-based contrast agents: differences in long-term biodistribution and excretion. Invest Radiol. 2016;51:691–700. [DOI] [PubMed] [Google Scholar]
- 29.Thakral C, Alhariri J, Abraham JL. Long-term retention of gadolinium in tissues from nephrogenic systemic fibrosis patient after multiple gadolinium-enhanced MRI scans: case report and implications. Contrast Media Mol Imaging. 2007;2:199–205. [DOI] [PubMed] [Google Scholar]
- 30.Drel VR, Tan C, Barnes JL, et al. Centrality of bone marrow in the severity of gadolinium-based contrast-induced systemic fibrosis. FASEB J. 2016;30:3026–3038. [DOI] [PMC free article] [PubMed] [Google Scholar]
- 31.Rowe PS, Zelenchuk LV, Laurence JS, et al. Do ASARM peptides play a role in nephrogenic systemic fibrosis? Am J Physiol Renal Physiol. 2015;309:F764–F769. [DOI] [PMC free article] [PubMed] [Google Scholar]
- 32.Laurent S, Elst LV, Copoix F, et al. Stability of MRI paramagnetic contrast media: a proton relaxometric protocol for transmetallation assessment. Invest Radiol. 2001;36:115–122. [DOI] [PubMed] [Google Scholar]
- 33.Lohrke J, Frisk AL, Frenzel T, et al. Gadolinium deposition in skin and brain after multiple, extended doses of linear and macrocyclic gadolinium chelates in rats. RSNA (Radiological Society of North America); 101th Scientific Assembly and Annual Meeting; Chicago November 29th-December 4th 2015; abstract n.NR338-SD-TUA7. [Google Scholar]
- 34.Johanson CE, Duncan JA, 3rd, Klinge PM, et al. Multiplicity of cerebrospinal fluid functions: New challenges in health and disease. Cerebrospinal Fluid Res. 2008;5:10. [DOI] [PMC free article] [PubMed] [Google Scholar]
- 35.Zheng W. Toxicology of choroid plexus: special reference to metal-induced neurotoxicities. Microsc Res Tech. 2001;52:89–103. [DOI] [PMC free article] [PubMed] [Google Scholar]
- 36.Nau R, Sörgel F, Eiffert H. Penetration of drugs through the blood-cerebrospinal fluid/blood-brain barrier for treatment of central nervous system infections. Clin Microbiol Rev. 2010;23:858–883. [DOI] [PMC free article] [PubMed] [Google Scholar]
- 37.Liddelow SA. Development of the choroid plexus and blood-CSF barrier. Front Neurosci. 2015;9:32. [DOI] [PMC free article] [PubMed] [Google Scholar]
- 38.Jost G, Lenhard DC, Sieber MA, et al. Signal increase on unenhanced T1-weighted images in the rat brain after repeated, extended doses of gadolinium-based contrast agents: comparison of linear and macrocyclic agents. Invest Radiol. 2016;51:83–89. [DOI] [PMC free article] [PubMed] [Google Scholar]
- 39.Naganawa S, Suzuki K, Yamazaki M, et al. Serial scans in healthy volunteers following intravenous administration of gadoteridol: time course of contrast enhancement in various cranial fluid spaces. Magn Reson Med Sci. 2014;13:7–13. [DOI] [PubMed] [Google Scholar]
- 40.Popescu BF, Robinson CA, Rajput A, et al. Iron, copper, and zinc distribution of the cerebellum. Cerebellum. 2009;8:74–79. [DOI] [PubMed] [Google Scholar]
- 41.Koeppen AH, Ramirez RL, Yu D, et al. Friedreich's ataxia causes redistribution of iron, copper, and zinc in the dentate nucleus. Cerebellum. 2012;11:845–860. [DOI] [PMC free article] [PubMed] [Google Scholar]
- 42.Fishman RA. Permeability changes in experimental uremic encephalopathy. Arch Intern Med. 1970;126:835–837. [PubMed] [Google Scholar]
- 43.Hosoya K, Tachikawa M. Roles of organic anion/cation transporters at the blood-brain and blood-cerebrospinal fluid barriers involving uremic toxins. Clin Exp Nephrol. 2011;15:478–485. [DOI] [PubMed] [Google Scholar]
- 44.Rai AT, Hogg JP. Persistence of gadolinium in CSF: a diagnostic pitfall in patients with end-stage renal disease. AJNR Am J Neuroradiol. 2001;22:1357–1361. [PMC free article] [PubMed] [Google Scholar]
- 45.Maramattom BV, Manno EM, Wijdicks EF, et al. Gadolinium encephalopathy in a patient with renal failure. Neurology. 2005;64:1276–1278. [DOI] [PubMed] [Google Scholar]
- 46.Hui FK, Mullins M. Persistence of gadolinium contrast enhancement in CSF: a possible harbinger of gadolinium neurotoxicity? AJNR Am J Neuroradiol. 2009;30:E1. [DOI] [PMC free article] [PubMed] [Google Scholar]
- 47.Manto M. Toxic agents causing cerebellar ataxia. In: Subramony SH, Dürr A, eds. Handbook of Clinical Neurology. Ataxic Disorders. Vol. 103 3rd Series. Edinburgh, Scotland: Elsevier BV; 2012;201–213. [DOI] [PubMed] [Google Scholar]
- 48.Kartamihardja AA, Nakajima T, Kameo S, et al. Impact of impaired renal function on gadolinium retention after administration of gadolinium-based contrast agents in a mouse model. Invest Radiol. 2016;51:655–660. [DOI] [PubMed] [Google Scholar]
- 49.Kartamihardja AA, Nakajima T, Kameo S, et al. Distribution and clearance of retained gadolinium in the brain: differences between linear and macrocyclic gadolinium based contrast agents in a mouse model. Br J Radiol. 2016;89:20160509. [DOI] [PMC free article] [PubMed] [Google Scholar]
- 50.Rees O, Agarwal SK. Nephrogenic systemic fibrosis: UK survey of the use of gadolinium-based contrast media. Clin Radiol. 2010;65:636–641. [DOI] [PubMed] [Google Scholar]
- 51.Snaith B, Harris MA, Clarke R. Screening prior to gadolinium base contrast agent administration: a UK survey of guideline implementation and adherence. Radiography. 2016. [Epub ahead of print.]. [Google Scholar]


