eLife logoLink to eLife
. 2017 Mar 14;6:e24746. doi: 10.7554/eLife.24746

Kinesin-4 KIF21B is a potent microtubule pausing factor

Wilhelmina E van Riel 1,, Ankit Rai 1,, Sarah Bianchi 2,, Eugene A Katrukha 1, Qingyang Liu 1, Albert JR Heck 3, Casper C Hoogenraad 1, Michel O Steinmetz 2, Lukas C Kapitein 1, Anna Akhmanova 1,*
Editor: Samara L Reck-Peterson4
PMCID: PMC5383399  PMID: 28290984

Abstract

Microtubules are dynamic polymers that in cells can grow, shrink or pause, but the factors that promote pausing are poorly understood. Here, we show that the mammalian kinesin-4 KIF21B is a processive motor that can accumulate at microtubule plus ends and induce pausing. A few KIF21B molecules are sufficient to induce strong growth inhibition of a microtubule plus end in vitro. This property depends on non-motor microtubule-binding domains located in the stalk region and the C-terminal WD40 domain. The WD40-containing KIF21B tail displays preference for a GTP-type over a GDP-type microtubule lattice and contributes to the interaction of KIF21B with microtubule plus ends. KIF21B also contains a motor-inhibiting domain that does not fully block the interaction of the protein with microtubules, but rather enhances its pause-inducing activity by preventing KIF21B detachment from microtubule tips. Thus, KIF21B combines microtubule-binding and regulatory activities that together constitute an autonomous microtubule pausing factor.

DOI: http://dx.doi.org/10.7554/eLife.24746.001

Research Organism: Human

eLife digest

Microtubules are tiny tubes that cells use as rails to move various cell compartments and structures to different locations within the cell. They are made of building blocks called tubulin and form extensive networks across the cell. Depending on the cell’s needs, microtubule networks can be rapidly assembled and disassembled by adding or removing tubulin subunits at the ends of individual microtubules. While a lot is known about how cells regulate the growth and shrinkage of microtubules, much less is known about the factors that can pause these processes and thus stabilize a microtubule.

Proteins belonging to the kinesin family are molecular motors that can walk along microtubules and control how microtubules grow and shrink. A kinesin known as KIF21B is found in several types of cells including neurons and immune cells and genetic alterations in this protein have been linked with several neurodegenerative diseases. KIF21B is made up of three regions: a motor domain, a stalk and a tail domain that binds to microtubules. Recent studies have suggested that this kinesin affects the ability of one end of microtubules (known as the plus end) to grow.

Here, van Riel, Rai, Bianchi et al. used a biochemical approach to investigate the activity of KIF21B. The experiments show that KIF21B can walk to the plus end of microtubules and efficiently pause growth. Small numbers of KIF21B molecules are enough to inhibit microtubule growth and this activity depends on the motor domain and the tail domain of KIF21B working together. These experiments were performed a cell-free system and so the next challenge is to investigate how KIF21B works in living cells, including neurons and immune cells.

DOI: http://dx.doi.org/10.7554/eLife.24746.002

Introduction

The organization and function of microtubule (MT) networks critically depend on the dynamic instability of MTs – their ability to spontaneously switch between phases of growth and shrinkage (Desai and Mitchison, 1997). This MT behavior can be reconstituted in vitro using purified tubulin. In cells, numerous MT-associated proteins (MAPs) modulate the dynamic instability of MTs by controlling specific phases of MT dynamics. MAPs can accelerate MT polymerization, decorate and stabilize MTs, promote switching between growth and shortening (catastrophes), or induce reverse transitions (rescues). Many of these activities have been reconstituted in vitro in systems with purified components (Akhmanova and Steinmetz, 2015; Gardner et al., 2013). Importantly, the plus ends of MTs growing from purified tubulin in vitro typically undergo sharp transitions between growth and shortening, while in cells MT plus ends often exist in a paused state. This difference is due to the presence of cellular factors that can dampen or even block MT dynamics, but the nature of these factors and the molecular mechanisms underlying their activity are still poorly understood.

Proteins controlling MT dynamics can be broadly divided into molecular motors and MAPs that lack motor activity. The two types of MT-dependent motors, kinesins and dyneins, can both interact with MT ends to affect their dynamics (Hu et al., 2015; Laan et al., 2012; Su et al., 2012; Walczak et al., 2013). Amongst the kinesins, very different modes of regulation of MT polymerization have been reported. For example, the kinesin-13 family members have a centrally located motor domain, are immotile and use the energy of ATP hydrolysis to modify the structure of MT ends, induce catastrophes and enhance depolymerization (Moores and Milligan, 2006; Walczak et al., 2013). Kinesin-8 family members have an N-terminal motor domain and can move processively to the plus ends where they induce MT disassembly or suppress MT dynamics (Gardner et al., 2008; Stumpff et al., 2011; Su et al., 2012).

Another family of MT-regulating kinesins is kinesin-4. The best-studied family member, KIF4/Xklp1, reduces the MT growth rate and suppresses catastrophes (Bieling et al., 2010; Bringmann et al., 2004). During mitosis, KIF4/Xklp1 binds to PRC1, a potent anti-parallel MT bundler involved in the formation of the central spindle (Kurasawa et al., 2004; Zhu and Jiang, 2005). The complex of KIF4/Xklp1 and PRC1 accumulates at MT ends and strongly inhibits MT elongation (Bieling et al., 2010; Subramanian et al., 2013). Another kinesin-4 family member, KIF7, is immotile; it participates in organizing the tips of ciliary MTs by reducing the MT growth rate and promoting catastrophes (He et al., 2014).

Other members of the kinesin-4 family are the two large motors KIF21A and KIF21B. KIF21A has been studied quite extensively, because point mutations in this protein cause a dominant eye movement syndrome, Congenital Fibrosis of the Extraocular Muscles type 1 (CFEOM1) (Heidary et al., 2008; Yamada et al., 2003). KIF21A is ubiquitously expressed, but the pathology in patients is associated with a specific defect in the development of the oculomotor nerve, likely due to a perturbation of axon guidance (Cheng et al., 2014; Heidary et al., 2008). In vitro, the KIF21A motor domain behaves similarly to that of Xklp1 – it reduces the MT growth rate and suppresses catastrophes (van der Vaart et al., 2013). There are also indications that in addition to controlling MT dynamics, KIF21A plays a role in membrane transport (Lee et al., 2012). All CFEOM1-associated mutations in KIF21A localize either to the motor domain or to a predicted short coiled-coil domain in the stalk region of the molecule, and each of them prevents the autoinhibitory interaction between these two elements (Bianchi et al., 2016; Cheng et al., 2014; van der Vaart et al., 2013). The dominant character of the CFEOM1 syndrome is thus connected to the increased activity of the mutant KIF21A kinesin caused by the loss of autoinhibition (Cheng et al., 2014; van der Vaart et al., 2013).

KIF21A and KIF21B are highly similar in sequence: they both contain an N-terminal motor domain followed by a stalk with several predicted coiled coils and a C-terminal WD40 domain (Marszalek et al., 1999). KIF21B has been reported to be expressed in brain, eye and spleen and to be enriched in dendrites of neurons (Marszalek et al., 1999). Polymorphisms in the KIF21B gene have been associated with multiple sclerosis and other inflammatory disorders (Anderson et al., 2009; Barrett et al., 2008; Goris et al., 2010; Yang et al., 2015). An increase in expression of KIF21B was connected to accelerated progression of neurodegenerative diseases (Kreft et al., 2014), and microduplications of the locus bearing the KIF21B gene were linked to neurodevelopmental abnormalities (Olson et al., 2012). Furthermore, it has been demonstrated that KIF21B binds to the ubiquitin E3 ligase TRIM3, which can modulate the function of KIF21B (Labonté et al., 2013). The motor was also implicated in the surface delivery of GABAA receptors in neurons, but the interaction is likely indirect (Labonté et al., 2014).

While this manuscript was in preparation, a paper describing a mouse knockout of KIF21B has been published (Muhia et al., 2016). This work showed that mice lacking KIF21B are viable, but display defects in learning and memory, which are likely to be due to several dendritic phenotypes, such as reduced complexity of the dendritic arbor and diminished density of dendritic spines that correlate with defects in synaptic transmission. An even more recent paper showed that KIF21B contributes to activity-dependent regulation of some aspects of retrograde trafficking of brain-derived neurotrophic factor-TrkB complexes in cultured neurons (Ghiretti et al., 2016). Both papers showed that KIF21B can affect MT plus-end dynamics, although the results were complex: while both studies reported an increase in MT growth processivity upon KIF21B loss, MT grew slower in Kif21b knockout neurons, but faster in neurons depleted of KIF21B by RNA interference (Ghiretti et al., 2016; Muhia et al., 2016). In vitro reconstitution work suggested that KIF21B increases MT growth rate and catastrophe frequency, although, surprisingly, the purified protein mostly associated with depolymerizing MT plus ends in these experiments (Ghiretti et al., 2016).

Here, we have used in vitro single molecule assays to systematically explore how the biochemical activity of KIF21B depends on its domain architecture. We found that KIF21B is a processive kinesin that walks to and accumulates at MT plus ends. The dimeric KIF21B motor domain was sufficient to reduce MT growth rate, while the full-length molecule could ‘hold on’ to the growing MT tip and induce its pausing. Strikingly, a few KIF21B molecules were sufficient to trigger and sustain a pause. In cases when KIF21B persisted at the MT tip but did not induce pausing, MT growth perturbation and catastrophes were observed. The potent effect of KIF21B on MT plus-end polymerization is due to the presence of two MT-binding regions in its tail, which help to prevent kinesin dissociation from the tip of the growing MT. We also found that the region responsible for autoinhibition in KIF21A (Bianchi et al., 2016) is conserved in KIF21B. However, instead of blocking the motor, this element reduced motor detachment from growing MT plus ends and thus contributed to MT pause induction. Taken together, our data show how the interplay between the motor domain and MT-binding and regulatory regions makes KIF21B a highly potent regulator of MT plus-end dynamics.

Results

KIF21B can block MT elongation in cells

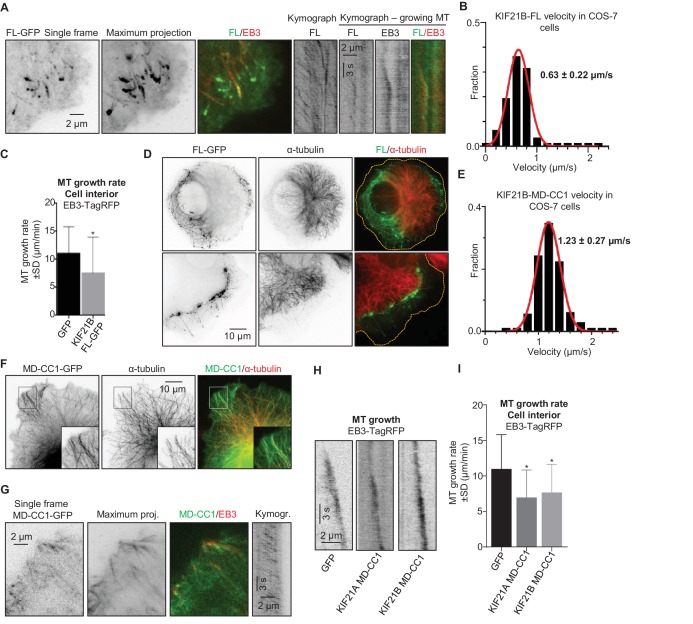
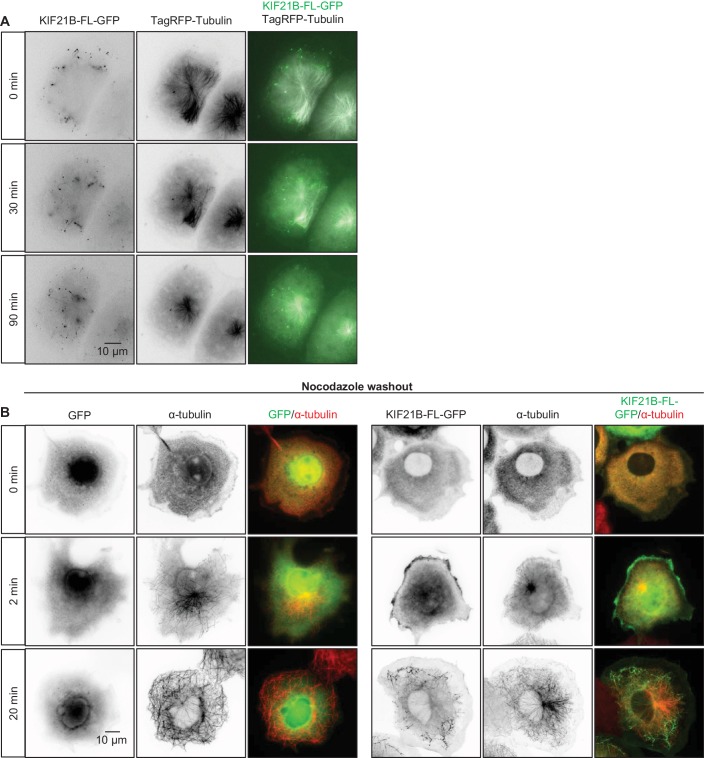
To get insight into the ability of KIF21B to regulate MT dynamics, we have expressed the full-length protein with a C-terminal GFP tag in COS-7 cells, which do not express endogenous KIF21B. Unlike its paralogue KIF21A, which is largely diffuse when expressed in similar conditions (van der Vaart et al., 2013), KIF21B bound to MTs and accumulated at their ends at the cell periphery (Figure 1A). Live cell imaging showed that KIF21B processively moves along MTs with an average speed of 0.63 ± 0.22 µm/s (mean±SD) (Figure 1B); this velocity is three times faster than that recently described for HaloTag-labeled KIF21B in neurons (Ghiretti et al., 2016). In internal cell regions, where no clear accumulation of the motor at growing MT ends was observed, the expression of KIF21B led to a ~1.5 fold reduction in the MT growth rate measured with the MT plus-end marker EB3-TagRFP-T (Stepanova et al., 2003; van der Vaart et al., 2013) (Figure 1C). At the cell periphery, strong accumulation of KIF21B-GFP and stalling of MT growth were observed; however, the exact quantification of MT dynamics at the periphery of KIF21B-overexpressing cells was severely complicated by the frequent sliding of MT tips against each other. Interestingly, in cells with high expression levels of KIF21B, the MT network often strongly retracted, leaving significant portions of the cytoplasm largely devoid of MTs (Figure 1D). The remaining MT network in such cells was still dense and appeared to be ‘corralled’ by KIF21B accumulations. Time lapse imaging showed that the retraction of the MT network in KIF21B-expressing cells was a gradual process that could be detected during 1–2 hr of observation (Figure 1—figure supplement 1A). In addition, expression of KIF21B prevented full extension of MTs in experiments where the MT network recovered from treatment with the MT-depolymerizing drug nocodazole (Figure 1—figure supplement 1B). We conclude that at high expression levels, KIF21B can accumulate at MT plus ends, block their polymerization and cause their very slow shortening (Figure 1—figure supplement 1A).

Figure 1. KIF21B inhibits MT growth in cells.

(A) COS-7 cells were transiently transfected with KIF21B-FL-GFP and EB3-TagRFP-T and imaged using TIRF microscopy. Represented are a single-frame, maximum intensity projection of 500 frames for the GFP channel and an overlay of a single GFP frame in green and TagRFP-T in red. Kymographs illustrate the motility of KIF21B along the MT and its significant accumulation at a stationary but not a growing MT plus end. (B) Histogram of KIF21B-FL-GFP kinesin velocities in COS-7 cells is shown with black bars. Red line shows fitting with a normal distribution. n = 378 in 10 cells in two independent experiments. (C) Quantification of MT growth rate, measured by tracking EB3 labeled comets in cell interior. Three to ten MTs per cell were analyzed; n = 183 in 21 cells for GFP control, n = 214 in 12 cells for KIF21B-FL-GFP expressing cells, two independent experiments, p<0.0001, Mann-Whitney U test (indicated by an asterisk). (D) COS-7 cells were transiently transfected with KIF21B-FL-GFP, fixed the next day and stained for α-tubulin. Cell edges are indicated with yellow dashed lines in the overlay. (E) Histogram of KIF21B-MD-CC1-GFP velocities in COS-7 cells is shown with black bars. Red line shows fitting with a normal distribution. n = 431 in 14 cells in two independent experiments. (F) COS-7 cells transiently transfected with KIF21B-MD-CC1-GFP were fixed and stained for α-tubulin. (G) COS-7 cells were transiently transfected with KIF21B-MD-CC1-GFP and EB3-TagRFP-T and imaged using TIRF microscopy. Represented are a single-frame, maximum intensity projection of 500 frames for the GFP channel, an overlay of a single GFP frame in green and TagRFP-T in red and a kymograph along one of the EB3-labeled MTs showing the motility of the kinesin along the MT. (H) Kymographs showing EB3-TagRFP-T comet displacement in control COS-7 cells or cells expressing the MD-CC1 fragments of KIF21A or KIF21B. (I) Quantification of MT growth rate illustrated in H. n = 183 in 21 cells for GFP control, n = 136 in 15 cells for KIF21A-MD-CC1-GFP, n = 179 in 22 cells for KIF21B-MD-CC1-GFP, two independent experiments, p<0.0001, Mann-Whitney U test (indicated by asterisks).

DOI: http://dx.doi.org/10.7554/eLife.24746.003

Figure 1—source data 1. An excel sheet with numerical data on the quantification of kinesin velocities and MT growth rate in COS-7 cells represented as plots in Figure 1B,C,E,I.
DOI: 10.7554/eLife.24746.004

Figure 1.

Figure 1—figure supplement 1. Effects of KIF21B expression on MT organization and regrowth in cells.

Figure 1—figure supplement 1.

(A) Time-lapse imaging of transiently transfected COS-7 cells expressing KIF21B-FL-GFP and TagRFP-tubulin. Yellow dashed lines in the overlay indicate the cell edge. (B) Nocodazole washout experiments of COS-7 cells expressing GFP or KIF21B-FL-GFP. Cells were transiently transfected with the indicated proteins and treated with 5 μM nocodazole for 2 hr. Subsequently, nocodazole was washed out and cells were fixed at the indicated time points. Antibodies against α-tubulin were used for cell staining. Yellow dashed lines in the overlay indicate the cell edge.

The dimeric motor domain of KIF21B slows down MT polymerization

To investigate whether blocking of MT growth could be caused by the motor domain of KIF21B alone, we used a C-terminally tagged truncated version encompassing the motor and a part of the dimeric coiled coil, but missing the tail region of the protein (KIF21B-MD-CC1; see Figure 6A for the scheme of all constructs used in this study). KIF21B-MD-CC1 also bound to and walked along MTs with a velocity of 1.23 ± 0.27 µm/s (mean±SD) (Figure 1E), but did not specifically accumulate at MT plus ends (Figure 1F,G). The observed velocity was again ~3 times faster than that observed in neurons (Ghiretti et al., 2016), which might be due to the fact that in neuronal cells kinesins are slowed down by specific MAPs. Expression of KIF21B-MD-CC1 reduced MT growth rate by ~1.6 fold (Figure 1H,I), which is similar to what we previously observed with a comparable deletion mutant of KIF21A (van der Vaart et al., 2013).

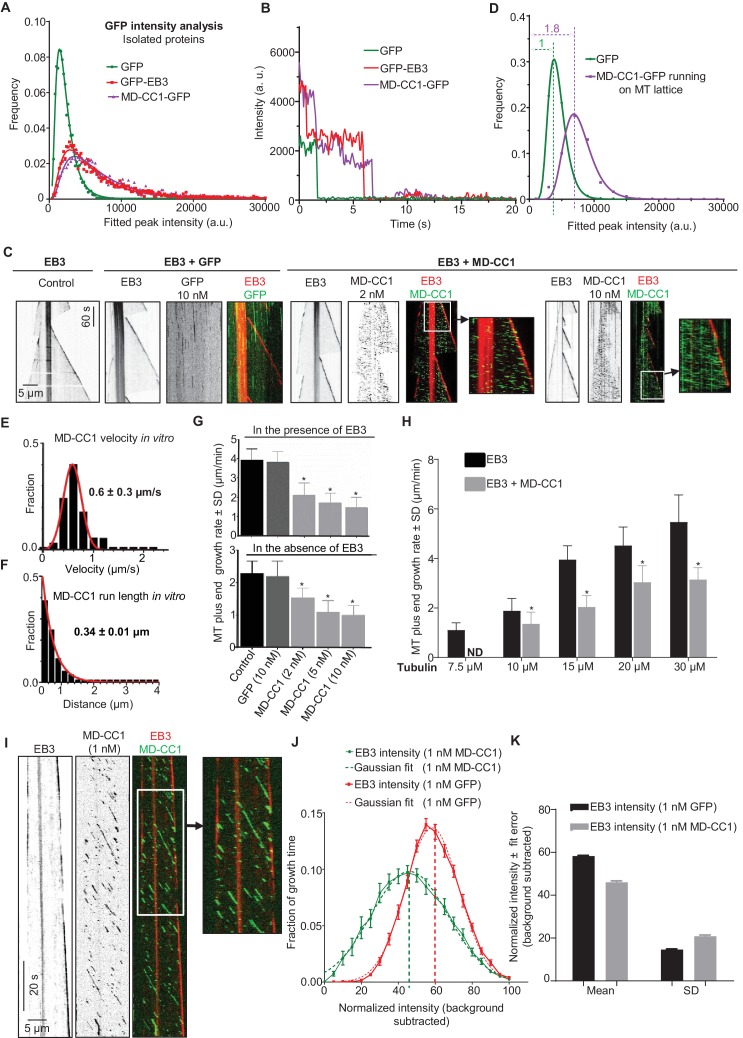
To investigate whether the observed effect of KIF21B-MD-CC1 is direct, we next purified GFP alone and KIF21B-MD-CC1, which was C-terminally tagged with GFP, from HEK293T cells (Figure 2—figure supplement 1). Using mass spectrometry, we confirmed that this purification method did not result in co-isolation of known MT regulators (Supplementary file 1). Analysis of fluorescence intensity of single KIF21B-MD-CC1-GFP molecules in comparison to monomeric GFP and dimeric EB3-GFP indicated that they were dimers, as expected (Figure 2A, Supplementary file 2). This conclusion was confirmed by two-step photobleaching profiles (Figure 2B) and was in agreement with the published data obtained in HeLa cell lysates with a similar construct (Ghiretti et al., 2016).

Figure 2. Dimeric motor domain of KIF21B slows down MT polymerization in vitro.

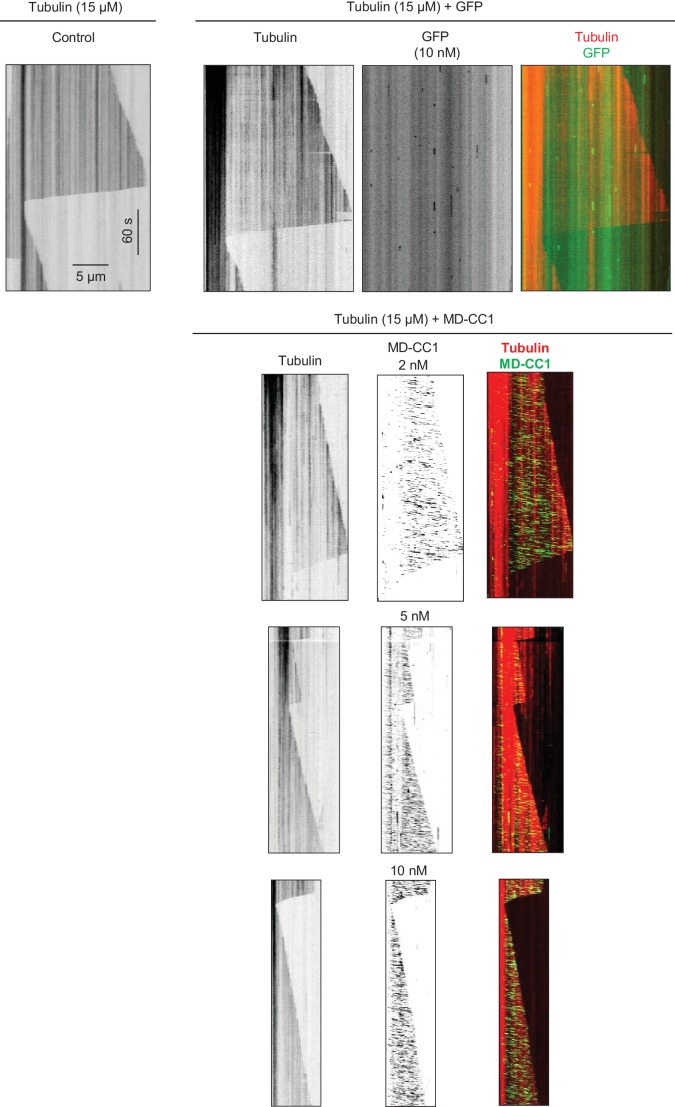
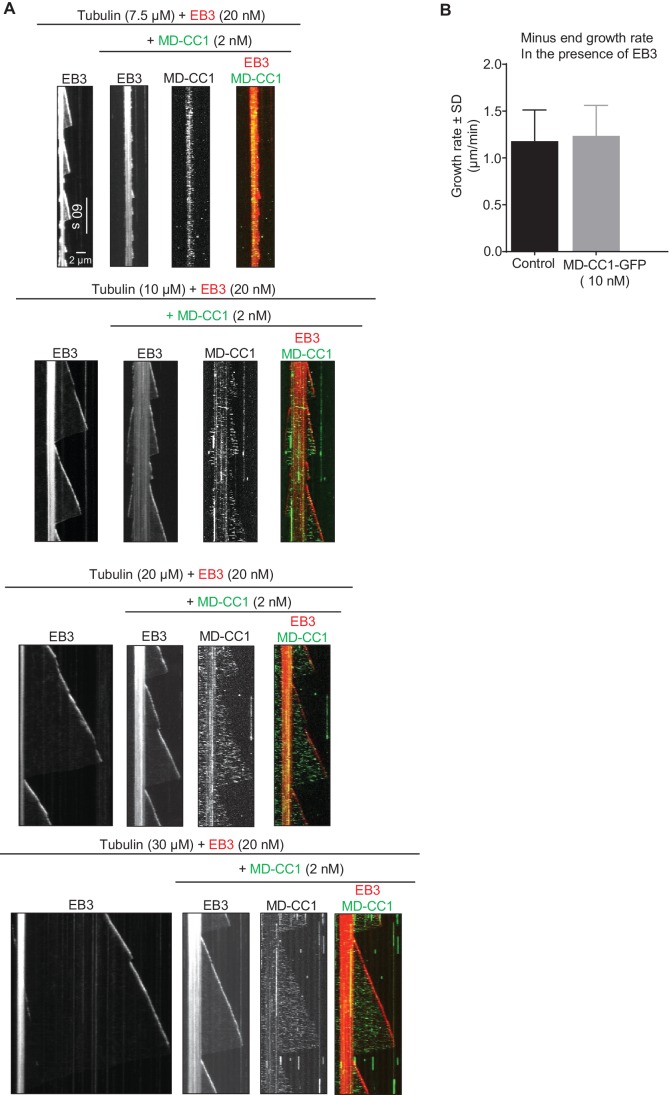
(A) Histograms of fluorescence intensities at the initial moment of observation of single molecules of the indicated proteins immobilized on coverslips (symbols) and the corresponding fits with lognormal distributions (lines). n = 3107, 5802 and 4674 molecules and fluorophore density was 0.15, 0.28 and 0.23 µm−2 for GFP, GFP-EB3 and KIF21B-MD-CC1-GFP proteins. (B) Representative photobleaching time traces of GFP, GFP-EB3 and KIF21B-MD-CC1-GFP individual molecules (background subtracted). (C) Kymographs illustrating the dynamics of MTs grown in vitro in the presence of 20 nM mCherry-EB3 alone, with 10 nM purified GFP or with 2 and 10 nM KIF21B-MD-CC1-GFP. Zooms of the boxed areas are shown on the right. Kymographs were generated from movies acquired using a Photometrics Evolve 512 EMCCD camera (Roper Scientific) (stream acquisition, exposure time 500 ms). (D) Histograms of fluorescence intensities of single GFP molecules immobilized on coverslips and KIF21B-MD-CC1-GFP moving on MTs in a separate chamber on the same coverslip (symbols) and the corresponding fits with lognormal distributions (lines). n = 4815 and 1381 molecules; fluorophore density was 0.16 and 0.09 µm−2 for GFP and KIF21B-MD-CC1-GFP proteins (for the latter, MT-containing regions were manually selected for analysis). Dashed lines show corresponding relative median values. (E) Histogram of KIF21B-MD-CC1-GFP velocities in vitro is shown with black bars. Red line shows fitting with a normal distribution. n = 675 in two independent experiments. (F) Histogram of KIF21B-MD-CC1-GFP run lengths in vitro is shown with black bars. Red line shows fitting with an exponential distribution. n = 675 in two independent experiments. (G) Upper panel - quantification of the MT growth rate illustrated in C. n = 71 for control, n = 65 for purified GFP, n = 71, 67 and 54 for 2, 5 and 10 nM KIF21B-MD-CC1-GFP, respectively. Lower panel shows quantification of the MT growth rate with 15 µM tubulin alone or with 10 nM purified GFP or with 2, 5 and 10 nM KIF21B-MD-CC1-GFP as illustrated in Figure 2—figure supplement 2. n = 67 for control, n = 57 for purified GFP, n = 71, 66 and 80 for 2, 5 and 10 nM KIF21B-MD-CC1-GFP, respectively, two independent experiments, p<0.0001, Mann-Whitney U test (indicated by asterisks). (H) Quantification of the MT growth rate with different concentrations of tubulin along with 20 nM EB3 in the absence and presence of 2 nM KIF21B-MD-CC1-GFP as illustrated in Figure 2—figure supplement 3. ND; not determined, n = 71 for all conditions. two independent experiments, p<0.0001, Mann-Whitney U test (indicated by asterisks). (I) Kymographs illustrating the dynamics of MTs grown in vitro in the presence of 20 nM EB3 and 1 nM KIF21B-MD-CC1-GFP. Zoom of the boxed area is shown on the right. Kymographs were generated from a movie acquired using Photometrics Evolve 512 EMCCD camera (Roper Scientific) (stream acquisition, exposure time 100 ms). (J) Distribution of EB3 fluorescence intensity fluctuations over time (normalized to its maximum value during a course of a growth event) at MT tip in the presence of 1 nM GFP or 1 nM KIF21B-MD-CC1-GFP (solid line) with Gaussian fit (dotted line). n = 25 in both cases. Thick dotted lines show the peak of the Gaussian fitting. MT dynamics assay was performed in the presence of 15 µM tubulin, 20 nM EB3 and 1 nM GFP or 1 nM KIF21B-MD-CC1-GFP in the separate chambers of the same coverslip. (I) Plot of the mean and SD values of Gaussian fits shown in Figure 2J.

DOI: http://dx.doi.org/10.7554/eLife.24746.006

Figure 2—source data 1. An excel sheet with numerical data on the quantification of KIF21B-MD-CC1-GFP dimer analysis, photobleaching-step analysis, velocities, run length, effects on MT growth rate and distribution of EB3 fluorescence intensity represented as plots in Figures 2A,B,D,E–H,J.
elife-24746-fig2-data1.xlsx (337.4KB, xlsx)
DOI: 10.7554/eLife.24746.007

Figure 2.

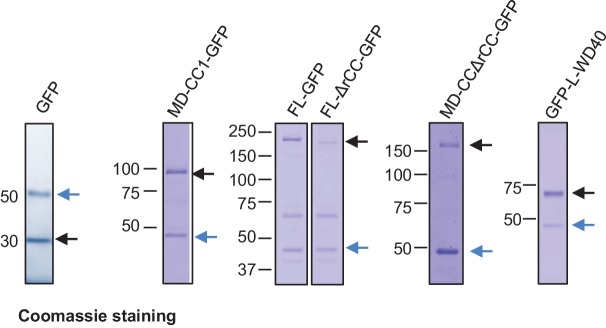
Figure 2—figure supplement 1. Coomassie blue stained gels with purified GFP, KIF21B-FL-GFP and its deletion mutants.

Figure 2—figure supplement 1.

Protein purification was performed using TEV protease cleavage as described in the Materials and Methods section. Black arrows indicate isolated proteins; blue arrows indicate the TEV protease.
Figure 2—figure supplement 2. Kymographs illustrating in vitro dynamics of MTs grown in the presence of 15 µM tubulin in the absence and presence of 10 nM purified GFP or 2, 5 and 10 nM KIF21B-MD-CC1-GFP.

Figure 2—figure supplement 2.

Kymographs were generated from the movies of 600 frames (stream acquisition, exposure time 500 ms) using Photometrics Evolve 512 EMCCD camera (Roper Scientific).
Figure 2—figure supplement 3. Effects of the dimeric motor domain of KIF21B on MT polymerization in vitro.

Figure 2—figure supplement 3.

(A) Kymographs illustrating the in vitro dynamics of MTs grown in the presence of different concentrations of tubulin along with 20 nM EB3 in the absence and presence of 2 nM KIF21B-MD-CC1-GFP. Kymographs were generated from the movies of 600 frames (stream acquisition, exposure time 500 ms) using Photometrics Evolve 512 EMCCD camera (Roper Scientific). (B) Quantification of the velocity of MT minus end growth in the presence of 15 µM tubulin and 20 nM mCherry-EB3 without (control) or with 10 nM KIF21B-MD-CC1-GFP. n = 50 in both cases.
Figure 2—Figure Supplement 3—Source Data 1. An excel sheet with numerical data on the quantification of the MT minus end growth rates represented as plot in Figure 2—figure supplement 3B.
DOI: 10.7554/eLife.24746.011

We then examined the effect of KIF21B-MD-CC1 on dynamic MTs in vitro by using a Total Internal Reflection Fluorescence (TIRF) microscopy-based MT polymerization assay (Bieling et al., 2007; van der Vaart et al., 2013). In this assay, MTs are grown from GMPCPP-stabilized MT seeds attached to glass coverslips in the presence of fluorescently labeled or unlabeled tubulin and proteins of interest. We performed such assays in the presence of fluorescently labeled tubulin alone or with the addition of mCherry-EB3 (Montenegro Gouveia et al., 2010), as this fluorescent protein greatly facilitates the detection of small changes in the position of the growing MT plus end, and our previous work showed that it did not alter the effect of KIF21A on the MT plus-end dynamics (van der Vaart et al., 2013). Moreover, since EB proteins are highly abundant and ubiquitous MT plus-end binding proteins, EB-bound MT plus ends can be expected to represent ‘natural’ substrates for other MT regulators.

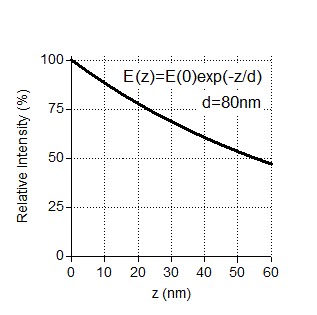
KIF21B-MD-CC1 displayed short plus end-directed runs on MTs and could reach MT plus ends but detached from them upon arrival and thus did not accumulate at the MT tips (Figure 2C). The intensity of individual KIF21B-MD-CC1 molecules moving on MTs was on average ~1.8 times higher than the intensity of individual monomeric GFP molecules immobilized in a separate chamber on the same coverslip (Figure 2D, Supplementary file 2). While a ratio of two might be expected for a dimer, we need to take into account that the motors are further away from the coverslip and that the evanescent field used for excitation decays exponentially. Given a penetration depth d of 80–200 nm, being 25 nm (MT diameter) away from the coverslip will yield a 12–27% reduction in intensity (i.e. e-25/d) (Grigoriev and Akhmanova, 2010). We further note that the intensity distribution of KIF21B-MD-CC1 molecules walking on MTs lacked the tail in the high-intensity range that was observed for molecules immobilized on glass (compare Figure 2A and D), suggesting that larger KIF21B-MD-CC1 oligomers present in our preparations are unable to move on MTs.

Single KIF21B-MD-CC1 molecules displayed an average velocity of 0.6 ± 0.3 µm/s (mean and SD) and an average run length of 0.34 ± 0.01 µm (exponential fit to histogram and error of fit) (Figure 2E,F). KIF21B-MD-CC1 caused a concentration-dependent reduction of the MT plus-end growth rate both in the absence and in the presence of mCherry-EB3, while GFP alone had no effect (Figure 2C,G, Figure 2—figure supplement 2). This effect was similar to that observed previously with the kinesin-4 Xklp1 (Bieling et al., 2010; Bringmann et al., 2004) and with the dimeric motor domain of KIF21A (van der Vaart et al., 2013). A decrease in MT growth rate was observed at tubulin concentrations ranging from 10 to 30 μM, while at 7.5 μM tubulin, 2 nM KIF21B-MD-CC1 was sufficient to almost completely prevent MT outgrowth (Figure 2H, Figure 2—figure supplement 3A). In contrast, minus end growth was not affected in the presence of KIF21B-MD-CC1 (Figure 2—figure supplement 3B), indicating that the effect of this kinesin on MT dynamics is plus end-specific.

How can KIF21B-MD-CC1 inhibit MT growth without accumulating at MT tips? It is possible that transient association of the dimeric motor with MT ends might be sufficient to briefly affect the structure of the tip and thus reduce its growth rate. If this were the case, even infrequent events of KIF21B-MD-CC1arrival to the MT tip could cause some perturbation of MT growth, and we reasoned such perturbations might be reflected in the brightness of the EB3 signal. To test this idea, we performed the assay in the presence of 1 nM KIF21B-MD-CC1 to create a situation when individual KIF21B-MD-CC1 would be occasionally hitting the MT tip, and used faster image acquisition conditions (100 ms/frame, Figure 2I), so that we could observe such events more clearly. Indeed, in these conditions, we observed irregularities of EB3 signal at the growing MT plus ends. To quantify this effect, we analyzed fluctuations of EB3 intensity in the presence of 1 nM GFP or 1 nM KIF21B-MD-CC1-GFP in separate chambers on the same coverslip. We excluded from our analysis MTs that were within ~40 s before catastrophe, since it is known that at this point the comet intensity is reduced (Maurer et al., 2012; Mohan et al., 2013). The distribution of EB3 intensities normalized to the maximum value was significantly broader (with a lower mean and a higher standard deviation) in the presence of KIF21B-MD-CC1-GFP than with GFP alone (Figure 2J,K), indicating that the EB3 signal was indeed more irregular. We note that this analysis is not dependent on the absolute MT growth rate, which can affect the absolute EB3 signal, because the analyzed intensities were normalized to the maximum value. We conclude that the motor domain of KIF21B in a dimeric configuration is motile and can reduce MT plus-end polymerization rate, possibly by perturbing the structure of the growing MT tip.

Full-length KIF21B can induce MT pausing in vitro

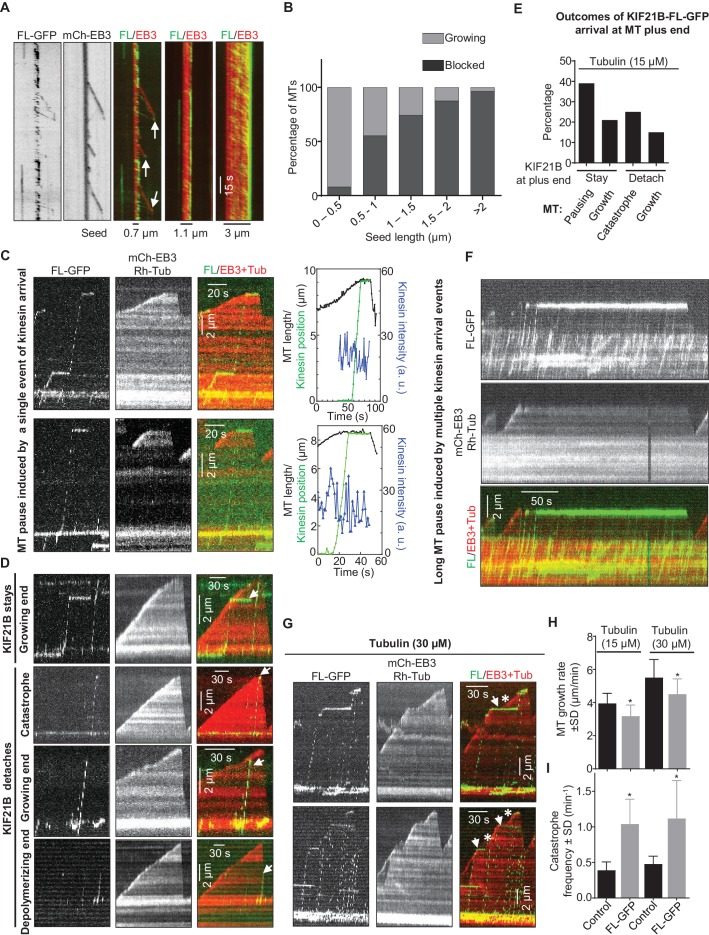
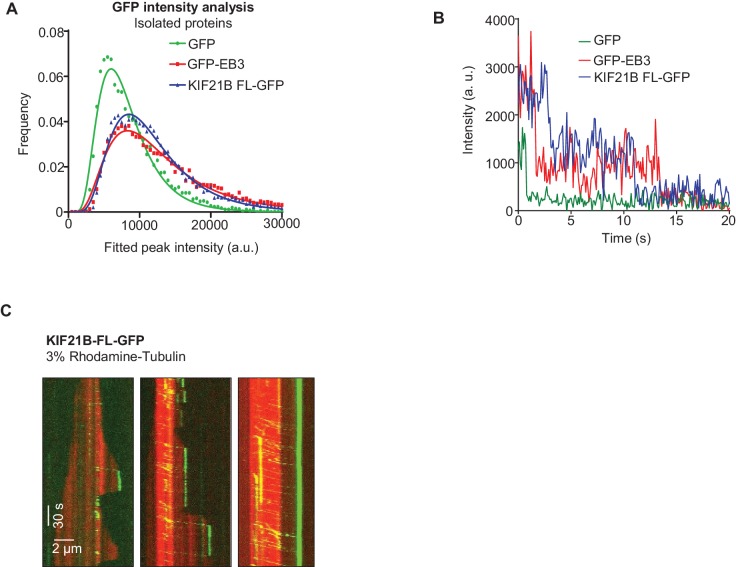
Next, we purified the full-length KIF21B-GFP from HEK293T cells (Figure 2—figure supplement 1) and confirmed by single molecule analysis that it is a dimer (Figure 3—figure supplement 1A,B, Supplementary file 2). Mass spectrometry analysis of this purified protein revealed no known MT regulators (Supplementary file 1). Next, we assayed the activity of KIF21B-GFP on MTs in vitro (Figure 3A, Figure 3—figure supplement 1C). Strikingly, the full-length protein showed a strong preference for GMPCPP-stabilized MT seeds, on which it landed and moved in the direction of the plus-end, while hardly any motor landing events were observed on the dynamic (presumably GDP) MT lattice (Figure 3A,C). KIF21B-GFP motors accumulated at the tips of the seeds, and these accumulations could prevent MT outgrowth (Figure 3A). Both the enrichment of KIF21B-GFP at the tip of seeds and the inhibition of MT outgrowth were more prominent for longer seeds (Figure 3A,B). This indicates that GMPCPP-seeds act as ‘antennae’ that accumulate the kinesin motor at their ends in a length-dependent manner, similar to what has been previously described for the yeast kinesins Kip3 and Kip2 (Hibbel et al., 2015; Su et al., 2012; Varga et al., 2006). Significant blocking of growth from MT seeds, especially the longer ones, was observed already with 3 nM KIF21B-GFP, while complete inhibition of MT outgrowth from all seeds was seen at higher KIF21B-GFP concentrations. At lower concentrations of KIF21B (0.5 nM) growth of some seeds was still blocked, but some MTs were growing, and the effect of KIF21B on MT plus-end dynamics could be analyzed.

Figure 3. KIF21B can induce MT pausing or catastrophe in vitro.

(A) Kymographs showing the behavior of KIF21B in in vitro reconstitution assays on dynamic MTs grown from Rhodamine-tubulin-labeled seeds in the presence of 15 µM tubulin, 100 nM mCherry-EB3 (red) and 3 nM KIF21B-FL-GFP (green). Kymographs were generated from movies acquired using a Photometrics Evolve 512 EMCCD camera (Roper Scientific) (stream acquisition, exposure time 500 ms). Pausing and catastrophe events are indicated by arrows. (B) Quantification of MT seed length-dependent blocking of MT growth by 0.5 nM KIF21B- FL-GFP in the presence of 20 nM mCherry-EB3. 188 MT seeds of different lengths were analyzed in four independent experiments. (C) Kymographs illustrating pausing events induced by KIF21B-FL-GFP (0.5 nM) on dynamic MTs in vitro in the presence of 15 µM tubulin, 20 nM mCherry-EB3, 3% Rhodamine-tubulin. MTs were grown from GMPCPP-stabilized seeds labeled with Rhodamine-tubulin. Kymographs were generated from the movies acquired using a CoolSNAP HQ2 CCD camera (Roper Scientific) with a 1.2-s interval between frames and an exposure time of 100 ms. The rightmost panels show tracked positions of the kinesins and MT tips together with the fluorescence intensity of the kinesins over time for the corresponding kymographs. (D) Kymographs illustrating various events induced by KIF21B-FL-GFP (0.5 nM) on dynamic MTs in vitro in the presence of 15 µM tubulin, 20 nM mCherry-EB3 and 3% Rhodamine-tubulin. MTs were grown from GMPCPP-stabilized seeds labeled with Rhodamine-tubulin. Different events are indicated by arrows. Kymographs were generated from movies acquired as described for Figure 3C. (E) Quantification of different events observed after KIF21B-FL-GFP (0.5 nM) reaches a growing MT plus end, as illustrated in C and D. n = 132 events, four independent experiments were analyzed. (F) Kymograph illustrating a long pause event induced by multiple KIF21B-FL-GFP molecules on dynamic MTs in vitro in the presence of 15 µM tubulin, 20 nM mCherry-EB3 and 3% Rhodamine-tubulin in solution. Kymographs are generated from a movie acquired as described for Figure 3C. (G) Kymographs illustrating the effects of KIF21B-FL-GFP (0.5 nM) on dynamic MTs in vitro in the presence of 30 µM tubulin with 3% Rhodamine-tubulin and 20 nM mCherry-EB3. MTs were grown from GMPCPP-stabilized seeds labeled with Rhodamine-tubulin. The arrows show the position of KIF21B at the site of MT pause and the asterisk indicates the growing MT tip beyond the position of KIF21B binding; note that the slope of the kymograph after KIF21B attachment is less steep than before, indicating that the growth rate is reduced. Kymographs are generated from movies acquired as described for Figure 3C. (H, I) Quantification of MT growth rate and catastrophe frequency in vitro in the presence of 15 or 30 µM tubulin with 20 nM mCherry-EB3 alone or together with 0.5 nM KIF21B-FL-GFP. MTs were grown in the presence of 3% Rhodamine-tubulin. For 15 µM tubulin, n = 71 for control and n = 100 for KIF21B-FL-GFP, three independent experiments. For 30 µM tubulin, n = 71 for control and n = 80 for KIF21B-FL-GFP, three independent experiments, p<0.0001 Mann-Whitney U test (indicated by asterisks).

DOI: http://dx.doi.org/10.7554/eLife.24746.012

Figure 3—source data 1. An excel sheet with numerical data on the quantification of KIF21B-FL seed blocking activity, pause induction, effects on MT growth rate and catastrophe frequency and outcomes of KIF21B-FL-GFP arrival at MT plus ends represented as plots in Figure 3B,C,E,H,I.
DOI: 10.7554/eLife.24746.013

Figure 3.

Figure 3—figure supplement 1. Characterization of full-length KIF21B in vitro.

Figure 3—figure supplement 1.

(A) Histograms of fluorescence intensities at the initial moment of observation of single molecules of the indicated proteins immobilized on coverslips (symbols) and the corresponding fits with lognormal distributions (lines). n = 5063, 8830 and 12230 molecules; fluorophore density was 0.23, 0.4 and 0.45 µm−2 for GFP, GFP-EB3 and KIF21B-FL-GFP proteins. (B) Representative photobleaching time traces of GFP, EB3-GFP and KIF21B-FL-GFP individual molecules (background subtracted). (C) Kymographs illustrating MT dynamics in vitro in the presence of 15 µM tubulin with 3% Rhodamine-tubulin and 0.5 nM KIF21B-FL-GFP. Kymographs were generated from the movies acquired using CoolSNAP HQ2 CCD camera (Roper Scientific) with a 1.2-s interval between frames and an exposure time of 100 ms.
Figure 3—figure supplements 1—source data 1. An excel sheet with numerical data on the quantification of the KIF21B-FL dimer and photobleaching step analysis represented as plots in Figure 3—figure supplement 1A,B.
elife-24746-fig2.xlsx (363.7KB, xlsx)
DOI: 10.7554/eLife.24746.015
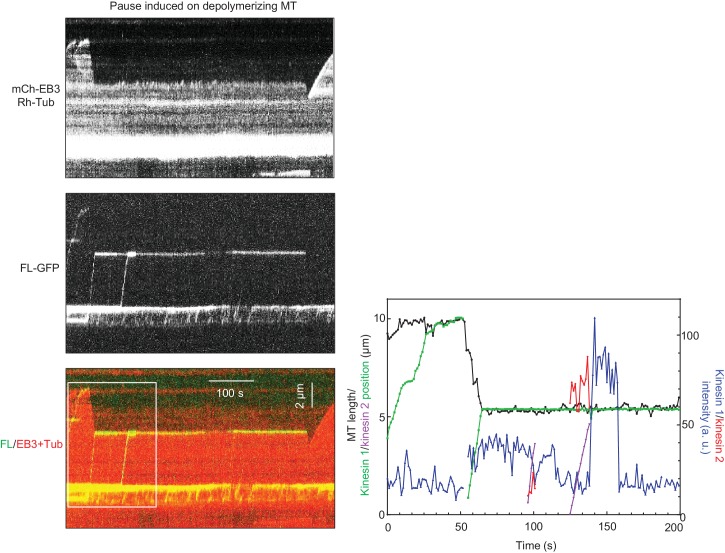
Figure 3—figure supplement 2. KIF21B-FL-GFP induces pausing of a depolymerizing MT.

Figure 3—figure supplement 2.

The rightmost panel shows tracked positions of the kinesins and the MT tip together with the fluorescence intensities of the kinesins over time (white boxed area in kymograph). See also Supplemental Video 1. Kymograph was generated from a movies acquired using CoolSNAP HQ2 CCD camera (Roper Scientific) with a 1.2-s interval between frames and an exposure time of 100 ms.
Figure 3—Figure Supplement 2—Source Data 1. An excel sheet with numerical data on the quantification of tracked positions of the kinesins and the MT tip together with the fluorescence intensities of the kinesins over time represented as plot in Figure 3—figure supplement 2.
DOI: 10.7554/eLife.24746.017

Since KIF21B was present in the assay at low nanomolar concentrations, we could easily detect motility of individual molecules (Figure 3A,C,D, Figure 3—figure supplement 1C). In cases where MT seed extension was observed, a large proportion of KIF21B-GFP motors was unable to transfer from the stabilized seed to the freshly grown part of the MT (Figure 3A,C,D). However, the motors that did pass over to the freshly polymerized lattice exhibited an approximately two-fold faster motility on this lattice compared to the seed (see below). These motors displayed a high degree of processivity (runs with a length up to 8.5 µm were measured) and typically reached the MT plus end (Figure 3A,C,D).

A number of distinct outcomes could be detected when KIF21B-GFP molecules reached MT plus ends. The most frequent one (~40% of all events) was stalling of the kinesin at MT plus end accompanied by MT pausing or very slow growth, which could be distinguished by the loss of mCherry-EB3 signal from MT plus ends (Figure 3C,E). We note that we cannot be sure that MTs did not undergo short (a few hundred nanometers long) growth and shrinkage episodes in these conditions, which we could not detect due to the resolution limit of fluorescence microscopy. Seventy-one percent of all observed pauses were induced by the arrival of what appeared to be a single kinesin dimer or a single small oligomer (see below) and had an average duration of 21.0 ± 5.9 s (n = 36). Tracking of the position of kinesin and MT tip together with kinesin’s fluorescence intensity over time further confirmed that during such pausing events no additional kinesins were recruited (Figure 3C). We have also observed pauses where additional KIF21B-GFP molecules did arrive and stall at the plus end (Figure 3F). Accumulation of multiple KIF21B-GFP motors resulted in prolonged inhibition of MT plus-end growth (the longest pause detected was 231 s). We note that the pausing induced by KIF21B in this assay did not dependent on the presence of EB3, because it was also observed in the presence of tubulin alone (Figure 3—figure supplement 1C).

Other possible outcomes of KIF21B-GFP arrival to the growing MT plus end, which all occurred at similar frequencies, were stalling of the kinesin on the MT without blocking MT elongation, catastrophe induction, which always led to kinesin dissociation from the MT tip, or immediate detachment of the kinesin from the MT plus end without perturbing MT growth (Figure 3D,E). KIF21B-GFP molecules that reached the plus ends of shrinking MTs usually detached without affecting MT depolymerization (Figure 3D, arrow in last kymograph). We did observe one example, where an event of KIF21B arrival to MT tip led to stalled MT depolymerization and a long pause with subsequent arrival of additional kinesins (Figure 3—figure supplement 2, Supplemental Video 1). However, we did not observe any events of persistent KIF21B tracking of depolymerizing MT ends.

Video 1. KIF21B induces pausing of a depolymerizing MT.

Download video file (7.6MB, mp4)
DOI: 10.7554/eLife.24746.018

The movie shows the arrival of KIF21B-FL-GFP at the end of a depolymerizing MT and a subsequent pausing event. The arrival of additional KIF21B-FL-GFP molecules results in a long pause. The experiment was performed in the presence of 15 µM tubulin, Rhodamine-tubulin (0.5 µM), mCherry-EB3 (20 nM) and KIF21B-FL-GFP (0.5 nM). The movie consists of 200 frames acquired with a 1.2-s interval between frames and an exposure time of 100 ms. Scale bar, 2 μm.

DOI: http://dx.doi.org/10.7554/eLife.24746.018

We also examined the behavior of the full-length KIF21B at a higher tubulin concentration, 30 μM, and found that in these conditions 5 nM KIF21B was needed to induce strong inhibition of seed elongation (data not shown). At 0.5 nM KIF21B most MT seeds, including longer ones, could still grow. Since the seeds with a higher accumulation of KIF21B could still elongate, it was easier to observe multiple kinesins passing over to dynamic MTs (Figure 3G). The overall effects of KIF21B on MT dynamics were similar at both tubulin concentrations: KIF21B could induce pausing and catastrophes (Figure 3G). Measurement of MT dynamics showed that at both tubulin concentrations, KIF21B reduced MT growth rate and increased catastrophe frequency (Figure 3H,I).

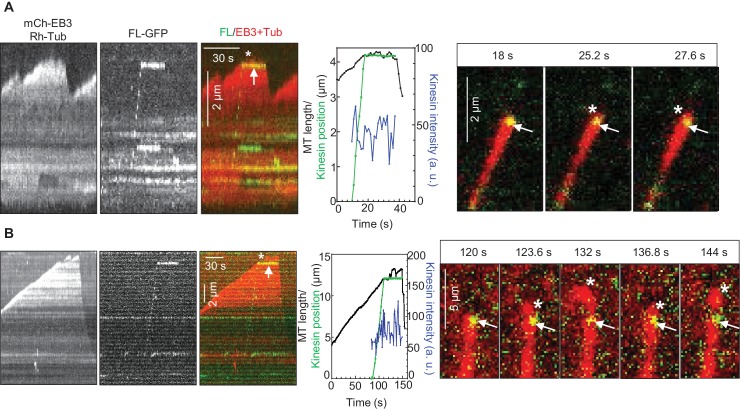
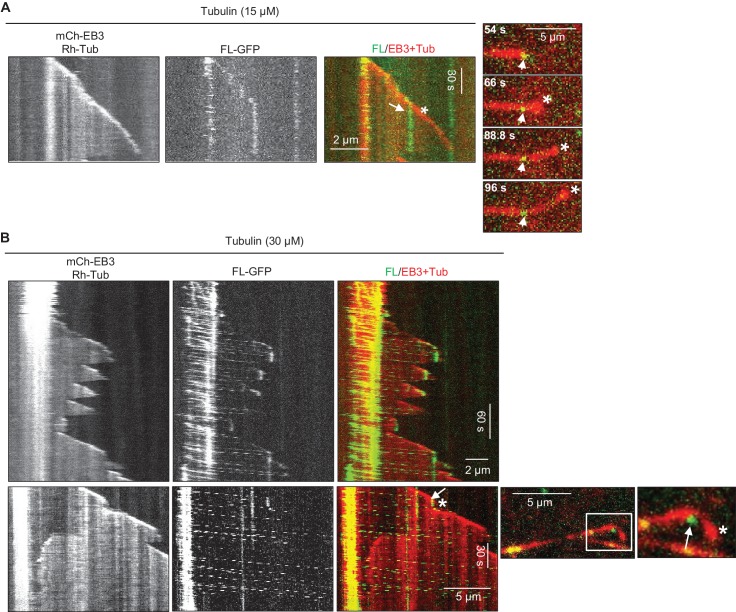
How can relatively infrequent arrivals of KIF21B to growing MT tips significantly affect MT elongation rate? We noticed that, even when the polymerization of a MT plus end was not fully suppressed by the incoming KIF21B molecule, in cases when the kinesin did not immediately detach from the MT, MT elongation was typically strongly perturbed (Figure 4, Figure 4—figure supplement 1A). We observed many events where a MT tip was undergoing short repeated growth and shortening excursions from the point of KIF21B stalling (Figure 4A,B, Supplemental Video 2). Such MT behavior indicates that KIF21B immobilized at a MT tip prevented both its normal elongation and also its depolymerization. At 30 μM tubulin, the KIF21B stalling events typically led to very irregular growth, which ended in catastrophe (Figure 4—figure supplement 1B). Importantly, after the point where KIF21B was stalled, the path of the growing MT often became curved (Figure 4, Figure 4—figure supplement 1, Supplemental Video 2), while control MTs always grew straight in our assays. Taken together, these data suggest that KIF21B attached to the plus end might be blocking growth of a few protofilaments, leading to the extension of an incomplete and thus more flexible tube, which is more prone to undergo a catastrophe.

Video 2. KIF21B perturbs MT growth and induces MT bending.

Download video file (12.1MB, mp4)
DOI: 10.7554/eLife.24746.022

The combined movie shows the two different events illustrated in Figure 4—figure supplement 1A and Figure 4B. The movie shows bending of an MT growing beyond the point where KIF21B-FL-GFP was stalled (top panel, upper MT) and repeated short excursions from the point of KIF21B-FL-GFP stalling (bottom panel). The experiment was performed in the presence of 15 µM tubulin, Rhodamine-tubulin (0.5 µM), mCherry-EB3 (20 nM) and KIF21B-FL-GFP (0.5 nM). The movie consists of 128 frames acquired with a 1.2-s interval between frames and an exposure time of 100 ms. Scale bar, 2 μm.

DOI: http://dx.doi.org/10.7554/eLife.24746.022

Figure 4. KIF21B molecules persisting on a MT tip can perturb MT growth.

(A, B) Kymographs illustrating perturbation of MT growth in vitro by 0.5 nM KIF21B-FL-GFP in the presence of 15 µM tubulin with 3% Rhodamine-tubulin and 20 nM mCherry-EB3. Kymographs were generated from movies acquired as described for Figure 3C. Positions of the kinesins and MT tips together with the fluorescence intensity of the kinesins over time for the corresponding kymographs are also illustrated. Time lapse images on the right of the kymographs illustrate short excursions of MT plus tip (A) or curling of MT plus tip (B) after the binding of KIF21B-FL-GFP to the MT plus end. The position of the kinesin on the MT is indicated by arrows. Asterisks show the position of growing MT tips extending beyond the point of KIF21B attachment. See also Supplemental Video 2.

DOI: http://dx.doi.org/10.7554/eLife.24746.019

Figure 4—source data 1. An excel sheet with numerical data on the quantification of tracking of kinesins and MT tips over time represented as plots in Figure 4A,B.
DOI: 10.7554/eLife.24746.020

Figure 4.

Figure 4—figure supplement 1. Perturbation of MT growth in vitro by full-length KIF21B.

Figure 4—figure supplement 1.

(A, B) Kymographs illustrating perturbation of MT growth in vitro by 0.5 nM KIF21B-FL-GFP in the presence of 15 and 30 µM tubulin with 3% Rhodamine-tubulin and 20 nM mCherry-EB3. Time lapse images on the right illustrate MT plus tip curling after the binding of KIF21B-FL-GFP to the MT plus end. The position of the kinesin on the MT is indicated by arrows. Asterisks show the position of growing MT tips extending beyond the point of KIF21B attachment. Boxed area is zoomed. See also Supplemental Video 2. Kymographs were generated from movies acquired using CoolSNAP HQ2 CCD camera (Roper Scientific) with a 1.2-s interval between frames and an exposure time of 100 ms.

A few KIF21B molecules can induce a MT pause

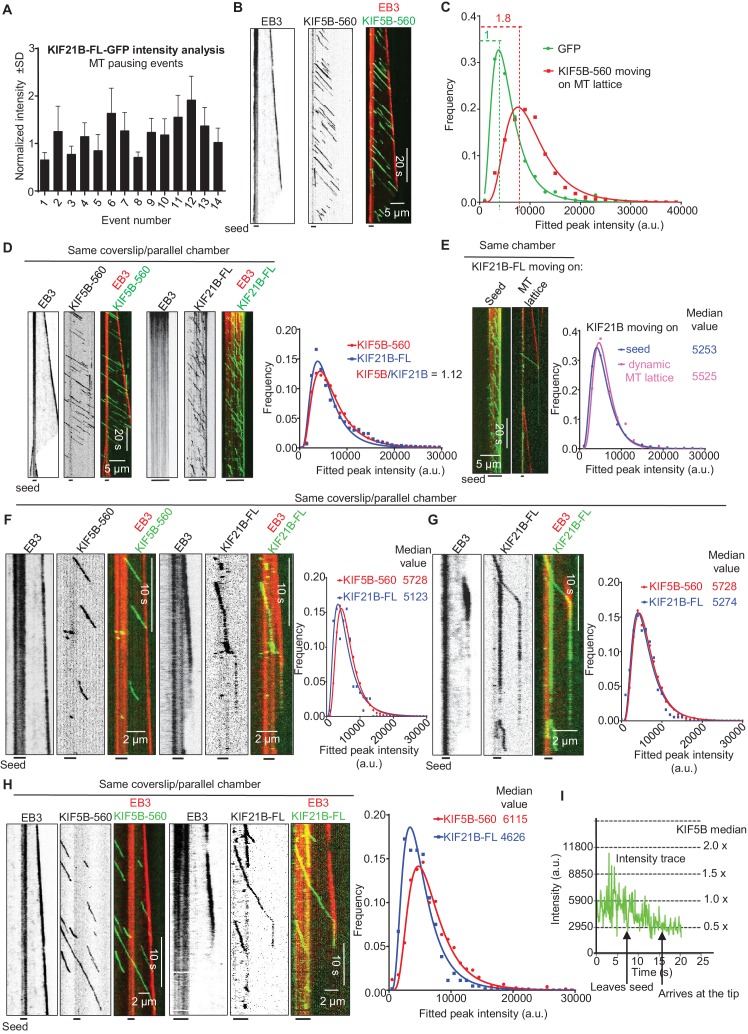
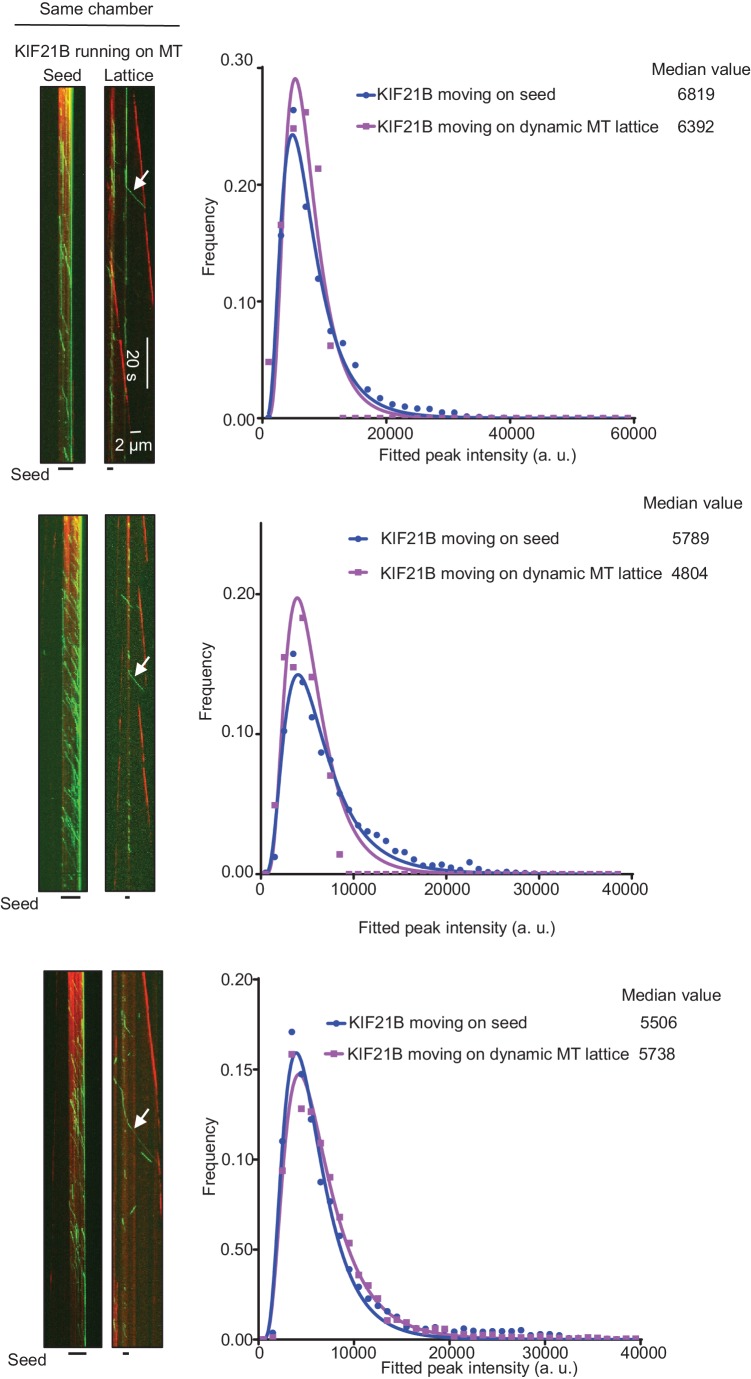
As indicated above, at 15 μM tubulin, we frequently observed MT pause induction by what appeared to be single KIF21B molecules or small oligomers. The ratio of the intensity of the motile KIF21B molecules responsible for the pausing events to the intensity of KIF21B dimers immobilized on the same coverslip was ~0.75–1.9 (Figure 5A). This is consistent with one or two KIF21B molecules, if one takes into account the decay of the evanescent field. To further examine this, we compared KIF21B intensities with those of an N-terminal fragment of kinesin-1, KIF5B residues 1–560 (denoted KIF5B-560), which is a well-studied motile dimeric kinesin (Vale et al., 1996). The intensities of single GFP-tagged KIF5B-560 molecules moving on MTs in vitro were ~1.8 higher than the intensities of single GFP proteins immobilized in a separate chamber on the same coverslip (Figure 5B,C, Supplementary file 2), confirming that KIF5B-560 is a dimer in our preparation, similar to what we published previously (Doodhi et al., 2014). We then compared the intensities of full length KIF21B molecules moving on seeds to the intensities of KIF5B-560 molecules moving on MTs in a separate chamber on the same coverslip, and found that they were also very similar (Figure 5D, Supplementary file 2). Importantly, the intensities of the few KIF21B molecules that transferred from seeds to the dynamic MT lattice were very similar to those of KIF21B molecules moving on seeds (Figure 5E, Figure 5—figure supplement 1, Supplementary file 2). Together, these data indicate that motile KIF21B kinesins are mostly dimers, and that these kinesins do not need to form larger oligomers in order to ‘escape’ from the seed to the dynamic lattice.

Figure 5. Single events of kinesin arrival to the MT plus end can induce MT pausing.

(A) GFP intensity analysis of kinesins during MT pausing events. Values are normalized to the GFP intensity of proteins immobilized on the same coverslip in areas devoid of MTs. Data are from two independent experiments. (B) Kymographs showing the behavior of KIF5B-560-GFP in an in vitro reconstitution assay on dynamic MTs grown from Rhodamine-tubulin-labeled seeds in the presence of 15 µM tubulin, 20 nM mCherry-EB3 (red) and 5 nM KIF5B-560-GFP (green). (C) Histograms of fluorescence intensities of single GFP molecules immobilized on coverslips (initial moment of observation of single molecules) or KIF5B-560-GFP moving on MTs in a separate chamber on the same coverslip (symbols) and the corresponding fits with lognormal distributions (lines). n = 452 and 2040 molecules; fluorophore density was 0.05 and 0.09 µm−2 for GFP and KIF5B-560-GFP proteins (for the latter, MT-containing regions were manually selected for analysis). Dashed lines show the corresponding relative median values. (D) Kymographs showing the behavior of 5 nM KIF5B-560-GFP (moving on dynamic MTs, green) and 0.5 nM KIF21B-FL-GFP (moving on seeds, green) in an in vitro reconstitution assay with MTs grown from Rhodamine-tubulin-labeled seeds in the presence of 15 µM tubulin and 20 nM mCherry-EB3 (red). Histograms illustrate fluorescence intensities of KIF5B-560-GFP moving on MTs and KIF21B-FL-GFP moving on seeds in separate chambers on the same coverslip (symbols) and the corresponding fits with lognormal distributions (lines). n = 5123 and 8728 molecules; fluorophore density was 0.15 and 0.18 µm−2 for KIF5B-560-GFP and KIF21B-FL-GFP proteins (MT-containing regions were manually selected for analysis). Ratio of the corresponding median values is also indicated. (E) Kymographs illustrating KIF21B-FL-GFP (0.5 nM) movement on seeds and dynamic MTs, histograms of the corresponding fluorescence intensities measured within the same sample (symbols) and their fits with lognormal distributions (lines). Median values are also indicated. (F–H) Kymographs illustrating motility of KIF5B-560-GFP (5 nM) on dynamic MTs and KIF21B-FL-GFP (0.5 nM) moving from an MT seed to the dynamic MT lattice and inducing a MT pause in an in vitro reconstitution assay with MTs grown from Rhodamine-tubulin-labeled seeds in the presence of 15 µM tubulin and 20 nM mCherry-EB3 (red). Histograms show fluorescence intensities of motile KIF5B-560-GFP molecules and KIF21B-FL-GFP inducing a MT pause in separate chambers on the same coverslip (symbols) and the corresponding fits with lognormal distributions (lines). Median values are also indicated. In all the conditions, kymographs were generated from movies of 1500 frames (stream acquisition, exposure time 100 ms) using Photometrics Evolve 512 EMCCD camera (Roper Scientific). Positions of seeds in each kymograph are indicated. (I) Fitted peak intensity time trace for the trajectory of a moving KIF21B-FL-GFP molecule from the event shown in Figure 5H. Dashed lines correspond to the scaled values of median fluorescence fitted peak intensity of KIF5B-560-GFP molecules moving on dynamic MT in a parallel chamber on the same coverslip.

DOI: http://dx.doi.org/10.7554/eLife.24746.023

Figure 5—source data 1. An excel sheet with numerical data on the quantification of KIF21B-FL intensity during MT pausing events, KIF5B-560 dimer analysis and comparison of fluorescence intensities of KIF5B-560 with KIF21B-FL represented as plots in Figure 5A,C,D–I.
elife-24746-fig5-data1.xlsx (486.4KB, xlsx)
DOI: 10.7554/eLife.24746.024
Figure 5—figure Supplement 2—Source data 1. An excel sheet with numerical data on the quantification of photobleaching traces of KIF21B-FL-GFP represented as plots in Figure 5—figure supplement 2.
elife-24746-fig6.xlsx (40.9KB, xlsx)
DOI: 10.7554/eLife.24746.025

Figure 5.

Figure 5—figure supplement 1. Kymographs illustrating KIF21B-FL-GFP (0.5 nM) moving on seeds and dynamic MTs in in vitro reconstitution assays, histograms of the corresponding fluorescence intensities (symbols) and the corresponding fits with lognormal distributions (lines).

Figure 5—figure supplement 1.

Median values are also indicated.
Figure 5—figure supplements 1—Source data 1. An excel sheet with numerical data on the quantification of KIF21B-FL fluorescence intensities represented as plots in Figure 5—figure supplement 1.
elife-24746-fig4.xlsx (368.9KB, xlsx)
DOI: 10.7554/eLife.24746.027
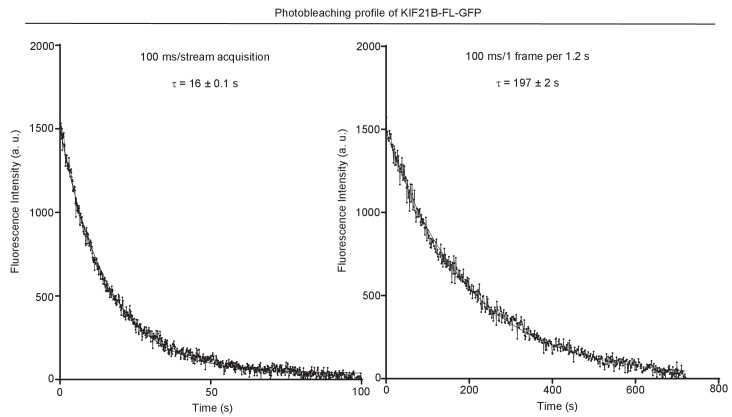
Figure 5—figure supplement 2. Characteristic photobleaching traces of KIF21B-FL-GFP under two different imaging conditions.

Figure 5—figure supplement 2.

KIF21B-FL-GFP immobilized on coverslip was exposed to low laser power (used for imaging shown in Figures 35 and 7) with 100 ms/stream acquisition or 100 ms exposure time, 1 frame per 1.2 s. Curves were fitted with one-phase exponential decay.

We have also considered that we might be underestimating the actual size of KIF21B clusters that induce pausing because of their photobleaching. For our regular imaging experiments (Figure 3C,D,G, Figure 4), we acquired the data at 1.2 s/frame with an exposure time of 100 ms. For comparison, we collected data with the same laser power at a 12 times higher frame rate (100 ms/frame, stream acquisition), again in the presence of a ‘reference chamber’ with KIF5B-560 on the same coverslip. We observed several events of MT pause induction, in which the intensity of the KIF21B molecule inducing a pause was similar to that of single KIF5B-560 kinesins (Figure 5F–H, Supplementary file 2). For example, in the event shown in Figure 5H, the initial intensity of the analyzed KIF21B molecule when it starts its movement on the seed is in the range of the median of KIF5B-560 molecules (Figure 5I). While this molecule moves on the freshly polymerized MT lattice, its intensity is reduced by half, which we attribute to the bleaching of one of the GFP molecules. After arriving to the MT tip and inducing a pause, the molecule bleaches or desorbs as the MT switches to catastrophe. These data show that the laser power used for illumination was gentle enough for 20 s of imaging of a single KIF21B molecule at 10 frames per second. Measurements of the average photobleaching time showed that it was ~16 s at 100 ms/stream acquisition and ~197 s when the images were acquired with a 100 ms exposure with the interval of 1.2 s (Figure 5—figure supplement 2). This means that in our regular imaging experiments, the average bleaching time is close to 200 s and is thus significantly longer than the duration of kinesin runs, which is typically tens of seconds. Photobleaching is thus unlikely to lead to a strong underestimate of the number of kinesins sufficient to trigger MT pausing.

Characterization of MT-binding and autoinhibitory domains in the tail region of KIF21B

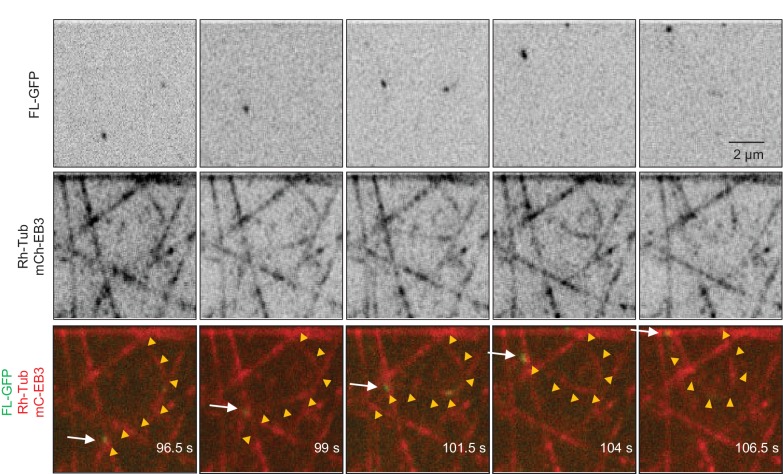
Our data presented so far indicate that a few KIF21B motors can prevent both growth and shortening by ‘holding on’ to a MT plus end. Since the dimeric motor domain of KIF21B by itself does not show such an activity, this result suggests that additional MT-binding sites that can associate with the MT plus ends must be present in the KIF21B tail. In line with this conclusion, we observed that when MTs were allowed to grow long in vitro in the presence of a low (0.5 nM) KIF21B concentration, KIF21B motors could pull a MT along another MT (Figure 6—figure supplement 1). This observation suggests that KIF21B can bind to one MT and walk along another MT at the same time.

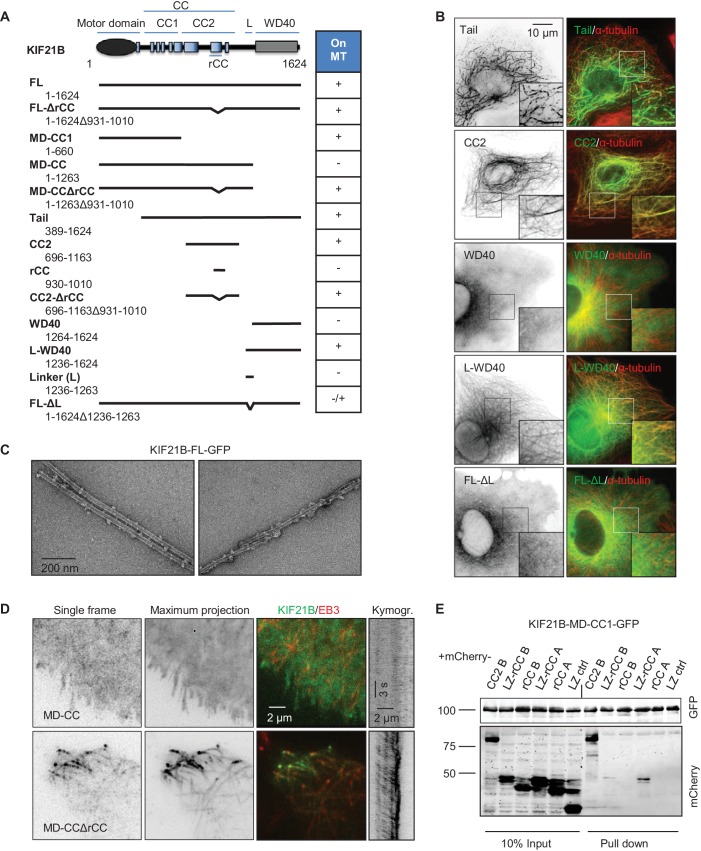
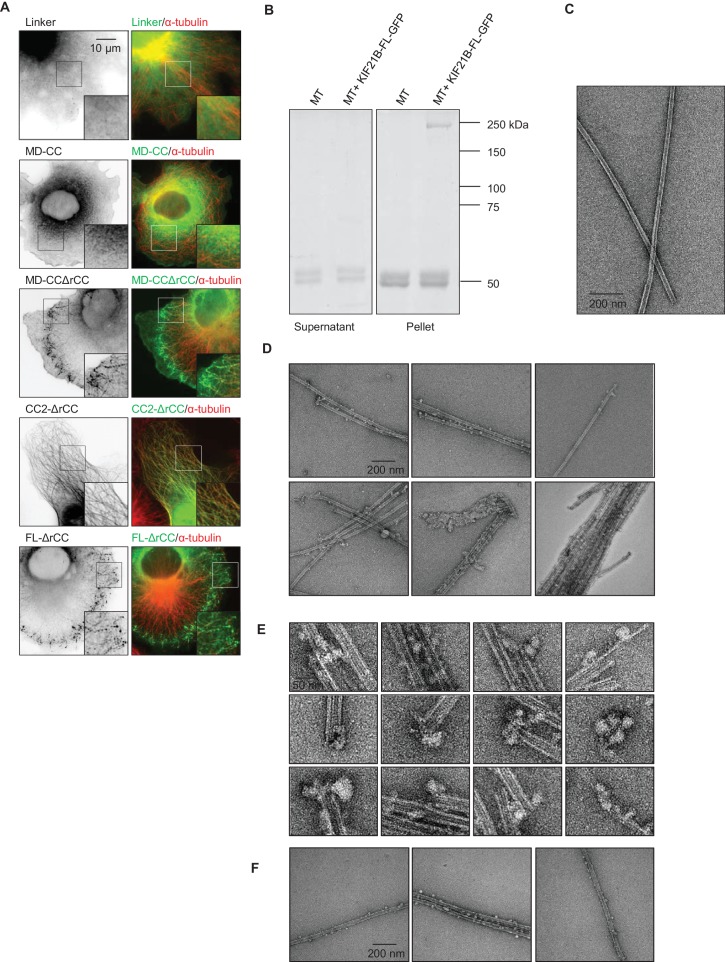
We then set out to identify additional MT binding site(s) in the KIF21B tail by deletion mapping (Figure 6A). Different KIF21B fragments were expressed in COS-7 cells, and their colocalization with MTs was observed by fluorescence microscopy (Figure 6B, Figure 6—figure supplement 2A). We found that the tail of KIF21B alone strongly localized to MTs (Figure 6A,B). Subsequent mapping showed that two separate parts of the KIF21B tail could bind to MTs: the centrally located predicted coiled-coil part with adjacent sequences (CC2), as well as the C-terminal WD40 domain together with the N-terminal linker region enriched in proline, serine and arginine residues (termed L-WD40; Figure 6A,B, Figure 6—figure supplements 2A and 3). Neither the WD40 domain alone, nor the linker alone showed robust MT binding, suggesting that the MT-binding affinity of this region depends on the combination of the two elements (Figure 6A,B, Figure 6—figure supplement 2A). Together, these data indicate that KIF21B can interact with MTs through three non-overlapping regions, the motor domain, the stalk region and the WD40 domain, and that the full length KIF21B molecule is likely to be folded when attached to MTs.

Figure 6. Mapping of the MT-binding domains in the tail of KIF21B.

(A) Overview of deletion mutants used in this study. Colocalization of the GFP-tagged KIF21B deletion mutants with MTs in transiently transfected COS-7 cells is indicated. +, localization to MTs, -, diffuse distribution, -/+, diffuse in most cells, with occasional MT localization observed in some cells. (B) COS-7 cells were fixed one day after transient transfection with the indicated constructs and stained for α-tubulin. (C) Electron micrographs of negatively stained taxol-stabilized MTs in complex with KIF21B-FL-GFP. (D) Live imaging of COS-7 cells transiently transfected with KIF21B-MD-CC-GFP or MD-CCΔrCC-GFP and EB3-TagRFP-T. Represented are a single-frame, maximum intensity projection of 500 frames for the GFP channel, an overlay of single GFP frame in green and TagRFP-T in red and a kymograph along one of the EB3-labeled MTs showing kinesin motility. (E) Streptavidin pull down assay with the extracts of HEK293T cell expressing BirA, KIF21B-MD-CC1-GFP-TEV-Bio and the indicated mCherry-labeled proteins. A and B stand for KIF21A and KIF21B; LZ, leucine zipper from GCN4 used for dimerization. The other abbreviations are explained in panel A. The results were analyzed by Western blotting with the antibodies against the GFP- and mCherry.

DOI: http://dx.doi.org/10.7554/eLife.24746.029

Figure 6—figure supplement 4—source data 1. An excel sheet with numerical data on the quantification of far-UV CD spectra (inset) and thermal unfolding profile of recombinant KIF21B rCC1 represented as plots in Figure 6—figure supplement 4A.
elife-24746-fig7.xlsx (12.3KB, xlsx)
DOI: 10.7554/eLife.24746.030

Figure 6.

Figure 6—figure supplement 1. In vitro reconstitution of MT growth in the presence of 20 nM mCherry-EB3, 3% Rhodamine-tubulin and 0.5 nM KIF21B-FL-GFP.

Figure 6—figure supplement 1.

KIF21B-FL-GFP is attached to one MT and walks along another one, causing MT bending. Arrow indicates position of KIF21B-FL-GFP, yellow arrowheads trace the MT that bends.
Figure 6—figure supplement 2.

Figure 6—figure supplement 2.

(A) COS-7 cells transiently transfected with the indicated KIF21B-GFP deletion constructs and stained for α-tubulin. (B) MT pelleting assay of taxol-stabilized MTs incubated with KIF21B-FL-GFP. Coomassie-stained SDS-PAGE of supernatant and pellet fractions of MTs alone or MTs incubated with KIF21B-FL-GFP are shown. (C) Electron micrograph of a negatively stained taxol-stabilized MT control specimens. (D) Gallery of electron micrographs of negatively stained taxol-stabilized MT specimens obtained in the presence of KIF21B-FL-GFP. (E) High-magnification views of taxol-stabilized MT ends decorated with KIF21B-FL-GFP. (F) Gallery of electron micrographs of negatively stained GMPCPP-MT specimens obtained in the presence of KIF21B-FL-GFP.
Figure 6—figure supplement 3. Alignment of human KIF21A and KIF21B sequences.

Figure 6—figure supplement 3.

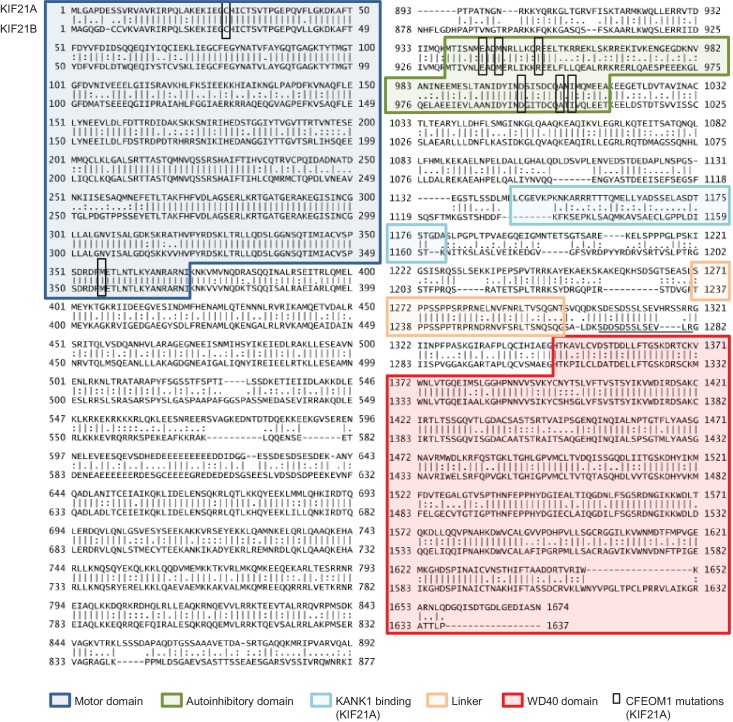
Different protein domains and the autoinhibitory region in the coiled coil domain described for KIF21A (van der Vaart et al., 2013) are indicated, and CFEOM1-associated mutations found in KIF21A are boxed. The KIF21B sequence shown here corresponds to the longest KIF21B isoform (Accession number O75037); a shorter isoform (Accession number BAA32294), which misses the amino acids 1269–1281 (underlined), was used in this study.
Figure 6—figure supplement 4.

Figure 6—figure supplement 4.

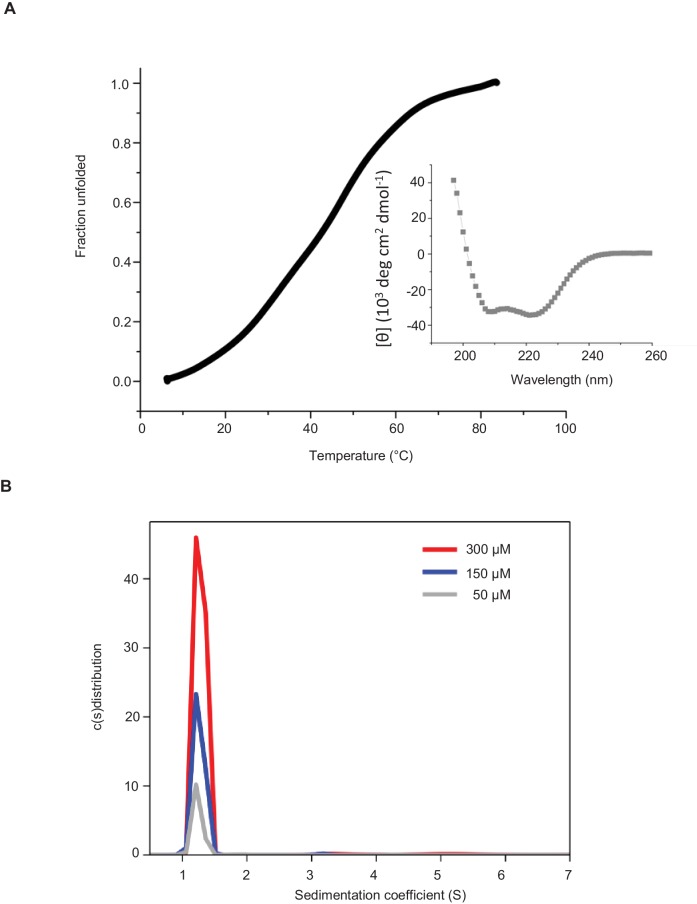
(A) Far-UV CD spectra (inset) and thermal unfolding profile of recombinant KIF21B rCC. CD measurements, performed in PBS at a protein concentration of 0.166 mg/ml. (B) Oligomerization state of recombinant KIF21B rCC determined by sedimentation velocity AUC at 20°C and at three different protein concentrations.

To test whether KIF21B assumes a compact conformation when bound to MTs, we used MT pelleting assays and electron microscopy with the isolated full-length KIF21B together with taxol-stabilized MTs (Figure 6—figure supplement 2B). As expected, after centrifugation, the full-length KIF21B was present in the pelleted fraction together with MTs. The pelleted fractions were further analyzed by negative stain electron microscopy. Electron micrographs of the full-length KIF21B bound to MTs indeed suggest that the motor has a highly folded, globular appearance, consistent with the presence of several MT interaction sites (Figure 6C, Figure 6—figure supplement 2C–E). Similar results were obtained with GMPCPP-stabilized MTs (Figure 6—figure supplement 2F).

Interestingly, the deletion of the linker region located N-terminally of the WD40 strongly reduced the MT binding activity of the resulting KIF21B mutant, while the deletion of the C-terminal WD40 domain rendered the KIF21B protein completely diffuse (KIF21B-MD-CC construct, Figure 6A,D). This was surprising, as the other two MT-binding sites, the motor domain and the CC2, were still present in these deletion mutants. Since a shorter KIF21B fragment, KIF21B-MD-CC1, bound to and moved along MTs, this result suggests that the CC2 region harbors not only a MT-binding, but also an autoregulatory activity.

Previous work showed that the part of KIF21A that corresponds to the CC2 region of KIF21B contains an autoinhibitory element, which interacts with the motor domain, and that mutations in this region cause loss of autoinhibition and lead to CFEOM1 (Cheng et al., 2014; van der Vaart et al., 2013). Recently, we have characterized this interaction in detail and showed that it is mediated by a regulatory region that forms an intramolecular antiparallel coiled coil (Bianchi et al., 2016). This sequence region, including the CFEOM1-associated residues, is well conserved in KIF21B (rCC, amino acids 931–1010) (Figure 6—figure supplement 3), suggesting that it might have a similar autoinhibitory function. To test this possibility, we first assessed the secondary structure content and the stability of KIF21B rCC by performing circular dichroism (CD) spectroscopy experiments. The far-ultraviolet CD spectra recorded for the polypeptide chain fragments revealed a significant amount of α-helical structure with distinct minima centered around 208 and 222 nm (Figure 6—figure supplement 4A, inset). The stability of KIF21B rCC was subsequently assessed by a thermal unfolding profile monitored by CD at 222 nm, which yielded a melting temperature of 43.6°C Figure 6—figure supplement 4A). To assess the oligomerization state of KIF21B rCC, we performed sedimentation velocity experiments (Figure 6—figure supplement 4B), which revealed a molecular weight of 11 kDa for the polypeptide chain fragment (calculated molecular weight of KIF21B rCC: 9.5 kDa). These biophysical results are consistent with KIF21B rCC forming an intramolecular antiparallel coiled coil in solution, very similar to the one we described for KIF21A (Bianchi et al., 2016).

In agreement with the expected autoinhibitory function of rCC, its deletion in the KIF21B-MD-CC restored MT binding activity and motility of this KIF21B fragment (Figure 6A,D, Figure 6—figure supplement 2A). By itself, the rCC did not bind MTs in cells, and its deletion had no effect on the MT binding properties of the CC2 fragment (Figure 6A, Figure 6—figure supplement 2A). Using immunoprecipitation assays, we detected an interaction between the CC2 and the MD-CC1 region of KIF21B (Figure 6E). A weak binding was also observed with an rCC variant that was fused to the dimeric leucine zipper (LZ) of GCN4, although not with the monomeric version of rCC (Figure 6E). A stronger binding of the KIF21B motor domain was observed to the rCC region of KIF21A (Figure 6E), suggesting that the autoinhibitory interaction within KIF21B is attenuated compared to KIF21A. In agreement with this view, overexpressed KIF21A is largely diffuse in cells and presumably only becomes active when bound to appropriate partners (van der Vaart et al., 2013), while KIF21B shows constitutive MT association.

Regulation of the MT pausing activity of KIF21B by its tail region

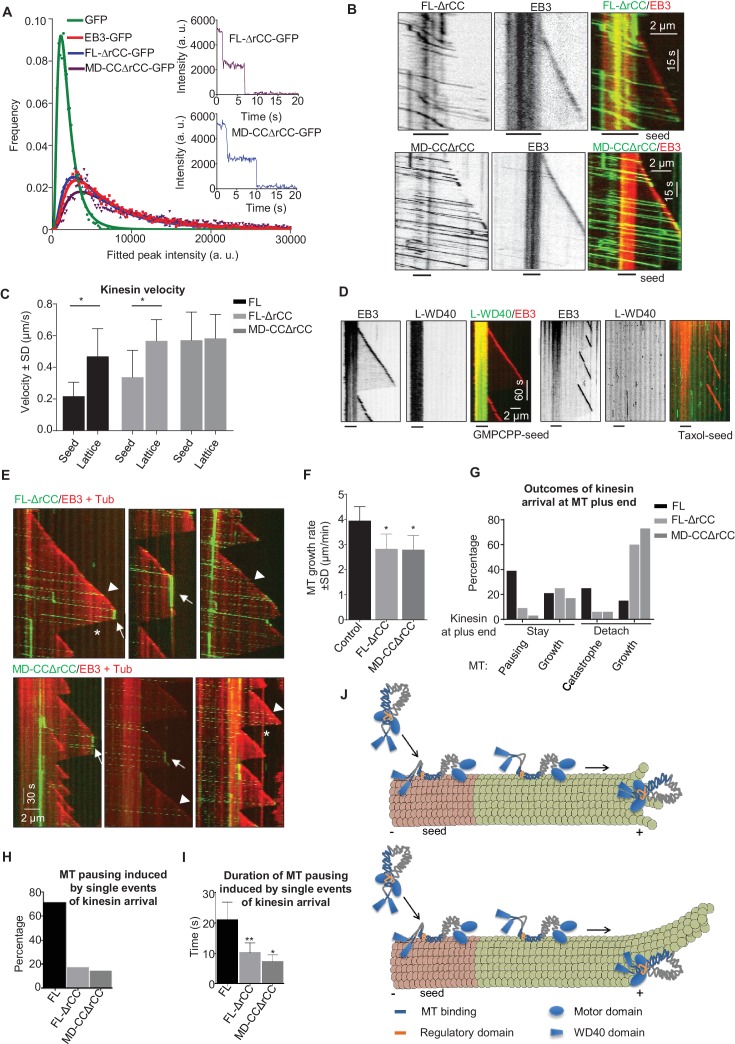
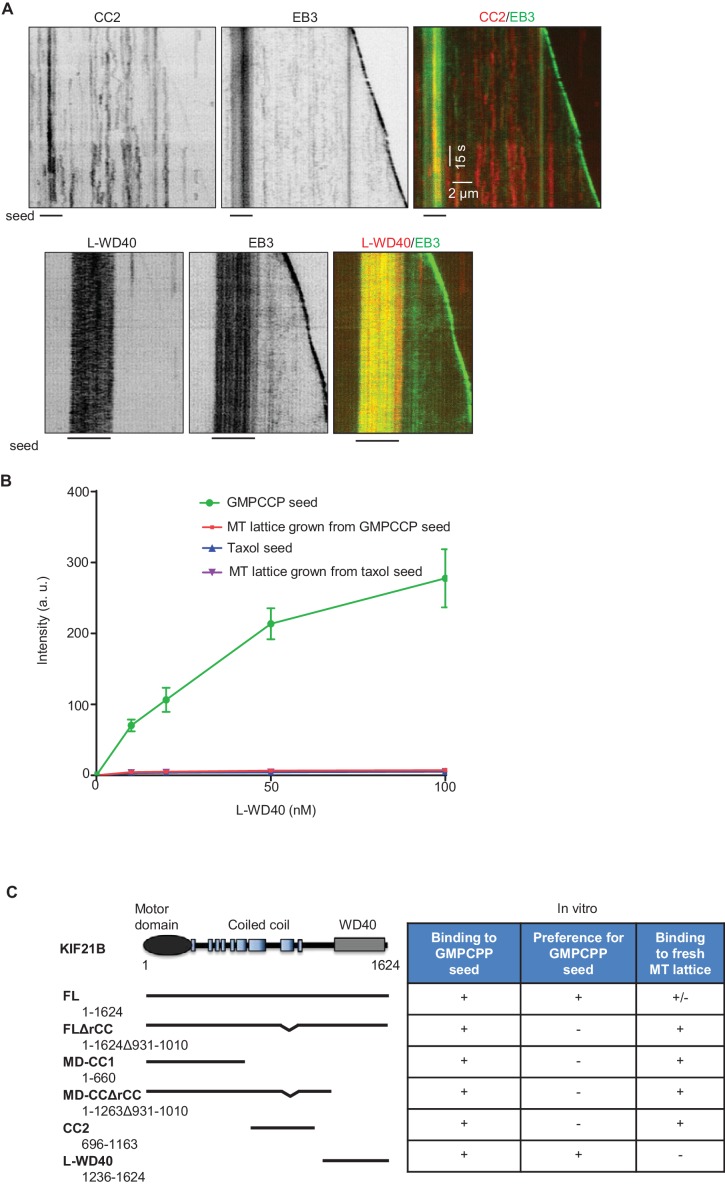
If the rCC does not fully inhibit the full-length KIF21B motor, what is the function of this region? To address this question, we have purified the KIF21B protein lacking the rCC (KIF21B-FL-ΔrCC), and a shorter version of this protein, which also lacked the WD40 domain (KIF21B-MD-CCΔrCC) (Figure 2—figure supplement 1). Mass spectrometry analysis demonstrated that the contaminants present in these two KIF21B preparations were essentially the same as in the isolated full-length KIF21B (Supplementary file 1). Analysis of fluorescence intensity and photobleaching confirmed that both deletion mutants are dimers, similar to the full-length molecule (Figure 7A, Supplementary file 2). In vitro assays showed that unlike the full-length protein, both kinesins lacking the rCC could land not only on GMPCPP-seeds but also on newly polymerized MT lattices (Figure 7B). Both full-length KIF21B and KIF21B-FL-ΔrCC exhibited slower motility on seeds compared to fresh GDP-MT lattices (Figure 7C). In contrast, the KIF21B-MD-CCΔrCC protein showed no reduced velocity on the MT lattice (Figure 7B,C), suggesting that the C-terminal WD40-containing region creates friction on GMPCPP-seeds. Consistent with this notion, we found that the L-WD40-GFP fragment displayed high preference for GMPCPP-seeds in vitro, both when present in cell extracts and in purified form, while the CC2 fragment showed no such preference (Figure 7D, Figure 7—figure supplement 1A–C). The preference for the GMPCPP seeds was not due to their attachment to glass or inclusion of biotinylated tubulin, because L-WD40-GFP showed no preference for taxol-stabilized MT seeds prepared in the same way as the GMPCPP seeds (Figure 7D, Figure 7—figure supplement 1B,C). However, we did not observe any accumulation of L-WD40-GFP at the growing MT plus ends, indicating that the preference for a specific nucleotide state is not sufficient to induce plus-end tracking of this protein fragment.

Figure 7. The WD40 domain and the autoinhibitory coiled coil region contribute to the pause-promoting activity of KIF21B.

(A) Histograms of fluorescence intensities at the initial moment of observation of single molecules of the indicated proteins immobilized on coverslips (symbols) and the corresponding fits with lognormal distributions (lines). n = 3907, 5002, 6725 and 6943 molecules; fluorophore density was 0.19, 0.24, 0.30 and 0.33 µm−2 for GFP, GFP-EB3, KIF21B-FL-ΔrCC-GFP and KIF21B-MD-CCΔrCC-GFP proteins. Insets show representative photobleaching traces of individual molecules (background subtracted). (B) Kymographs illustrating the behavior of the indicated deletion mutants of KIF21B at 3 nM concentration on dynamic MTs in the presence of 100 nM mCherry-EB3. GMPCPP-stabilized MT seeds were labeled with Rhodamine-tubulin (lines below kymographs). Kymographs were generated from the movies acquired using Photometrics Evolve 512 EMCCD (Roper Scientific) camera (stream acquisition with an exposure time of 500 ms). (C) Quantification of the velocity of KIF21B-FL-GFP and the deletion mutants on seeds and freshly polymerized MT lattices, shown in Figures 3A and 7B. Seed: n = 295 for KIF21B-FL-GFP, n = 195 for KIF21B-FL-ΔrCC-GFP, n = 434 for KIF21B-MD-CCΔrCC-GFP; lattice: n = 131 for KIF21B-FL, n = 133 for KIF21B-FL-ΔrCC-GFP, n = 434 for KIF21B-MD-CCΔrCC-GFP. Data are from two or three independent experiments. Values significantly different from each other are indicated by asterisks, p<0.0001, Mann-Whitney U test. (D) Kymographs illustrating the interaction of purified GFP-L-WD40 (100 nM) with dynamic MTs grown from Rhodamine-tubulin labeled GMPCPP- or taxol-stabilized seeds (as indicated) in the presence of 20 nM mCherry-EB3. Kymographs were generated from the movies acquired in stream acquisition mode with an exposure time of 500 ms using Photometrics Evolve 512 EMCCD camera (Roper Scientific). (E) Kymographs illustrating the behavior of KIF21B deletion mutants on dynamic MTs in the presence of 20 nM mCherry-EB3 and 3% Rhodamine-tubulin. Pauses and KIF21B detachment from a depolymerizing MT end are indicated by arrows and asterisks, respectively. Arrowheads indicate kinesin detachment from the growing MT tip. Kymographs were generated from the movies acquired using CoolSNAP HQ2 CCD camera (Roper Scientific) with a 1.2-s interval between frames and an exposure time of 100 ms. (F) Quantification of MT growth rate in vitro in the presence of 15 µM tubulin with 20 nM mCherry-EB3 alone (n = 71) or together with 3 nM KIF21B-FL-ΔrCC-GFP (n = 79) or KIF21B-MD-CCΔrCC-GFP (n = 79). MTs were grown in the presence of 3% Rhodamine-tubulin. two independent experiments. (G) Quantification of different events observed after KIF21B-FL or its mutants reach a growing MT plus end. Data shown in Figure 3E are included here for comparison. n = 501 for KIF21B-FL-ΔrCC-GFP, n = 647 for KIF21B-MD-CCΔrCC-GFP. Data are from at least two independent experiments. (H) Percentage of pausing events induced by a single event of kinesin arrival from all detected pauses. Total number of pausing events: n = 51 for KIF21B-FL-GFP, n = 46 for KIF21B-FL-ΔrCC-GFP, n = 22 for KIF21B-MD-CCΔrCC-GFP. Data are from at least two independent experiments. (I) Quantification of the duration of MT pausing induced by a single kinesin arrival event at the growing MT plus end. n = 36 for KIF21B-FL-GFP, n = 8 for KIF21B-FL-ΔrCC-GFP, n = 3 for KIF21B-MD-CCΔrCC-GFP. Data are from at least two independent experiments.**p<0.0001, *p<0.0004 Mann-Whitney U test. (J) Model for the regulation of KIF21B motility and pause induction by the tail domain. In solution, KIF21B motor domains are inhibited by the regulatory region, while the WD40 domains are available for the interaction with MTs; WD40 domains show preference for the GMPCPP-stabilized seeds (red). After binding to seeds, KIF21B becomes activated and can walk to the plus end; it is likely that both the WD40 and the CC2 region contribute to MT binding. The kinesin can transfer from the seed to the freshly polymerized MT lattice; the interaction of the CC2 but not of the WD40 with the lattice promotes motor processivity. At the tip, the conversion to the autoinhibited conformation and the WD40 domain can prevent KIF21B from stepping off the MT plus end. This allows the motor to prevent both elongation and shortening of a small number of protofilaments with which it interacts. The remaining protofilaments might undergo short excursions of growth and shrinkage (upper panel); alternatively, they might elongate for some time and such an incomplete MT will be prone to bending and catastrophe (lower panel).

DOI: http://dx.doi.org/10.7554/eLife.24746.035

Figure 7—source data 1. An excel sheet with numerical data on the quantification of KIF21B mutants dimer analysis, photobleaching step analysis, velocities on seeds and MT lattices, MT growth rate in vitro and outcomes of the arrival of KIF21B mutants at MT plus ends, represented as plots in Figure 7A,C,F–I.
DOI: 10.7554/eLife.24746.036

Figure 7.

Figure 7—figure supplement 1. Characterization of KIF21B tail fragments in vitro.

Figure 7—figure supplement 1.

(A) In vitro reconstitution of MT dynamics in the presence of 100 nM GFP-EB3 and the extracts of HEK293T cells expressing mCherry-CC2 or mCherry-L-WD40. GMPCPP-stabilized MT seeds were labeled with HiLyte Fluor 488-tubulin (lines below kymographs). (B) Quantification of the intensity of purified GFP-L-WD40 on GMPCPP- and taxol-stabilized seeds or dynamic MTs grown from GMPCCP or taxol-stabilized seeds. (C) Overview of the interactions of GFP-tagged KIF21B and its deletion mutants with MTs in vitro.
Figure 7—figure supplements 1—source data 1. An excel sheet with numerical data on the quantification of the intensity of KIF21B-L-WD40 on seeds and dynamic MTs represented as plot in Figure 7—figure supplement 1B.
elife-24746-fig5.xlsx (10KB, xlsx)
DOI: 10.7554/eLife.24746.038

We next examined the ability of the two KIF21B mutants to affect MT growth. Similar to the full-length molecule, both proteins showed a high degree of processivity, with run lengths of up to ~8–8.5 µm (Figure 7E). The two mutants had no effect on MT depolymerization, as they detached from shrinking MTs (asterisks in Figure 7E). Both mutants reduced MT growth rate, similar to the full-length KIF21B and the KIF21B-MD-CC1 mutant (Figure 7F). Furthermore, upon arrival to the growing MT plus end, the two mutants could cause MT pausing and induce catastrophes, again similar to what was observed with the full-length molecule (Figure 7E,G). However, both mutated motors were much less potent than full-length KIF21B, because in the majority of the cases (~60%), the mutated motors detached from the MT tip without pausing MT growth (Figure 7G). The pauses induced by the two mutant kinesins were typically due to the presence of multiple independently arriving motors (Figure 7E,G,H), and the duration of pauses induced by a single arrival event of either KIF21B-FL-ΔrCC or KIF21B-MD-CCΔrCC were significantly shorter than those triggered by the full-length KIF21B protein (Figure 7I). Taken together, these results suggest that both the regulatory rCC region and the C-terminal WD40-containing domain can contribute to the ability of KIF21B to stay attached to the growing MT plus end and to induce pausing (Figure 7J).

Discussion

In this study, we showed that KIF21B is a highly processive MT plus-end directed motor, which can potently induce pausing of MT plus ends. This activity depends on several regions of this large motor protein. The N-terminally located motor domain is motile, thus ensuring protein accumulation at the MT plus ends, and similar to the motor domains of other kinesin-4 family members, it slows down MT polymerization (Bieling et al., 2010; Bringmann et al., 2004; van der Vaart et al., 2013). The dimeric version of the motor is sufficient to reduce MT growth, even though it does not accumulate at the MT tips. It is possible that KIF21B motors arriving at the MT tip somehow affect the conformation of terminal tubulin dimers, and in this way transiently perturb the structure of the polymerizing MT end. Our analysis of EB3 intensity in the presence of a low concentration of KIF21B-MD-CC1 supports this idea.

Importantly, in contrast to the full-length kinesin, the dimeric version of the motor domain alone does not show high processivity or the ability to stay attached to growing MT plus ends, thereby inducing their pausing. These properties are conferred by the stalk and the tail regions of the protein, which constitute two separate MT-binding sites. The presence of additional MT-binding domains is quite common in kinesins and has been established for kinesin-1, kinesin-5, kinesin-8 family members and CENP-E (Gudimchuk et al., 2013; Navone et al., 1992; Stumpff et al., 2011; Su et al., 2011; van den Wildenberg et al., 2008; Weaver et al., 2011). These domains are often basic polypeptide regions that can interact with the negatively charged surface of MTs. The distinguishing feature of KIF21B is the presence of a C-terminal WD40 domain involved in MT binding together with the adjacent positively charged linker region. The combined MT-binding activity of a folded domain augmented by a basic polypeptide region is reminiscent of that found in other MAPs such as EBs, CLIPs and the Ndc80 complex, in which globular calponin homology or CAP-Gly domains cooperate with positively charged linkers for MT binding (Alushin et al., 2012; Hoogenraad et al., 2000; Komarova et al., 2009). An interesting feature of the KIF21B C-terminus is its ability to distinguish between different types of MT lattices, as it binds much better to GMPCPP than to taxol-stabilized GDP-MTs. This property has an impact on the full-length protein, as the WD40 domain promotes the binding of KIF21B to GMPCPP seeds and slows down its motility on the seeds. Since GMPCPP-MTs are believed to mimic certain features of the GTP-MT lattice (Alushin et al., 2014), which is enriched at growing MT plus ends, it is tempting to speculate that in the context of the full-length protein this property helps to prevent kinesin detachment from the polymerizing plus ends. We should note, however, that the mechanistic basis of the preference of the L-WD40 fragment of KIF21B for the GMPCPP lattice is unclear, and it is not sufficient to confer MT plus-end tracking behavior. It is possible that at growing MT plus ends the number of binding sites for which the C-terminus of KIF21B would have preference or its affinity for these sites would be affected by protofilament curvature (Brouhard and Rice, 2014). Still, it could act in concert with other MT-binding domains of KIF21B to increase the bias for end-binding.

Another feature that helps to prevent the detachment of KIF21B from the MT plus end once it arrives at the tip is the presence of the autoregulatory region. Autoinhibition mechanisms that prevent motility of the cargo-unbound motors are common in different kinesins, including kinesin-1, kinesin-2 and the close KIF21B homologue KIF21A (van der Vaart et al., 2013; Verhey and Hammond, 2009). However, in contrast to other autoinhibited kinesins, which require an activating partner, KIF21B proteins can still interact with MTs through the binding of the WD40 domain-containing tail with MTs. In our in vitro assays, the WD40 region induces a strong preference of the motor for GMPCPP-MTs, suggesting that the motor domains are autoinhibited, while the WD40 domains are available for MT binding (Figure 7J). KIF21B with a deleted WD40 domain is fully autoinhibited, which indicates that the interaction between the motor and the rCC blocks the ability of both the motor and the MT-binding stalk (CC2 region) to interact with MTs.

Once the motor is loaded on an MT, the autoinhibition is relieved and the motor starts to walk. It is possible that both the WD40 and the MT-binding CC2 regions contribute to the processivity of KIF21B (Figure 7J). We observe frequent detachment of full-length motors at the border between the GMPCPP-seed and the GDP-MT lattice, suggesting that KIF21B might be switching back to an autoinhibited state. Such switching might be stimulated by the presence of MT lattice defects at the border between the seed and the freshly grown lattice. In contrast, motors lacking the rCC region land more easily on dynamic MT lattices and pass more frequently to such lattices from GMPCPP-seeds. The motors that do move along the GDP-MT lattice are highly processive, most likely due to the MT-binding CC2 domain in the stalk region, because the KIF21B-FL-ΔrCC and KIF21B-MD-CCΔrCC behave very similarly. In contrast, the KIF21B-MD-CC1, which lacks the CC2 region, displays only short runs. The WD40 domain and the interaction between the motor domains and the autoregulatory rCC region become important once the kinesin reaches the growing MT plus end. KIF21B mutants lacking these regions often detach from the MT tip, while the full-length motor frequently persists and promotes pausing. It is possible that this behavior depends on the switching of the kinesin from the stepping mode to a conformation in which it attaches to the MT through its MT-binding tail domains (Figure 7J). As discussed above, in these conditions, the WD40 domain-containing C-terminus might help to recognize some structural feature of the plus end that is related to the presence of the GTP-cap.

It is striking that a few kinesins can induce a stable pause with an average duration of ~20 s, suggesting that different MT-binding domains within one molecule might interact with several protofilaments and prevent both their growth and depolymerization, thus inducing a pausing state. Noteworthy in this respect is our observation that when a MT continued growing after KIF21B was stalled, its growth was often strongly perturbed: we observed switching between growth and shortening episodes, as well as strong MT bending after the point of KIF21B attachment (Figure 7J). These data are reminiscent of our work on the effect of binding of a protofilament-blocking drug, Eribulin (Doodhi et al., 2016). We recently showed that attachment of a single Eribulin molecule, which, based on structural data can inhibit growth of only one MT protofilament, was sufficient to either cause a catastrophe or induce MT growth perturbation, suggesting elongation of an incomplete MT (Doodhi et al., 2016). It is tempting to speculate that similar to Eribulin, a KIF21B molecule stalled at the MT tip would be sufficient to block a small number of protofilaments, and this would result in inefficient elongation of the remaining protofilaments. Importantly, in contrast to Eribulin, KIF21B can also stabilize the protofilaments which it blocks, and therefore it is able to prevent, at least for some time, MT depolymerization. The resulting event often appears as a pause at the level of fluorescence microscopy, although the protofilaments that are not occluded by KIF21B are still likely to be dynamic (Figure 7J). The presence of multiple KIF21B molecules would result in blocking and stabilization of more protofilaments and thus more effective pausing, as we have observed. KIF21B-induced pausing events were typically followed by a catastrophe. This is in line with the slow retraction of the whole MT network observed in KIF21B-overexpressing cells (Figure 1—figure supplement 1A), which can be explained by the gradual loss of tubulin subunits from KIF21B-stabilized MT plus ends.

The effects induced by purified KIF21B in vitro are partly consistent with the recent analyses of MT plus-end dynamics in neuronal cells (Ghiretti et al., 2016; Muhia et al., 2016), in which a reduction of MT growth processivity was observed upon Kif21b knockout or depletion. This observation is in line with the idea that the presence of KIF21B induces either catastrophes or pausing, since both types of events would cause disappearance of an EB-positive comet. The effects on MT growth rate were opposite in the two studies: a decrease in MT growth rate was observed in knockout cells, while an increase was seen after RNA interference-mediated knockdown of KIF21B (Ghiretti et al., 2016; Muhia et al., 2016). These complexities might be due to some indirect effects on the tubulin pool or other MAPs, and are therefore difficult to compare to our in vitro analyses.

Ghiretti et al. (2016) also carried out in vitro experiments with purified KIF21B and its fragments. Similar to our study, they have identified a MT-binding domain in the stalk of the kinesin, but since MT binding was only investigated by co-pelleting assays with stabilized MTs, the WD40-containing C-terminal MT-binding region was not detected in these experiments, consistent with our observation that this domain does not bind to taxol-stabilized MTs. We note that the results of the analyses of the effect of KIF21B on MT dynamics were very different from ours, as the full length KIF21B, although motile in cells, did not seem to display a motile behavior in vitro even at 300 nM concentration and mostly associated with depolymerizing MT ends. However, it could still increase the polymerization rate and promote catastrophes of growing MT plus ends (Ghiretti et al., 2016). In contrast, in our experiments, 3–5 nM KIF21B was sufficient to block MT outgrowth from seeds at different tubulin concentrations. Furthermore, we did not observe KIF21B accumulation on depolymerizing MT ends, and the impact of KIF21B on MT growth (pausing, growth perturbation or catastrophe induction) was strongly associated with motile motors ‘catching up’ with growing MT plus ends. Finally, while in our experiments the KIF21B motor alone could slow down MT growth at 2–10 nM, Ghiretti et al. observed no effect of a similar construct even at 300 nM. We attribute these discrepancies to the differences in kinesin preparations and assay conditions (e.g. different ionic strength of the assay buffer, which seemed to be significantly lower in the experiments by Ghiretti et al. than in our study).

Our results suggest that in cells, KIF21B might use some additional factors for its loading onto MTs, and it is of course also possible that these or other factors would contribute to the association of KIF21B with MT plus ends. For example, the L-WD40 fragment of KIF21B fully decorates dynamic MTs in cells while it fails to do so in our in vitro assays, suggesting involvement of additional MAPs or post-translational modifications of tubulin. Further, an interesting implication of the observation that KIF21B is highly processive is that it is expected to display a stronger accumulation and thus a stronger pausing effect on the plus ends of longer MTs. Such a length-dependent effect would be similar to that described for other processive kinesins regulating MT plus-end dynamics (Hibbel et al., 2015; Su et al., 2012; Varga et al., 2006). It is possible that MT length-dependent regulation of pausing or catastrophe might help to achieve more uniform MT lengths in long neurites of neuronal cells, where MT growth is not bounded by the cell margin. In addition, since KIF21B can bind to one MT and step on another one, it might also play a role in organizing MT arrays by sliding MTs against each other. KIF21B is thus an interesting player in the cell’s versatile toolbox responsible for MT-based transport and shaping of MT arrays. Changes in these arrays caused by alterations in KIF21B activity combined with its potential transport-related functions might explain the involvement of KIF21B in human diseases.

Materials and methods

DNA constructs, cell culture and transfection

We used previously described COS-7 cells (van Bergeijk et al., 2015) and HEK293T cells (Bouchet et al., 2016), which were cultured in DMEM/F10 (1/1 ratio, Lonza, Basel, Switzerland) supplemented with 10% fetal calf serum and penicillin and streptomycin. The cell lines were routinely checked for mycoplasma contamination using LT07-518 Mycoalert assay (Lonza). KIF21B expression constructs were made using human cDNA clone KIAA0449 (Kazusa DNA Research Institute, Japan) in pEGFP-N3, pEGFP-C1, mCherry-C1 or TagRFP-N3 vectors by PCR-based strategies. Additional TEV-protease recognition (ENLYFQG) and Biotinylation tag sequences (MASGLNDIFEAQKIEWHEGGG) were introduced in the EGFP vectors for protein purification purposes (as described previously, (van der Vaart et al., 2013)). Biotin ligase BirA expression construct (Driegen et al., 2005) was a gift from D. Meijer (University of Edinburgh, UK), EB3-TagRFP-T was described previously (van der Vaart et al., 2013) and TagRFP-α-tubulin was from Evrogen. Plasmids were transfected with polyethylenimine (PEI) or FuGene6 (Roche, Basel, Switzerland).

Antibodies and cell fixation

Rabbit-anti-GFP (ab290, Abcam, Cambridge, UK), mouse-anti-mCherry (632543, Clontech, CA), rat-anti-α-tubulin (YL1/2) (MA1-80017, Pierce Antibodies, MA) were used on fixed cells and Western blotting. We used the following secondary antibodies: IRDye 800CW Goat anti-rabbit and anti-mouse (Li-Cor Biosciences, Lincoln, NE), Alexa-488 and Alexa-568 conjugated goat antibodies against rat IgG (Molecular Probes, Eugene, OR).

For tubulin staining, COS-7 cells were fixed with –20°C methanol for 10 min and subsequently fixed with 4% paraformaldehyde (PFA) in phosphate-buffered saline (PBS) for 15 min at RT. Cell membranes were permeabilized with 0.1% Triton X-100 in PBS and washed with 0.1% Tween-20 in PBS. Blocking and labeling were done in 0.1% Tween-20 in PBS supplemented with 1% bovine albumin serum. Slides were rinsed with 70% ethanol in the last wash step, air-dried and mounded in Vectashield mounting medium (Vector laboratories, Burlingame, CA).

For the nocodazole wash-out, cells were treated with 5 µM nocodazole for 2 hr, subsequently washed four times and re-incubated in normal culture medium at 37°C for indicated time points. Cells were fixed and stained as described above. All cell biological experiments were performed at least twice.

Streptavidin pull down assays

Bio-GFP-tagged bait constructs and mCherry-tagged prey constructs were cotransfected in HEK293T cells. A construct encoding BirA was co-transfected to induce biotinylation of the Bio-tag. Cell lysates were prepared in 20 mM Tris pH7.5, 100 mM NaCl, 1% Triton-X100, 1x cOmplete protease inhibitor cocktail tablet (Roche) and incubated with M-280 Streptavidin Dynabeads (Invitrogen, CA) for 1 hr. Samples were washed three times in 20 mM Tris pH 7.5, 100 mM NaCl, 0.1% Triton-X100 and analyzed by SDS-PAGE and Western blotting.

Protein purification from HEK293T cells

Constructs tagged with GFP-TEV-Bio were co-transfected with BirA in HEK293T cells as described for streptavidin pull down assays. Cell lysates were prepared in 50 mM Hepes pH 7.4, 300 mM NaCl, 1 mM MgCl2, 0.5% Triton-X100, 1 mM DTT, 1x cOmplete protease inhibitor cocktail tablet (Roche) and incubated with M-280 Streptavidin Dynabeads (Invitrogen) for one hour. Samples were subsequently washed with 50 mM Hepes pH 7.4, 300 mM NaCl, 1 mM MgCl2, 0.5% Triton-X100, 1 mM DTT three times and another three times with cleavage buffer (50 mM Hepes pH 7.4, 150 mM NaCl, 1 mM MgCl2, 0.05% Triton-X100, 1 mM DTT, 1 mM EGTA), after which they were incubated in cleavage buffer supplemented with 40 ng/µl (770 nM) TEV protease (Sigma-Aldrich, St Louis, MO) for 2 hr at 4°C. Supernatant was collected and stored at −80°C prior to use. Purity of the samples was analyzed via SDS-PAGE and Coomassie staining. Concentrations of stock solutions varied between ~50–250 nM for full-length KIF21B-GFP, KIF21B-FLΔrCC-GFP and KIF21B-MD-CCΔrCC-GFP, and 0.6–1.2 µM for MD-CC1-GFP and GFP-L-WD40. Strep-tag-based KIF5B-560-GFP protein purification from HEK293T cells was done using Strep(II)-streptactin affinity purification method (Sharma et al., 2016).

Recombinant protein production

cDNA encoding KIF21B rCC (residues 930–1010) were PCR amplified from a human cDNA library (Frey et al., 2007) and cloned into the pET-based bacterial expression vector PSTCm1 (Olieric et al., 2010). Subsequently, the protein was expressed in BL21 (DE3) at 37°C grown in LB media supplemented with a mixture of 50 μg/ml kanamycin and 30 μg/ml chloramphenicol to an OD600 of 0.4–0.6. Expression was induced with 0.5 mM isopropyl 1-thio-β- galactopyranoside (IPTG; Sigma-Aldrich) and grown overnight at 20°C. Cell pellets were resuspended in lysis buffer (50 mM HEPES, pH 8, 500 mM NaCl, 10 mM Imidazole, 10% glycerol, 2 mM β-mercaptoethanol and 1 cOmplete EDTA-free protease inhibitor cocktail tablet (Roche) and lysed on ice by ultrasonication. Lysates were cleared by ultracentrifugation. Resulting supernatants were subsequently filtered (0.45 µm filter). The protein was affinity purified by IMAC on a 5 ml HisTrap FF Crude column (GE Healthcare, Chicago, Illinois) according to manufacturer’s instructions. The 6xHis tag was cleaved using 2 units of human thrombin (Sigma-Aldrich) per milligram of recombinant protein and cleavage was performed over night at 4°C by dialysis in thrombin cleavage buffer (20 mM Tris-HCl pH 7.4, 150 mM NaCl, 2.5 mM CaCl2 and 2 mM DTT). The 6xHis tag was separated from the target protein by re-application to the IMAC column. The processed protein was concentrated and further purified by size exclusion chromatography on a HiLoad Superdex 75 16/60 size-exclusion column (GE Healthcare) equilibrated in 20 mM Tris-HCl, pH 7.5, supplemented with 150 mM NaCl and 2 mM DTT.

Biophysical characterization of the rCC fragment of KIF21B

CD spectra were recorded at 5°C and at a protein concentration of 0.166 mg/ml in PBS supplemented with 0.5 mM TCEP using a Chirascan spectropolarimeter (Applied Photophysics Ltd, Leatherhead, UK) and a cuvette of 0.1 cm path length. Thermal unfolding profiles between 5°C and 90°C were recorded by increasing the temperature at a ramping rate of 1°C/min monitoring the CD signal at 222 nm. Midpoints of thermal unfolding were calculated using the Glob3 program (Applied Photophysics).

Sedimentation velocity experiments were performed at 20°C and 42,000 rpm in Tris-HCl, pH 7.5, 150 mM NaCl, 2 mM DTT using a Beckman XLI analytical ultracentrifuge (Beckman Coulter Inc., CA). Sedimentation profiles were recorded by UV absorbance (280 nm) and interference scanning optics. The partial specific volume of the samples as well as the density and viscosity of the buffer were calculated with SEDNTERP (http://sednterp.unh.edu/). Data were fitted with SEDFIT (Schuck, 2000) using the continuous distribution model. Graphical representations were processed with GUSSI (biophysics.swmed.edu/MBR/software.html).

In vitro analysis of MT dynamics

In vitro assays were performed as described previously (van der Vaart et al., 2013). MT seeds were grown using 20 μM tubulin mix containing 18% biotin-tubulin and 12% Rhodamine- or HiLyte Fluor 488-tubulin (Cytoskeleton, Inc., Denver, CO) and 1 mM GMPCPP by polymerization at 37°C for 30 min, pelleting by centrifugation in an Airfuge for 5 min and depolymerization on ice. After a subsequent round of polymerization and pelleting, seeds were stored in MRB80 buffer (80 mM K-PIPES, pH 6.8, 4 mM MgCl2, 1 mM EGTA) with 10% glycerol. Flow chambers were made with microscopy slides and plasma-cleaned glass coverslips. Coating was done with 0.2 mg/ml PLL-PEG-biotin (Surface Solutions, Dübendorf, Switzerland) in MRB80 buffer and 0.8 mg/ml NeutrAvidin for 5 min each. The seeds were attached to the coverslips via biotin-NeutrAvidin links and blocked with 0.8 mg/ml κ-casein. Reaction mixtures consisting of MRB80 supplemented with different concentrations of tubulin (indicated in figure legends), containing 3% Rhodamine-tubulin when indicated, 50 mM KCl, 0.1% methylcellulose, 0.5 mg/ml κ-casein, 1 mM GTP, oxygen scavenging system (20 mM glucose, 200 μg/ml catalase, 400 μg/ml glucose-oxidase, 4 mM DTT), 2 mM ATP, 20 or 100 nM mCherry-EB3 when indicated and the specified concentration of purified GFP or KIF21B-GFP proteins (stored in 50 mM Hepes pH 7.4, 150 mM NaCl, 1 mM MgCl2, 0.05% Triton-X100, 1 mM DTT, 1 mM EGTA, 770 nM TEV protease and diluted by at least 10 or more times in MRB80 buffer for in vitro assays) or KIF5B-560 (stored in 50 mM Hepes pH 7.4, 150 mM NaCl, 1 mM MgCl2, 0.05% Triton-X100, 1 mM DTT, 1 mM EGTA, 2.5 mM d-Desthiobiotin and diluted 20 times in MRB80 buffer for in vitro assays) were added to the flow chambers. Movies were collected using TIRF microscopy. For mCherry-CC2 and mCherry-L-WD40, extracts of HEK293T cells expressing the proteins, prepared in MBR80 supplemented with 1x cOmplete protease inhibitor cocktail tablet (Roche) and 1% Triton-X100, were used in the reaction mixture in a ratio of 1:4. All samples were incubated at 30°C during imaging. The quantitative data reported for each experiment were collected in at least two or more independent assays.

Image acquisition and processing

Fixed cells were imaged with a Nikon Eclipse 80i upright fluorescence microscope equipped with Plan Apo VC N.A. 1.40 oil 100x and 60x objectives, or Nikon Eclipse Ni-E upright fluorescence microscope equipped with Plan Apo Lambda 100x N.A. 1.45 oil and 60x N.A. 1.40 oil objectives microscopes, Chroma ET-BFP2, - GFP or -mCherry filters and Photometrics CoolSNAP HQ2 CCD (Roper Scientific, Trenton, NJ) camera. The microscopes were controlled by Nikon NIS Br software.

Live cell imaging and in vitro assays were performed on an inverted research microscope Nikon Eclipse Ti-E (Nikon) with the perfect focus system (PFS) (Nikon), equipped with Nikon CFI Apo TIRF 100 × 1.49 N.A. oil objective (Nikon, Tokyo, Japan), Photometrics Evolve 512 EMCCD (Roper Scientific) and Photometrics CoolSNAP HQ2 CCD (Roper Scientific) and controlled with MetaMorph 7.7 software (Molecular Devices, CA). The microscope was equipped with TIRF-E motorized TIRF illuminator modified by Roper Scientific France/PICT-IBiSA, Institut Curie, and an ET-GFP filter set (Chroma, Bellow Falls, VT) for imaging of GFP-tagged proteins. For simultaneous imaging of green and red fluorescence we used triple-band TIRF polychroic ZT405/488/561rpc (Chroma) and triple-band laser emission filter ZET405/488/561m (Chroma), mounted in the metal cube (Chroma, 91032) together with Optosplit III beamsplitter (Cairn Research Ltd, Faversham, UK) equipped with double emission filter cube configured with ET525/50m, ET630/75m and T585LPXR (Chroma).

Long-term imaging was performed on an inverted research microscope Nikon Ti equipped with Plan Fluor 40x/1.30 Oil DIC and Plan Apochromat 20 × 0.75 Phase Contrast objectives, ET-GFP (49002) and ET-mCherry (49008) filters (Chroma) and controlled with MicroManager.

Cells were kept at 37°C, and in vitro samples at 30°C in a Tokai Hit INUBG2E-ZILCS Stage Top Incubator. Images and movies were processed using ImageJ. All images were modified by adjustments of brightness and contrast; smooth and sharp masks were applied in some cases. Maximum intensity projections were made using z projection. MT growth rates and kinesin velocities were obtained from kymograph analysis, using ImageJ plugin KymoResliceWide v.0.4 https://github.com/ekatrukha/KymoResliceWide (Katrukha, 2015); copy archived at https://github.com/elifesciences-publications/KymoResliceWide). Results were plotted in Graphpad Prism 6. Statistical analysis was performed using non-parametric Mann-Whitney U-test.

Tracking and single molecule intensity analysis

To build single molecule fluorescence histograms (Figure 2A, Figure 3—figure supplements 1A), purified GFP or GFP-fusion proteins were diluted in phosphate buffered saline (PBS) and added to the different imaging flow chambers of the same plasma cleaned coverslips. Chambers were subsequently washed with PBS, leaving a fraction of the GFP-tagged proteins immobilized on the coverslip. After sealing with vacuum grease to prevent evaporation, samples were imaged at room temperature using TIRF microscopy. Protein dilution was optimized to provide images of 0.1–0.4 fluorophores per µm2 for each condition. At least 20 images were acquired at different positions on the coverslip to avoid pre-bleaching. ImageJ plugin DoM_Utrecht v.0.9.1 https://github.com/ekatrukha/DoM_Utrecht (Katrukha et al., 2016); copy archived at https://github.com/elifesciences-publications/DoM_Utrecht) was used for detection and fitting of single molecule fluorescent spots as described previously (Yau et al., 2014).. In short, individual spots were fitted with 2D Gaussian and the amplitude of the fitted Gaussian function was used as a measure of the fluorescence intensity value of an individual spot. The same parameter was used to build histograms in Figure 2A, Figure 3—figure supplements 1A and 7A. The histograms were fitted to lognormal distributions using GraphPad Prism 6.

To estimate the number of GFP molecules per kinesin (Figure 5B–H), KIF5B-560 and KIF21B-FL moving along the lattice of MTs in the different imaging flow chambers of the same plasma cleaned coverslips were analyzed and compared. ImageJ plugin DoM_Utrecht v.0.9.1 was used for detection and fitting of single molecule fluorescent spots. The histograms were fitted to lognormal distributions using GraphPad Prism 6. For MT pausing events induced by kinesin (Figure 5A), particles on the MT lattice and tip were detected using ComDet v.0.3.5 https://github.com/ekatrukha/ComDet (Katrukha, 2016); copy archived at https://github.com/elifesciences-publications/ComDet) and DoM_Utrecht v.0.9.1 (Katrukha et al., 2016) ImageJ plugins. Their single molecule intensity values were normalized to the average intensity of GFP-kinesins non-specifically attached to the coverslip in areas devoid of MTs.

Kinesin intensity and position for Figure 3C, Figure 3—figure supplement 2, Figure 4A,B were calculated using the same plugins. The position of MT tip was estimated from fitting of each x-profile of corresponding kymograph with error function with offset using custom written Matlab script.

All mentioned ImageJ plugins have source code available and are licensed under open-source GNU GPL v3 license.

To monitor the decay of fluorescence caused by photobleaching, single particles of KIF21B-FL-GFP were immobilized on the surface of a coverslip. Movies were recorded at 100 ms/stream acquisition for 100s or at 100 ms/1 frame per 1.2 s for 720s with low laser power (same laser power used for imaging in Figures 35 and 7) to allow KIF21B-FL-GFP to be photobleached. GraphPad Prism 6 software was used for the data fitting.

MT pelleting and electron microscopy

Taxol- or GMPCPP-stabilized MTs were polymerized to a final concentration of 10 μM as described (Kevenaar et al., 2016). Afterwards, 50 µl of 0.19 µM of HEK293T purified full length KIF21B was incubated together with 0.45 μM stabilized MTs for 10 min at room temperature. As a control, the same amount of MTs was incubated separately. A taxol-glycerol cushion containing 55% 2x BRB80 buffer (80 mM K-PIPES, pH 6.8, 1 mM EGTA, 1 mM MgCl2), 44% glycerol and 6% 2 mM paclitaxel was added to the centrifugation tubes prior to sample addition. After centrifugation of the samples at 174,500 x g for 10 min, the supernatants were carefully removed and the pellets were resuspended in 50 μl BRB80 buffer. Twenty microliters of each supernatant and pellet were mixed with 5 μl 5x SDS loading dye and analyzed on Coomassie stained 7.5% SDS-PAGE.

For negative staining electron microscopy, 5 μl aliquots of pellet samples prepared in the presence of either 1 µM taxol or 1 µM GMPCPP were transferred to freshly UV activated homemade carbon-coated copper grids. After 20 s of incubation, excess liquid was removed by side-blotting and the grids were washed twice with BRB80 buffer supplemented with either 1 µM taxol or 1 µM GMPCPP and once with double distilled water. Subsequently, the grid was stained three times with a freshly prepared uranyl acetate solution. Electron micrographs were taken at a nominal magnification of 40 k with a JEM2200FS (JEOL, Peabody, MA) electron microscope operated at 200 kV and equipped with a TVIPS F416 camera.

Mass spectrometry

Samples of purified proteins were ran on SDS-PAGE gel (150 ng FL, 30 ng FLΔrCC, 45 ng MD-CCΔrCC, 255 ng L-WD40, 150 ng MD-CC1). After in-gel digestion, samples were resuspended in 10% formic acid (FA)/5% DMSO and were analyzed with an Agilent 1290 Infinity (Agilent Technologies, CA) LC, operating in reverse-phase (C18) mode, coupled to a TripleTOF 5600 (AB Sciex, Nieuwerkerk aan de IJssel, Netherlands). MS spectra (350–1250 m/z) were acquired in high-resolution mode (R > 30,000), whereas MS2 in high-sensitivity mode (R > 15 000).

Raw files were processed using Proteome Discoverer 1.4 (version 1.4.0.288, Thermo Scientific, Bremen, Germany). The database search was performed using Mascot (version 2.4.1, Matrix Science, UK) against a Swiss-Prot database (taxonomy human). Carbamidomethylation of cysteines was set as a fixed modification and oxidation of methionine was set as a variable modification. Trypsin was specified as enzyme and up to two miss cleavages were allowed. Data filtering was performed using percolator, resulting in 1% false discovery rate (FDR). Additional filters were; search engine rank 1 peptides and ion score >20.

Acknowledgements

We thank Dr. D Meijer (University of Edinburgh, UK) for the gift of BirA construct. This work was supported by the Netherlands Organization for Scientific Research grants: an ALW NWO VICI grant 865.08.002 to AA, an ALW NWO VICI grant 865.10.010 to CCH, a CW ECHO grant 711.011.005 to AA and AJRH, and as part of the National Roadmap Large-scale Research Facilities of the Netherlands (project number 184.032.201). The work was also supported by an ERC Synergy grant 609822 to AA and a grant of the Swiss National Science Foundation (310030B_138659 and 31003A_166608) to MOS.

Funding Statement

The funders had no role in study design, data collection and interpretation, or the decision to submit the work for publication.

Funding Information

This paper was supported by the following grants:

  • Nederlandse Organisatie voor Wetenschappelijk Onderzoek 865.08.002 to Anna Akhmanova.

  • European Research Council 609822 to Anna Akhmanova.

  • Schweizerischer Nationalfonds zur Förderung der Wissenschaftlichen Forschung 310030B_138659 to Michel O Steinmetz.

  • Nederlandse Organisatie voor Wetenschappelijk Onderzoek 865.10.010 to Casper C Hoogenraad.

  • Nederlandse Organisatie voor Wetenschappelijk Onderzoek 711.011.005 to Albert JR Heck, Anna Akhmanova.

  • Nederlandse Organisatie voor Wetenschappelijk Onderzoek 184.032.201 to Albert JR Heck.

  • Schweizerischer Nationalfonds zur Förderung der Wissenschaftlichen Forschung 31003A_166608 to Michel O Steinmetz.

Additional information

Competing interests

The authors declare that no competing interests exist.

Author contributions

WEvR, Conceptualization, Data curation, Formal analysis, Validation, Investigation, Visualization, Methodology, Writing—original draft.

AR, Conceptualization, Data curation, Formal analysis, Validation, Investigation, Visualization, Methodology, Writing—review and editing.

SB, Conceptualization, Data curation, Validation, Investigation, Visualization, Methodology, Writing—original draft, Writing—review and editing.

EAK, Data curation, Formal analysis, Validation, Visualization, Methodology, Writing—original draft, Writing—review and editing.

QL, Data curation, Formal analysis, Investigation, Writing—review and editing.

AJRH, Formal analysis, Funding acquisition, Methodology, Writing—review and editing.

CCH, Funding acquisition, Methodology, Writing—original draft, Project administration.

MOS, Formal analysis, Funding acquisition, Methodology, Writing—original draft, Project administration, Writing—review and editing.

LCK, Conceptualization, Formal analysis, Supervision, Methodology, Writing—original draft, Writing—review and editing.

AA, Conceptualization, Supervision, Funding acquisition, Writing—original draft, Project administration, Writing—review and editing.

Additional files

Supplementary file 1. Analysis of purified KIF21B and its deletion mutants used in this study by mass spectrometry.

Samples of purified KIF21B proteins were loaded on SDS-PAGE, isolated from the gel after in-gel digestion and subsequently analyzed by mass spectrometry to test for purity. All identified proteins are included in Supplementary file 1in alphabetical order. Indicated are the molecular weight and the number of unique peptides found for identified proteins in the different KIF21B samples. In total, 121 proteins were identified for KIF21B-FL-GFP, 183 for KIF21B-FL-ΔrCC-GFP, 107 for KIF21B-MD-CCΔrCC-GFP, 92 for GFP-L-WD40 and 63 for KIF21B-MD-CC1-GFP.

DOI: http://dx.doi.org/10.7554/eLife.24746.039

elife-24746-supp1.docx (41.8KB, docx)
DOI: 10.7554/eLife.24746.039
Supplementary file 2. Lognormal (best fit) values for the fluorescence intensity measurements.

DOI: http://dx.doi.org/10.7554/eLife.24746.040

elife-24746-supp2.docx (18.5KB, docx)
DOI: 10.7554/eLife.24746.040

References

  1. Akhmanova A, Steinmetz MO. Control of microtubule organization and dynamics: two ends in the limelight. Nature Reviews Molecular Cell Biology. 2015;16:711–726. doi: 10.1038/nrm4084. [DOI] [PubMed] [Google Scholar]
  2. Alushin GM, Musinipally V, Matson D, Tooley J, Stukenberg PT, Nogales E. Multimodal microtubule binding by the Ndc80 kinetochore complex. Nature Structural & Molecular Biology. 2012;19:1161–1167. doi: 10.1038/nsmb.2411. [DOI] [PMC free article] [PubMed] [Google Scholar]
  3. Alushin GM, Lander GC, Kellogg EH, Zhang R, Baker D, Nogales E. High-resolution microtubule structures reveal the structural transitions in αβ-tubulin upon GTP hydrolysis. Cell. 2014;157:1117–1129. doi: 10.1016/j.cell.2014.03.053. [DOI] [PMC free article] [PubMed] [Google Scholar]
  4. Anderson CA, Massey DC, Barrett JC, Prescott NJ, Tremelling M, Fisher SA, Gwilliam R, Jacob J, Nimmo ER, Drummond H, Lees CW, Onnie CM, Hanson C, Blaszczyk K, Ravindrarajah R, Hunt S, Varma D, Hammond N, Lewis G, Attlesey H, Watkins N, Ouwehand W, Strachan D, McArdle W, Lewis CM, Lobo A, Sanderson J, Jewell DP, Deloukas P, Mansfield JC, Mathew CG, Satsangi J, Parkes M, Wellcome Trust Case Control Consortium Investigation of Crohn's disease risk loci in ulcerative colitis further defines their molecular relationship. Gastroenterology. 2009;136:523–529. doi: 10.1053/j.gastro.2008.10.032. [DOI] [PMC free article] [PubMed] [Google Scholar]
  5. Barrett JC, Hansoul S, Nicolae DL, Cho JH, Duerr RH, Rioux JD, Brant SR, Silverberg MS, Taylor KD, Barmada MM, Bitton A, Dassopoulos T, Datta LW, Green T, Griffiths AM, Kistner EO, Murtha MT, Regueiro MD, Rotter JI, Schumm LP, Steinhart AH, Targan SR, Xavier RJ, Libioulle C, Sandor C, Lathrop M, Belaiche J, Dewit O, Gut I, Heath S, Laukens D, Mni M, Rutgeerts P, Van Gossum A, Zelenika D, Franchimont D, Hugot JP, de Vos M, Vermeire S, Louis E, Cardon LR, Anderson CA, Drummond H, Nimmo E, Ahmad T, Prescott NJ, Onnie CM, Fisher SA, Marchini J, Ghori J, Bumpstead S, Gwilliam R, Tremelling M, Deloukas P, Mansfield J, Jewell D, Satsangi J, Mathew CG, Parkes M, Georges M, Daly MJ, NIDDK IBD Genetics Consortium. Belgian-French IBD Consortium. Wellcome Trust Case Control Consortium Genome-wide association defines more than 30 distinct susceptibility loci for crohn's disease. Nature Genetics. 2008;40:955–962. doi: 10.1038/ng.175. [DOI] [PMC free article] [PubMed] [Google Scholar]
  6. Bianchi S, van Riel WE, Kraatz SH, Olieric N, Frey D, Katrukha EA, Jaussi R, Missimer J, Grigoriev I, Olieric V, Benoit RM, Steinmetz MO, Akhmanova A, Kammerer RA. Structural basis for misregulation of kinesin KIF21A autoinhibition by CFEOM1 disease mutations. Scientific Reports. 2016;6:30668. doi: 10.1038/srep30668. [DOI] [PMC free article] [PubMed] [Google Scholar]
  7. Bieling P, Laan L, Schek H, Munteanu EL, Sandblad L, Dogterom M, Brunner D, Surrey T. Reconstitution of a microtubule plus-end tracking system in vitro. Nature. 2007;450:1100–1105. doi: 10.1038/nature06386. [DOI] [PubMed] [Google Scholar]
  8. Bieling P, Telley IA, Surrey T. A minimal midzone protein module controls formation and length of antiparallel microtubule overlaps. Cell. 2010;142:420–432. doi: 10.1016/j.cell.2010.06.033. [DOI] [PubMed] [Google Scholar]
  9. Bouchet BP, Gough RE, Ammon YC, van de Willige D, Post H, Jacquemet G, Altelaar AM, Heck AJ, Goult BT, Akhmanova A. Talin-KANK1 interaction controls the recruitment of cortical microtubule stabilizing complexes to focal adhesions. eLife. 2016;5:e18124. doi: 10.7554/eLife.18124. [DOI] [PMC free article] [PubMed] [Google Scholar]
  10. Bringmann H, Skiniotis G, Spilker A, Kandels-Lewis S, Vernos I, Surrey T. A kinesin-like motor inhibits microtubule dynamic instability. Science. 2004;303:1519–1522. doi: 10.1126/science.1094838. [DOI] [PubMed] [Google Scholar]
  11. Brouhard GJ, Rice LM. The contribution of αβ-tubulin curvature to microtubule dynamics. The Journal of Cell Biology. 2014;207:323–334. doi: 10.1083/jcb.201407095. [DOI] [PMC free article] [PubMed] [Google Scholar]
  12. Cheng L, Desai J, Miranda CJ, Duncan JS, Qiu W, Nugent AA, Kolpak AL, Wu CC, Drokhlyansky E, Delisle MM, Chan WM, Wei Y, Propst F, Reck-Peterson SL, Fritzsch B, Engle EC. Human CFEOM1 mutations attenuate KIF21A autoinhibition and cause oculomotor axon stalling. Neuron. 2014;82:334–349. doi: 10.1016/j.neuron.2014.02.038. [DOI] [PMC free article] [PubMed] [Google Scholar]
  13. Desai A, Mitchison TJ. Microtubule polymerization dynamics. Annual Review of Cell and Developmental Biology. 1997;13:83–117. doi: 10.1146/annurev.cellbio.13.1.83. [DOI] [PubMed] [Google Scholar]
  14. Doodhi H, Katrukha EA, Kapitein LC, Akhmanova A. Mechanical and geometrical constraints control kinesin-based microtubule guidance. Current Biology. 2014;24:322–328. doi: 10.1016/j.cub.2014.01.005. [DOI] [PubMed] [Google Scholar]
  15. Doodhi H, Prota AE, Rodríguez-García R, Xiao H, Custar DW, Bargsten K, Katrukha EA, Hilbert M, Hua S, Jiang K, Grigoriev I, Yang CP, Cox D, Horwitz SB, Kapitein LC, Akhmanova A, Steinmetz MO. Termination of protofilament elongation by eribulin induces lattice defects that promote microtubule catastrophes. Current Biology. 2016;26:1713–1721. doi: 10.1016/j.cub.2016.04.053. [DOI] [PubMed] [Google Scholar]
  16. Driegen S, Ferreira R, van Zon A, Strouboulis J, Jaegle M, Grosveld F, Philipsen S, Meijer D. A generic tool for biotinylation of tagged proteins in transgenic mice. Transgenic Research. 2005;14:477–482. doi: 10.1007/s11248-005-7220-2. [DOI] [PubMed] [Google Scholar]
  17. Frey D, Kambach C, Steinmetz MO, Jaussi R. Production of in vitro amplified DNA pseudolibraries and high-throughput cDNA target amplification. BMC Biotechnology. 2007;7:31. doi: 10.1186/1472-6750-7-31. [DOI] [PMC free article] [PubMed] [Google Scholar]
  18. Gardner MK, Odde DJ, Bloom K. Kinesin-8 molecular motors: putting the brakes on chromosome oscillations. Trends in Cell Biology. 2008;18:307–310. doi: 10.1016/j.tcb.2008.05.003. [DOI] [PMC free article] [PubMed] [Google Scholar]
  19. Gardner MK, Zanic M, Howard J. Microtubule catastrophe and rescue. Current Opinion in Cell Biology. 2013;25:14–22. doi: 10.1016/j.ceb.2012.09.006. [DOI] [PMC free article] [PubMed] [Google Scholar]
  20. Ghiretti AE, Thies E, Tokito MK, Lin T, Ostap EM, Kneussel M, Holzbaur EL. Activity-Dependent regulation of distinct transport and cytoskeletal remodeling functions of the dendritic kinesin KIF21B. Neuron. 2016;92:857–872. doi: 10.1016/j.neuron.2016.10.003. [DOI] [PMC free article] [PubMed] [Google Scholar]
  21. Goris A, Boonen S, D'hooghe MB, Dubois B. Replication of KIF21B as a susceptibility locus for multiple sclerosis. Journal of Medical Genetics. 2010;47:775–776. doi: 10.1136/jmg.2009.075911. [DOI] [PubMed] [Google Scholar]
  22. Grigoriev I, Akhmanova A. Microtubule dynamics at the cell cortex probed by TIRF microscopy. Methods in Cell Biology. 2010;97:91–109. doi: 10.1016/S0091-679X(10)97006-4. [DOI] [PubMed] [Google Scholar]
  23. Gudimchuk N, Vitre B, Kim Y, Kiyatkin A, Cleveland DW, Ataullakhanov FI, Grishchuk EL. Kinetochore kinesin CENP-E is a processive bi-directional tracker of dynamic microtubule tips. Nature Cell Biology. 2013;15:1079–1088. doi: 10.1038/ncb2831. [DOI] [PMC free article] [PubMed] [Google Scholar]
  24. He M, Subramanian R, Bangs F, Omelchenko T, Liem KF, Kapoor TM, Anderson KV. The kinesin-4 protein Kif7 regulates mammalian hedgehog signalling by organizing the cilium tip compartment. Nature Cell Biology. 2014;16:663–672. doi: 10.1038/ncb2988. [DOI] [PMC free article] [PubMed] [Google Scholar]
  25. Heidary G, Engle EC, Hunter DG. Congenital fibrosis of the extraocular muscles. Seminars in Ophthalmology. 2008;23:3–8. doi: 10.1080/08820530701745181. [DOI] [PubMed] [Google Scholar]
  26. Hibbel A, Bogdanova A, Mahamdeh M, Jannasch A, Storch M, Schäffer E, Liakopoulos D, Howard J. Kinesin Kip2 enhances microtubule growth in vitro through length-dependent feedback on polymerization and catastrophe. eLife. 2015;4:e10542. doi: 10.7554/eLife.10542. [DOI] [PMC free article] [PubMed] [Google Scholar]
  27. Hoogenraad CC, Akhmanova A, Grosveld F, De Zeeuw CI, Galjart N. Functional analysis of CLIP-115 and its binding to microtubules. Journal of Cell Science. 2000;113 ( Pt 12:2285–2297. doi: 10.1242/jcs.113.12.2285. [DOI] [PubMed] [Google Scholar]
  28. Hu Z, Liang Y, Meng D, Wang L, Pan J. Microtubule-depolymerizing kinesins in the regulation of assembly, disassembly, and length of cilia and flagella. International Review of Cell and Molecular Biology. 2015;317:241–265. doi: 10.1016/bs.ircmb.2015.01.008. [DOI] [PubMed] [Google Scholar]
  29. Katrukha EA. ImageJ plugin making kymographs of maximum or average intensity with wide lines, polylines, curves. bf8c4e6c7e2a7b26a69770f515d5b21ce86e85e9https://github.com/ekatrukha/KymoResliceWide 2015
  30. Katrukha EA. ImageJ plugin detecting and colocalizing particles of given size. 3e0dfda90354f968fd9ba2bf25928186993c1ea2https://github.com/ekatrukha/ComDet 2016
  31. Katrukha EA, Cloin B, Teeuw J, Kapitein LC. Detection of Molecules plugin for ImageJ. 463a32f541ebd76d910c1c4e593c189c382b3fb9https://github.com/ekatrukha/DoM_Utrecht 2016
  32. Kevenaar JT, Bianchi S, van Spronsen M, Olieric N, Lipka J, Frias CP, Mikhaylova M, Harterink M, Keijzer N, Wulf PS, Hilbert M, Kapitein LC, de Graaff E, Ahkmanova A, Steinmetz MO, Hoogenraad CC. Kinesin-Binding protein controls microtubule dynamics and cargo trafficking by regulating kinesin motor activity. Current Biology. 2016;26:849–861. doi: 10.1016/j.cub.2016.01.048. [DOI] [PubMed] [Google Scholar]
  33. Komarova Y, De Groot CO, Grigoriev I, Gouveia SM, Munteanu EL, Schober JM, Honnappa S, Buey RM, Hoogenraad CC, Dogterom M, Borisy GG, Steinmetz MO, Akhmanova A. Mammalian end binding proteins control persistent microtubule growth. The Journal of Cell Biology. 2009;184:691–706. doi: 10.1083/jcb.200807179. [DOI] [PMC free article] [PubMed] [Google Scholar]
  34. Kreft KL, van Meurs M, Wierenga-Wolf AF, Melief MJ, van Strien ME, Hol EM, Oostra BA, Laman JD, Hintzen RQ. Abundant kif21b is associated with accelerated progression in neurodegenerative diseases. Acta Neuropathologica Communications. 2014;2:144. doi: 10.1186/s40478-014-0144-4. [DOI] [PMC free article] [PubMed] [Google Scholar]
  35. Kurasawa Y, Earnshaw WC, Mochizuki Y, Dohmae N, Todokoro K. Essential roles of KIF4 and its binding partner PRC1 in organized central spindle midzone formation. The EMBO Journal. 2004;23:3237–3248. doi: 10.1038/sj.emboj.7600347. [DOI] [PMC free article] [PubMed] [Google Scholar]
  36. Laan L, Pavin N, Husson J, Romet-Lemonne G, van Duijn M, López MP, Vale RD, Jülicher F, Reck-Peterson SL, Dogterom M. Cortical dynein controls microtubule dynamics to generate pulling forces that position microtubule asters. Cell. 2012;148:502–514. doi: 10.1016/j.cell.2012.01.007. [DOI] [PMC free article] [PubMed] [Google Scholar]
  37. Labonté D, Thies E, Pechmann Y, Groffen AJ, Verhage M, Smit AB, van Kesteren RE, Kneussel M. TRIM3 regulates the motility of the kinesin motor protein KIF21B. PLoS One. 2013;8:e75603. doi: 10.1371/journal.pone.0075603. [DOI] [PMC free article] [PubMed] [Google Scholar]
  38. Labonté D, Thies E, Kneussel M. The kinesin KIF21B participates in the cell surface delivery of γ2 subunit-containing GABAA receptors. European Journal of Cell Biology. 2014;93:338–346. doi: 10.1016/j.ejcb.2014.07.007. [DOI] [PubMed] [Google Scholar]
  39. Lee KH, Lee JS, Lee D, Seog DH, Lytton J, Ho WK, Lee SH. KIF21A-mediated axonal transport and selective endocytosis underlie the polarized targeting of NCKX2. Journal of Neuroscience. 2012;32:4102–4117. doi: 10.1523/JNEUROSCI.6331-11.2012. [DOI] [PMC free article] [PubMed] [Google Scholar]
  40. Marszalek JR, Weiner JA, Farlow SJ, Chun J, Goldstein LS. Novel dendritic kinesin sorting identified by different process targeting of two related kinesins: kif21a and KIF21B. The Journal of Cell Biology. 1999;145:469–479. doi: 10.1083/jcb.145.3.469. [DOI] [PMC free article] [PubMed] [Google Scholar]
  41. Maurer SP, Fourniol FJ, Bohner G, Moores CA, Surrey T. EBs recognize a nucleotide-dependent structural cap at growing microtubule ends. Cell. 2012;149:371–382. doi: 10.1016/j.cell.2012.02.049. [DOI] [PMC free article] [PubMed] [Google Scholar]
  42. Mohan R, Katrukha EA, Doodhi H, Smal I, Meijering E, Kapitein LC, Steinmetz MO, Akhmanova A. End-binding proteins sensitize microtubules to the action of microtubule-targeting agents. PNAS. 2013;110:8900–8905. doi: 10.1073/pnas.1300395110. [DOI] [PMC free article] [PubMed] [Google Scholar]
  43. Montenegro Gouveia S, Leslie K, Kapitein LC, Buey RM, Grigoriev I, Wagenbach M, Smal I, Meijering E, Hoogenraad CC, Wordeman L, Steinmetz MO, Akhmanova A. In vitro reconstitution of the functional interplay between MCAK and EB3 at Microtubule plus ends. Current Biology. 2010;20:1717–1722. doi: 10.1016/j.cub.2010.08.020. [DOI] [PubMed] [Google Scholar]
  44. Moores CA, Milligan RA. Lucky 13-microtubule depolymerisation by kinesin-13 motors. Journal of Cell Science. 2006;119:3905–3913. doi: 10.1242/jcs.03224. [DOI] [PubMed] [Google Scholar]
  45. Muhia M, Thies E, Labonté D, Ghiretti AE, Gromova KV, Xompero F, Lappe-Siefke C, Hermans-Borgmeyer I, Kuhl D, Schweizer M, Ohana O, Schwarz JR, Holzbaur EL, Kneussel M. The kinesin KIF21B regulates microtubule dynamics and is essential for neuronal morphology, synapse function, and learning and memory. Cell Reports. 2016;15:968–977. doi: 10.1016/j.celrep.2016.03.086. [DOI] [PMC free article] [PubMed] [Google Scholar]
  46. Navone F, Niclas J, Hom-Booher N, Sparks L, Bernstein HD, McCaffrey G, Vale RD. Cloning and expression of a human kinesin heavy chain gene: interaction of the COOH-terminal domain with cytoplasmic microtubules in transfected CV-1 cells. The Journal of Cell Biology. 1992;117:1263–1275. doi: 10.1083/jcb.117.6.1263. [DOI] [PMC free article] [PubMed] [Google Scholar]
  47. Olieric N, Kuchen M, Wagen S, Sauter M, Crone S, Edmondson S, Frey D, Ostermeier C, Steinmetz MO, Jaussi R. Automated seamless DNA co-transformation cloning with direct expression vectors applying positive or negative insert selection. BMC Biotechnology. 2010;10:56. doi: 10.1186/1472-6750-10-56. [DOI] [PMC free article] [PubMed] [Google Scholar]
  48. Olson HE, Shen Y, Poduri A, Gorman MP, Dies KA, Robbins M, Hundley R, Wu B, Sahin M. Micro-duplications of 1q32.1 associated with neurodevelopmental delay. European Journal of Medical Genetics. 2012;55:145–150. doi: 10.1016/j.ejmg.2011.12.008. [DOI] [PMC free article] [PubMed] [Google Scholar]
  49. Schuck P. Size-distribution analysis of macromolecules by sedimentation velocity ultracentrifugation and lamm equation modeling. Biophysical Journal. 2000;78:1606–1619. doi: 10.1016/S0006-3495(00)76713-0. [DOI] [PMC free article] [PubMed] [Google Scholar]
  50. Sharma A, Aher A, Dynes NJ, Frey D, Katrukha EA, Jaussi R, Grigoriev I, Croisier M, Kammerer RA, Akhmanova A, Gönczy P, Steinmetz MO. Centriolar CPAP/SAS-4 imparts slow processive microtubule growth. Developmental Cell. 2016;37:362–376. doi: 10.1016/j.devcel.2016.04.024. [DOI] [PMC free article] [PubMed] [Google Scholar]
  51. Stepanova T, Slemmer J, Hoogenraad CC, Lansbergen G, Dortland B, De Zeeuw CI, Grosveld F, van Cappellen G, Akhmanova A, Galjart N. Visualization of microtubule growth in cultured neurons via the use of EB3-GFP (end-binding protein 3-green fluorescent protein) Journal of Neuroscience. 2003;23:2655–2664. doi: 10.1523/JNEUROSCI.23-07-02655.2003. [DOI] [PMC free article] [PubMed] [Google Scholar]
  52. Stumpff J, Du Y, English CA, Maliga Z, Wagenbach M, Asbury CL, Wordeman L, Ohi R. A tethering mechanism controls the processivity and kinetochore-microtubule plus-end enrichment of the kinesin-8 Kif18A. Molecular Cell. 2011;43:764–775. doi: 10.1016/j.molcel.2011.07.022. [DOI] [PMC free article] [PubMed] [Google Scholar]
  53. Su X, Qiu W, Gupta ML, Pereira-Leal JB, Reck-Peterson SL, Pellman D. Mechanisms underlying the dual-mode regulation of microtubule dynamics by Kip3/kinesin-8. Molecular Cell. 2011;43:751–763. doi: 10.1016/j.molcel.2011.06.027. [DOI] [PMC free article] [PubMed] [Google Scholar]
  54. Su X, Ohi R, Pellman D. Move in for the kill: motile microtubule regulators. Trends in Cell Biology. 2012;22:567–575. doi: 10.1016/j.tcb.2012.08.003. [DOI] [PMC free article] [PubMed] [Google Scholar]
  55. Subramanian R, Ti SC, Tan L, Darst SA, Kapoor TM. Marking and measuring single microtubules by PRC1 and kinesin-4. Cell. 2013;154:377–390. doi: 10.1016/j.cell.2013.06.021. [DOI] [PMC free article] [PubMed] [Google Scholar]
  56. Vale RD, Funatsu T, Pierce DW, Romberg L, Harada Y, Yanagida T. Direct observation of single kinesin molecules moving along microtubules. Nature. 1996;380:451–453. doi: 10.1038/380451a0. [DOI] [PMC free article] [PubMed] [Google Scholar]
  57. Varga V, Helenius J, Tanaka K, Hyman AA, Tanaka TU, Howard J. Yeast kinesin-8 depolymerizes microtubules in a length-dependent manner. Nature Cell Biology. 2006;8:957–962. doi: 10.1038/ncb1462. [DOI] [PubMed] [Google Scholar]
  58. Verhey KJ, Hammond JW. Traffic control: regulation of kinesin motors. Nature Reviews Molecular Cell Biology. 2009;10:765–777. doi: 10.1038/nrm2782. [DOI] [PubMed] [Google Scholar]
  59. Walczak CE, Gayek S, Ohi R. Microtubule-depolymerizing kinesins. Annual Review of Cell and Developmental Biology. 2013;29:417–441. doi: 10.1146/annurev-cellbio-101512-122345. [DOI] [PubMed] [Google Scholar]
  60. Weaver LN, Ems-McClung SC, Stout JR, LeBlanc C, Shaw SL, Gardner MK, Walczak CE. Kif18A uses a microtubule binding site in the tail for plus-end localization and spindle length regulation. Current Biology. 2011;21:1500–1506. doi: 10.1016/j.cub.2011.08.005. [DOI] [PMC free article] [PubMed] [Google Scholar]
  61. Yamada K, Andrews C, Chan WM, McKeown CA, Magli A, de Berardinis T, Loewenstein A, Lazar M, O'Keefe M, Letson R, London A, Ruttum M, Matsumoto N, Saito N, Morris L, Del Monte M, Johnson RH, Uyama E, Houtman WA, de Vries B, Carlow TJ, Hart BL, Krawiecki N, Shoffner J, Vogel MC, Katowitz J, Goldstein SM, Levin AV, Sener EC, Ozturk BT, Akarsu AN, Brodsky MC, Hanisch F, Cruse RP, Zubcov AA, Robb RM, Roggenkäemper P, Gottlob I, Kowal L, Battu R, Traboulsi EI, Franceschini P, Newlin A, Demer JL, Engle EC. Heterozygous mutations of the kinesin KIF21A in congenital fibrosis of the extraocular muscles type 1 (CFEOM1) Nature Genetics. 2003;35:318–321. doi: 10.1038/ng1261. [DOI] [PubMed] [Google Scholar]
  62. Yang X, Li M, Wang L, Hu Z, Zhang Y, Yang Q. Association of KIF21B genetic polymorphisms with ankylosing spondylitis in a chinese han population of shandong province. Clinical Rheumatology. 2015;34:1729–1736. doi: 10.1007/s10067-014-2761-5. [DOI] [PubMed] [Google Scholar]
  63. Yau KW, van Beuningen SF, Cunha-Ferreira I, Cloin BM, van Battum EY, Will L, Schätzle P, Tas RP, van Krugten J, Katrukha EA, Jiang K, Wulf PS, Mikhaylova M, Harterink M, Pasterkamp RJ, Akhmanova A, Kapitein LC, Hoogenraad CC. Microtubule minus-end binding protein CAMSAP2 controls axon specification and dendrite development. Neuron. 2014;82:1058–1073. doi: 10.1016/j.neuron.2014.04.019. [DOI] [PubMed] [Google Scholar]
  64. Zhu C, Jiang W. Cell cycle-dependent translocation of PRC1 on the spindle by Kif4 is essential for midzone formation and cytokinesis. PNAS. 2005;102:343–348. doi: 10.1073/pnas.0408438102. [DOI] [PMC free article] [PubMed] [Google Scholar]
  65. van Bergeijk P, Adrian M, Hoogenraad CC, Kapitein LC. Optogenetic control of organelle transport and positioning. Nature. 2015;518:111–114. doi: 10.1038/nature14128. [DOI] [PMC free article] [PubMed] [Google Scholar]
  66. van den Wildenberg SM, Tao L, Kapitein LC, Schmidt CF, Scholey JM, Peterman EJ. The homotetrameric kinesin-5 KLP61F preferentially crosslinks microtubules into antiparallel orientations. Current Biology. 2008;18:1860–1864. doi: 10.1016/j.cub.2008.10.026. [DOI] [PMC free article] [PubMed] [Google Scholar]
  67. van der Vaart B, van Riel WE, Doodhi H, Kevenaar JT, Katrukha EA, Gumy L, Bouchet BP, Grigoriev I, Spangler SA, Yu KL, Wulf PS, Wu J, Lansbergen G, van Battum EY, Pasterkamp RJ, Mimori-Kiyosue Y, Demmers J, Olieric N, Maly IV, Hoogenraad CC, Akhmanova A. CFEOM1-associated kinesin KIF21A is a cortical microtubule growth inhibitor. Developmental Cell. 2013;27:145–160. doi: 10.1016/j.devcel.2013.09.010. [DOI] [PubMed] [Google Scholar]
eLife. 2017 Mar 14;6:e24746. doi: 10.7554/eLife.24746.044

Decision letter

Editor: Samara L Reck-Peterson1

In the interests of transparency, eLife includes the editorial decision letter and accompanying author responses. A lightly edited version of the letter sent to the authors after peer review is shown, indicating the most substantive concerns; minor comments are not usually included.

Thank you for submitting your article "Kinesin-4 KIF21B is a potent microtubule pausing factor" for consideration by eLife. Your article has been reviewed by three peer reviewers, and the evaluation has been overseen by a Reviewing Editor and Vivek Malhotra as the Senior Editor. The reviewers have opted to remain anonymous.

The reviewers have discussed the reviews with one another and the Reviewing Editor has drafted this decision to help you prepare a revised submission.

Summary:

A sizeable body of literature suggests that a defining feature of kinesin-4 motor proteins is that they slow (or halt) microtubule growth. In this manuscript, van Riel and colleagues show that KIF21B, an uncharacterized kinesin-4 closely related to KIF21A, also induces microtubule pausing. This activity is important from the standpoint of kinesin biochemistry and human disease, as KIF21B is associated with several human neurological disorders. The authors also demonstrate that KIF21B is highly processive, and that two additional microtubule binding sites are present within the motor. One of these microtubule binding sites resides within the C-terminal WD40 domain, and is particularly interesting as it appears to bind GMPCPP microtubules specifically. The implication of this finding is that the WD40 domain may help to anchor the motor at growing microtubule plus-ends, thus enhancing its pause-inducing activity. The authors go on to suggest that single KIF21B molecules are able to pause microtubule growth.

Essential revisions:

All three reviewers raised major concerns that must be addressed in order to consider publication in eLife.

1) The authors' conclusions for Figure 1 G and H are very puzzling. Although the quality of the kymographs in Figure 1G is not high, individual particles of MD-CC1 can be seen arriving at the microtubule tip occasionally and immediately detaching. The fraction of time that the tip is in contact with one such molecule is very small relative to the total time of microtubule growth, while during this time the microtubule end polymerizes smoothly and continuously at a rate slower than in the control. The authors' conclusion that the slowing of growth velocity is due to these infrequent encounters seems improbable because this would imply a long-distance effect (e.g. the motor walks on the wall and this causes the tip to polymerize slowly) or some kind of memory (e.g. the motor did something to the tip and even after the motor detaches the rate of assembly remains slower than normal). Other explanations are possible. For example, are there any differences in the buffer conditions? The authors did not provide the final concentrations for buffers in which these observations were made, but the methods section suggests that the experiments with MD-CC1 were done in the presence of some additional reagents (e.g. detergent) and TEV protease, while EB3 control experiments lacked these additions. The authors should rule out this trivial explanation by adding GFP protein purified analogously to MD-CC1 to their EB3 control. If it really appears that microtubule growth is perturbed even when no MD-CC1 molecules are seen at the tip, the authors should add a discussion about possible molecular mechanisms for this very striking observation. A similar conclusion was made for the full length motor, but again microtubule polymerization appears to have been slowed when only a few motor molecules were present at the tip.

Related to this concern, the microtubule growth rate (~4 μm/ min at 15 μm tubulin) shown in Figure 1H is quite fast compared to other reports in the literature. Please provide a complete plot of microtubule growth rate vs. tubulin concentration, with and without KIF21B as well as microtubule growth rate vs KIF21B concentration.

2) That single molecules of KIF21B may be sufficient to cause microtubules to cease growing and shortening is fascinating. The main evidence is Figure 2D, where a kymograph shows an alleged single molecule hitting the end and causing it to pause. However, the authors do not pursue this phenomenon at a mechanistic level, or provide a reasonable discussion that explains the observation. Both should be addressed in a revised manuscript and the following points must be taken into account:

A) What is the positional resolution of that experiment? Has the microtubule really paused, or has growth simply dropped to a level that is below detection?

B) It is suggested that the affinity of the WD40 domain for GMPCPP tubulin might stabilize motor-tip interactions, but this hypothesis still cannot explain an enzyme activity that probably involves more than one protofilament. A discussion of motor dimensions may help. The WD40 domain, for example, is 4 nanometers in diameter. What is the predicted length of the stalk? Can a single KIF21B motor crosslink multiple neighboring protofilaments? A minor issue related to this point concerns the purity of the KIF21B preparation (Figure 1—figure supplement 2). What is the stoichiometric band that runs at ~65 kDa? Are the authors sure that this protein is irrelevant for the observed KIF21B effect on microtubule dynamics?

C) The FL motor kymographs in Figure 2 are difficult to see, but almost all of the visible events in panel D are consistent with "stay on MT lattice" behavior, while the authors claim that the majority of events (~45%) are pausing of MT growth. The pausing is very striking and compelling for high motor decoration, but is the same phenotype observed for the dim complexes, which might be single molecules? For example, in panel D, the first 2 events in the upper kymograph have dim signals and are clearly "lattice" events. The third event with a somewhat brighter complex does look like pausing, but strangely the pause appears to start before the motor arrives. In the second row of kymographs the first event is also clearly a wall-bound complex that does not induce pausing. In the leftmost kymograph in Figure 2—figure supplement 1, the microtubule tip appears to pause even in the absence of any complex. In the middle panel in the same figure one pause starts before the motors arrive.

D) The lines for moving motors are segmented, with only 3-6 dots per 2 micron (based on Figure 2—figure supplement 1 images). Thus, single GFP dimers near the tip would be easy to miss (see rightmost image in the supplemental figure where only the longest lines are clear). This raises the possibility that several molecules could cause pausing events. Please provide more images with improved time resolution and better contrast to determine if single molecules can indeed induce pausing. XY plots for motor vs. tip position should also be presented.

E) Plotting the duration of pause vs. tip brightness will address the concern that the pauses are brought about by multiple molecules.

F) The quantification of the number of GFP molecules is very important for this study. For example, the evidence in Figure 2G is not very convincing. The population of molecules appears to be very heterogeneous. The authors should show bleaching step analysis with pairwise intensity distributions, as is common in the single molecule field. The impact of the evanescence field depth should also be taken into account and discussed.

3) The claim that the full-length motor induces catastrophe is not well justified. Please provide quantitative data to confirm this.

4) The authors provide velocity measurements for KIF21B constructs (full length and MD-CC1) that are expressed in cells. Do these represent the speed distributions of single molecules or motors that travel in teams? Either should be substantiated by fluorescence intensity distributions of GFP spots that have been tracked.

5) Although GFP intensity measurements for full length KIF21B are provided (Figure 2F) – which support the conclusion that KIF21B is a dimer – similar measurements are not provided for other constructs. In some cases, statements are made that are not supported by such data, for example "We conclude that the motor domain of KIF21B in a dimeric configuration is motile and can inhibit but not block microtubule plus-end depolymerization". This should be addressed.

6) There is some negative-stain EM that is presented as evidence that KIF21B is folded and globular. Please include more than 2 images as evidence, perhaps in a small gallery in the Supplement.

7) Why do so few KIF21B molecules can escape the seed area (see Figure 2A). A higher affinity for the seed might recruit motors there, but why are they stuck?

8) The data on the length-dependence of these results (Figure 2B) is underdeveloped relative to the data on other kinesin-4's and especially kinesin-8's.

9) The extent of protein overexpression in cells (Figures 1 and 3) is not document or discussed.

10) It is interesting that the L-WD40 construct localizes strongly to the GMPCPP seed, but what is the explanation for why the construct does not localize to growing microtubule tips (Figure 4C)? If the WD40 domain of KIF21B "senses" the nucleotide state of tubulin within the lattice, then one might expect for it to target tips (similar to TPX2, as recently shown by the Surrey laboratory). That it does not suggests that the interaction is blocked by a feature at microtubule plus ends, perhaps curvature. Related to this point, L-WD40 localizes uniformly along the microtubule lattice in cells (Figure 3B), which is presumably representative of GDP-tubulin binding. This requires clarification.

11) The authors emphasize repeatedly that L-WD40 domain shows "strong preference" for the GMCPP lattice, speculating about the implications of this property for motor's behavior at the tip. This statement is based on couple images in Figure 4—figure supplement 1, in which GMPCPP seed and GDP microtubule walls are compared. However, these microtubule fragments differ in other respects, such as percent of labeled tubulin, biotin label and attachment to the coverslip (seed is attached while the GDP part is not). Moreover, this experiment was done with cell extracts, rather than with purified proteins, so many other MAPs were present. To be certain that L-WD40 can discriminate different microtubule lattices, microtubule binding affinity should be quantified using purified proteins and similarly prepared and coverslip-attached microtubules.

12) Please provide histograms of run lengths and velocities, not just their averages.

13) The authors did a great job dissecting the domain structure of KIF21B, and the microtubule binding results are represented clearly with Table in Figure 3A. An analogous table for the in vitro data should be included.

14) Please describe all buffer conditions in more detail (see major point 1). Also, is ATP present in the buffers used for the microtubule co-pelleting experiments (Figure 3C)?

15) A short discussion on how the results obtained in this study compares to the recent paper by Muhia et al., published in Cell Reports should be included. Muhia et al. find that microtubule growth rates are increased by KIF21B: in their hands, microtubules grow faster when the motor is overexpressed, and slower when the motor is depleted. Muhia et al. do show that KIF21B reduces the average time to catastrophe (although the effect is quite modest), which is consistent with results here.

[Editors’ note: what now follows is the decision letter after the authors submitted for further consideration.]

Thank you for submitting your work entitled "Kinesin-4 KIF21B is a potent microtubule pausing factor" for consideration by eLife. Your article has been reviewed by three peer reviewers, and the evaluation has been overseen by a Reviewing Editor and a Senior Editor. The reviewers have opted to remain anonymous.

Our decision has been reached after extensive consultation between the reviewers. Based on these discussions and the individual reviews below, we regret to inform you that your work will not be considered further for publication in eLife.

Three reviewers, whose evaluation was overseen by a Reviewing Editor, have now reviewed your revised manuscript. While all agreed that this was a stronger manuscript, unfortunately there were remaining major concerns that preclude acceptance for publication in eLife. We hope that these specific comments will help you revise your work for publication elsewhere.

1) The reviewers continued to be unconvinced that single molecules of KIF21B cause pausing, a statement that was toned down in places in the manuscript, but explicitly stated in others. Some comments included:

– The KIF21B preparation appears to be heterogeneous (as evidenced by the broad distribution of brightness in Figure 5A). There are many noticeable differences in brightness throughout the kymographs that are shown. This raises the possibility that multiple motors are being analyzed in some cases.

– The brightness of single GFP molecules is compared to KIF21B. However, single GFP molecules will be present on the glass surface, while KIF21B will be located on the MT. This places GFP and KIF21B in a different region of the evanescent field, which decays exponentially. This could also lead to an underestimate of the number of KIF21B molecules.

– Photobleaching of KIF21B that could induce pausing was not taken into account. Prior photobleaching could also lead to an underestimate of the number of molecules present.

2) Perhaps most troubling, in two places in the revision the figures that are shown do not match the data described in the text.

– In Figure 1J at 2 nM MD-CC1 KIF21B moves towards the microtubule plus end, but at 10 nM MD-CC1 KIF21B appears to move in the opposite direction. Does this mean that it was difficult to distinguish plus and minus ends? How often where minus ends confused with plus ends? This is not discussed in the text and is quite troubling.

– The text claims that pausing is never observed in the presence of EB3 alone and that all observed pauses correlated with the presence of KIF21B. However, there are numerous examples where this is not the case: 1) Figure 1—figure supplement 4: there is a pause in the presence of 10 nM GFP. 2) Figure 2—figure supplement 1: in the first panel the second pause is not associated with GFP-labeled KIF21B. 3) Figure 3—figure supplement 3 it appears that the microtubule is already paused prior to KIF21B-GFP arrival.

The detailed comments of the reviewers are below.

Reviewer #1:

The revised manuscript by van Riel et al. contains a substantial amount of new data. Most new data relate to reviewers' comments. It is notable, however, that the authors now include new data that address the mechanism of Kif21B autoinhibition (Figure 4—figure supplement 3).

Overall, I found the revised paper to be significantly improved. I still remain mystified by how single Kif21B molecules can affect microtubule plus-end dynamics (even after the plus-end has extended beyond the point of Kif21B-microtubule association), and was not terribly satisfied by its comparison to the Eribulin. However, the work has been carefully conducted and contains the appropriate controls. I now support publication of this manuscript in eLife.

Reviewer #2:

The authors have addressed many critical points, leading to a stronger manuscript. However, the main criticism concerning the authors' claim that a single molecule of KIF21B is capable of causing specific modulation of the microtubule tip behavior has not been addressed fully. Although some statements to this effect have been softened in the main text, this claim is firmly stated in several places, e.g. see impact statement or labels in Figure 5G,H.

I am concerned about this statement because there are multiple indications in this manuscript that the molecular composition of KIF21B preparation is heterogeneous: the distribution of brightnesses of these molecules is broad (e.g. see Figure 5A and point 2 below), there are visible differences in the brightness of molecules in virtually all kymogpraphs (e.g. see Figure 3A) and movies (e.g. Video 2, Figure 3—figure supplement 3), there are visible differences in the size of globules attributed to KIF21B in EM images (some globules are almost 15-20 nm in diameter, exceeding the size of single molecule of Kif21B molecular weight), and the molecular effects at microtubule tip are also heterogeneous (e.g. some molecules induce pausing, while others induce catastrophe). My interpretation of these results is that small oligomers, not just the single molecules of KIF21B, are present in experimental chambers, which is often the case with purified proteins.

To support their claim that only single molecules can elicit certain effects the authors provide few selected examples in which one fluorescent complex appears to lead to some specific effect (e.g. pausing) but the rigorous proof that these specific dots correspond to 1 or 2 Kif21B molecules is lacking. Many or some of these dots, in my opinion, could correspond to complexes of 3-4 molecules, consistent with the heterogeneities listed above. I do not think the slightly larger size of the complexes changes the main message of the paper, but if the authors insist on their quantitative 1-2 molecules statement, I will have to ask for a more convincing evidence. This manuscript is considered for a publication in a very visible and respected journal, so keeping high standards for single molecule aspects in this paper is important.

Specific criticism of the brightness analyses in this paper:

1) The single most important quantification that is lacking in this paper is a quantitative comparison of the brightness of a single GFP molecule with the brightness of the complexes at the MT tip imaged under identical conditions and while taking into account the differences that could not be eliminated. Brightness of single GFP molecule is measured in this paper but it is reported in the manner that prevents any meaningful comparisons. Indeed, brightness of a single GFP molecule is roughly 2,000 au in Figure 1 H and I; 5,000 au in Figure 2A; ~1,200 au in Figure 2B; in the range of 1,700- 2,500 au in different panels in Figure 5A. At the same time, the authors claim that brightness 20 au corresponds to a single motor (2 GFPs) in Figure 2F, ~ 40 au and > 60 au in Figure 3—figure supplement 1 A and B. This clearly illustrates a lack of effort to use these quantifications for obtaining a convincing estimate of the number of GFP molecules at the microtubule tip.

To address this omission, the authors should provide all peak values with errors for their fits and use consistent imaging conditions and data representation, so that all measurements for single GFP reported in this work are consistent and can be used to compare with the brightness of kinesin molecules that elicit certain response at the microtubule tip (e.g. pausing, see previous criticism 2E, which has not been addressed). For accurate comparison, the authors will have to take into account two additional factors that can greatly affect their conclusions:

First, brightness of single GFP molecules was measured in this work at the coverslip surface, while microtubule tips are located at some distance away. I do not believe that measuring this distance for every event can be done (or should be done) accurately, but since the evanescent field decays exponentially, this effect cannot be simply ignored, as in this paper. Approximate estimate of the average depth at which MT tips were imaged should be obtained and used to calculate the brightness at the coverslip surface. Without such an adjustment, the ratio of approximately 1 of Kif21B intensity at the microtubule tip to the GFP intensity on the coverslip (Figure 2G) cannot be used to argue that these complexes have the same number of molecules.

Second, the authors should provide evidence that they are justified to ignore bleaching. The initial intensity of GFP molecules was measured, while KIF21B dots were visualized for extended time. Few examples of Kif21B intensity kinetics on microtubule shown in this paper are too noisy to make reliable conclusions about the extent of bleaching during the observation time, so this issue should be addressed by direct measurements. This concern is valid especially for KIF21B because, as reported in this paper, this motor first binds at the GMPCPP seeds and only few molecules escape later and run along the GDP lattice. The exact time these "escaped" motors spent on the seed is not known. It is possible that only the relatively large clusters escape and that at this time some of their GFPs have already bleached.

Importantly, both factors, the z distance and bleaching, can lead to underestimation of the size of Kif21B complexes, so the dots that seem to contain 1-2 molecules may in fact be larger. Moreover, It has not been ruled out by the authors that processivity of Kif21B molecules, or their ability to walk on GDP lattice, or the strength of the effects they cause at the MT tip increase with increasing number of clustered molecules. Any one of these plausible possibilities could help to "select" larger complexes from heterogeneous population even if they were present in minor quantities.

Other errors in the manuscript:

2) In the rebuttal letter and manuscript text the authors state that the lognormal distribution (Figure 1H, 2A, 5A) of the intensities of individual GFP fluorophores "precisely accounts for the effect of evanescence field on otherwise expected normal distribution of intensities". No reference was provided. I am not familiar with this effect and believe that this statement is wrong. Methods section explains that these intensities were collected from molecules attached to the coverslip surface, so all molecules were positioned in the same plane. The decay in intensity at distances away from the coverslip is therefore irrelevant for interpreting the shape of these experimental distributions. Moreover, even if the molecules were located at variable distances from the coverslips, this would have increased the proportion of molecules with the lower than peak intensity. The lognormal shape of the distribution, characterized by the presence of complexes with higher than peak intensities, can be caused by other experimental factors. First, by a relatively high density of molecules on the coverslip, so that 2 or 3 single molecules could not be resolved. This explanation is indeed possible in the current work because the authors use 2-9 times higher density than recommended by others for this type of analysis (Jain et al., 2012). Second, the lognormal shape is expected for heterogeneous preparations, so it may simply reflect presence of a significant proportion of complexes that are larger than single molecules. This second possibility supports my concern that the actual size of Kif21B complexes acting at the microtubule tip is larger than stated by the authors.

3) New Figure 1J is remarkable because it shows that at 2 nM the MD-CC1 motor runs toward the tip of MT, but at 10 nM it switches polarity and runs toward the seed. The authors will have to explain this result, but I suspect that for 10 nM panel they show imaging of the minus MT end, not the plus. This is very disturbing because it implies that these experiments were done under conditions when discriminating between different MT ends was difficult, the directionality of motor's walking was not taken into account, and the data from different types of ends were combined to show retardation of MT polymerization rate. In Discussion section the authors write: "The dimeric version of the motor is sufficient to inhibit microtubule growth.. It is possible that KIF21B motors arriving at the microtubule tip somehow affect the conformation of terminal tubulin dimers, thereby reducing the tubulin on-rate." If this is the model, how do the authors explain that the velocity of growth of minus end was also reduced in Kif21B presence? Or is it possible that the reported results are affected by the relative sampling of the plus and minus end kinetics and the authors failed to discriminate these effects? This situation seems unacceptable to me because it raises serious concern about the quality of data collection and analysis.

4) The authors state that they "..have never observed any pausing in our in vitro assays in the presence of EB3 alone, and all observed pauses could be correlated with the presence of KIF21B at the microtubule tip. However, it is true that we did observe events when microtubule polymerization appeared to slow down before the arrival of KIF21B and subsequent pausing." The distinction between "pausing" and "slowing down" is unclear to me. Multiple examples in this paper show pausing/slowing in the absence of KIF21B. See Figure 1—figure supplement 4 (Tub 15 μm with GFP middle of the first track). In Figure 2—figure supplement 1 panel A only first pause is associated with GFP. In Figure 3—figure supplement 3 polymerization pauses at 10-25 s, ie before the arrival of GFP-labeled molecule. Figure 3 panel F lower example clearly shows that MT growth is stalled in the absence of GFP signal. It could either be caused by the bleached GFP-kinesins or by a low quality of tubulin preparation. These issues have not been addressed or even mentioned. Since pausing at the MT end is the primary focus of this paper, I am very concerned about the discrepancy between author's statement and actual images.

Reviewer #3:

van Riel et al. have resubmitted their paper on the kinesin-4 KIF21B. Overall, I feel they have done a fairly solid job of responding to our concerns. The data quality has improved in many of the figure panels. The mass-spec of their contaminants and the analysis of particle brightness are particularly welcome.

It is still very puzzling that a single transient encounter of KIF21B with the microtubule end can slow down the growth rate by half. Their rebuttal just says: "this is how it is"--and they make a point about Eribulin. It was indeed a striking point about their Curr Biol paper that a single eribulin could slow down growth (and produce a secondary EB comet!). But of course it was also the case that microtubule growth resumed after the Eribulin unbinds (e.g., see Figure 4A, bottom half).

I was disappointed that they did not perform their experiments at multiple tubulin concentrations. They say that "further mechanistic insights" won't come out of such experiments, but that's clearly not true. Microtubule end structure is thought to change as a function of tubulin concentration, so the motor may struggle/succeed in suppressing growth differently at different tubulin concentrations. I'm on the fence about whether to insist that they perform these experiments. At the end of the day, this paper isn't the kind that deals with biophysical precision of that type, and while we could force them to perform the experiment, it's unclear that their data/interpretation would be definitive.

[Editors’ note: what now follows is the decision letter after the authors submitted for further consideration.]

Thank you for submitting your article "Kinesin-4 KIF21B is a potent microtubule pausing factor" for consideration by eLife. Your article has been reviewed by two peer reviewers, and the evaluation has been overseen by a Reviewing Editor and Vivek Malhotra as the Senior Editor. The reviewers have opted to remain anonymous.

The reviewers have discussed the reviews with one another and the Reviewing Editor has drafted this decision to help you prepare a revised submission.

As you will see from the two reviews below (both are two of the original reviewers of your paper), the reviewers are now quite positive about your work. I would ask that you only revise the manuscript to take into account the two points raised by reviewer #2: 1) the relationship between the dwell time of the motor on a protofilament and the ability of the motor to induce a catastrophe, and 2) be more explicit in your discussion of protofilament curvature in the Discussion or remove the sentence referred to by reviewer #2.

Reviewer #2:

In this second revision by van Riel et al., the authors address major criticisms related to whether single molecules of KIF21B are indeed capable of causing microtubule plus ends to pause. There is an abundance of new content, including more intensive data analysis and experiments using kinesin-1 as a dimer control. As a result, the paper is now quite dense (I recognize that this is the outcome of the review process), and I am more convinced that low numbers (likely single molecules) of KIF21B motors are capable of stunting microtubule assembly. The authors are now much more explicit regarding models regarding how KIF21B might act; I found these text additions quite useful. I would encourage the authors to also update their model figure to include the action of KIF21B on single protofilaments. Overall, my disposition is that this manuscript is appropriate for eLife, but there are two issues that should be addressed. The first concerns the relationship between the dwell time of the motor on a protofilament, and the ability of the motor to induce a catastrophe. The MD-CC1 truncation does a good job of slowing microtubule growth, without dwelling appreciably anywhere on the lattice. This is quite a remarkable activity, and an indication that the motor must be doing something subtle to the microtubule lattice/protofilament end. By contrast, the last two constructs that are analyzed in the manuscript show no activity, and the authors therefore conclude that: "Taken together, these results suggest that both the regulatory rCC region and the C-terminal WD-40 containing domain can contribute to the ability of KIF21B to stay attached to the growing MT plus end and to induce pausing." These two interpretations are at odds with each other and must be reconciled. Second, the authors suggest that "It is possible that at growing MT plus ends the number of binding sites for which the C-terminus of KIF21B would have preference or its affinity for these sites would be affected by protofilament curvature." In Figure 4—figure supplement 1, the authors show clear examples of microtubule bending prior to a KIF21B-induced catastrophe, but KIF21B is not bound to these deformed plus ends. The statement in the Discussion is thus countered by their own data. I would suggest that the authors are more explicit regarding their ideas or remove the sentence from the Discussion.

Reviewer #3:

van Riel et al. have submitted a second revision of their paper on the kinesin-4 KIF21B. The Akhmanova lab has responded forcefully to every technical concern that was raised. My main concern after the 2nd review was that they had not performed experiments at multiple tubulin concentrations. These data are now included in the manuscript and, indeed, the results are an interesting addition to their story. I am supportive of publication. Although many of the results are still puzzling, the puzzle should now belong to the field.

eLife. 2017 Mar 14;6:e24746. doi: 10.7554/eLife.24746.045

Author response


Essential revisions:

All three reviewers raised major concerns that must be addressed in order to consider publication in eLife.

1) The authors' conclusions for Figure 1 G and H are very puzzling. Although the quality of the kymographs in Figure 1G is not high, individual particles of MD-CC1 can be seen arriving at the microtubule tip occasionally and immediately detaching. The fraction of time that the tip is in contact with one such molecule is very small relative to the total time of microtubule growth, while during this time the microtubule end polymerizes smoothly and continuously at a rate slower than in the control. The authors' conclusion that the slowing of growth velocity is due to these infrequent encounters seems improbable because this would imply a long-distance effect (e.g. the motor walks on the wall and this causes the tip to polymerize slowly) or some kind of memory (e.g. the motor did something to the tip and even after the motor detaches the rate of assembly remains slower than normal). Other explanations are possible. For example, are there any differences in the buffer conditions? The authors did not provide the final concentrations for buffers in which these observations were made, but the methods section suggests that the experiments with MD-CC1 were done in the presence of some additional reagents (e.g. detergent) and TEV protease, while EB3 control experiments lacked these additions. The authors should rule out this trivial explanation by adding GFP protein purified analogously to MD-CC1 to their EB3 control. If it really appears that microtubule growth is perturbed even when no MD-CC1 molecules are seen at the tip, the authors should add a discussion about possible molecular mechanisms for this very striking observation. A similar conclusion was made for the full length motor, but again microtubule polymerization appears to have been slowed when only a few motor molecules were present at the tip.

To address this concern, we have purified GFP alone from HEK293T cells using TEV protease cleavage (see Figure 1—figure supplement 3 for an image of a Coomassie blue stained SDS PAGE), and performed microtubule dynamics assays with this protein as a control. We observed no effect of GFP alone on microtubule polymerization, while increasing concentrations of the MD-CC1 protein slowed down microtubule growth (new Figure 1J,K). A further argument that the observed effect is real and not an artifact of our in vitro assay is provided by the observation that a similar approximately two-fold decrease of microtubule growth rate was induced by expressing MD-CC1 of KIF21B as well as it homologue KIF21A in cells (Figure 1G). New kymographs, including an enlargement that illustrates better the behavior of KIF21B MD-CC1 proteins in vitro are now included in Figure 1J and Figure 1—figure supplement 4.

Additional information on the concentrations of the buffers used in the in vitro assays is now included in the Materials and methods section.

We fully agree with the reviewers that the obtained results are somewhat puzzling as KIF21B motors slow down microtubule growth although they do not accumulate at tips. We think that the most likely explanation is that motors running off the microtubule plus end somehow alter its structure by affecting the conformation of the terminal tubulin dimers with which they interact, and this has an effect on the addition of new tubulin dimers. We note that in our very recent paper on the mechanism of microtubule growth inhibition by the anticancer drug Eribulin we showed that binding of single drug molecule (which can interact with only one tubulin dimer at a time) was sufficient to perturb growth of a microtubule tip by slowing down its polymerization rate (Doodhi et al., 2016). We think that in a similar mechanism, single KIF21B motors running off the polymerizing microtubule plus ends could transiently perturb their growth resulting in an overall reduction of the microtubule polymerization rate. We now discuss this point in the Discussion section of the revised manuscript.

Related to this concern, the microtubule growth rate (~4 μm/ min at 15 μm tubulin) shown in Figure 1H is quite fast compared to other reports in the literature. Please provide a complete plot of microtubule growth rate vs. tubulin concentration, with and without KIF21B as well as microtubule growth rate vs KIF21B concentration.

The experiment described here was performed in the presence of EB3, which we have shown previously to accelerate microtubule polymerization (Komarova et al., 2009). We have now also included a plot of microtubule growth rates at different concentrations of KIF21B with and without EB3 (Figure 1K) to show that the reduction in growth rate is stronger at higher KIF21B MD-CC1 concentrations, and that this effect does not depend on the presence of EB3. We do not think that using different tubulin concentrations in these experiments will provide any additional mechanistic insight into the activity of KIF21B MD-CC1 and therefore did not include them.

2) That single molecules of KIF21B may be sufficient to cause microtubules to cease growing and shortening is fascinating. The main evidence is Figure 2D, where a kymograph shows an alleged single molecule hitting the end and causing it to pause. However, the authors do not pursue this phenomenon at a mechanistic level, or provide a reasonable discussion that explains the observation. Both should be addressed in a revised manuscript and the following points must be taken into account:

A) What is the positional resolution of that experiment? Has the microtubule really paused, or has growth simply dropped to a level that is below detection?

The resolution of our experiments is certainly limited by the diffraction limit as well as the pixel size of the camera, and therefore, we cannot resolve individual tubulin dimers. Thus, we cannot distinguish genuine pausing from very slow microtubule growth or shortening. However, we include in the assay both Rhodamine-labeled tubulin and mCherry-EB3 to facilitate detection of microtubule growth and detect pauses by observing the loss of enrichment of the red EB3 signal at the microtubule plus end, which indicates that microtubule growth was at least very severely slowed down. Furthermore, we have added new data showing that when a microtubule extends beyond the point of KIF21B attachment to the microtubule plus end, the growth of this microtubule is strongly perturbed: we observed either short growth or shortening excursions, and/or strongly increased flexibility of the extending microtubule, suggesting that the growing tube might be incomplete. These data are reminiscent of our recently published data on the microtubule targeting agent Eribulin, where we found that a single drug molecule, which can block only a single protofilament, can significantly perturb microtubule growth (Doodhi et al., 2014). The main difference between KIF21B and Eribulin is that KIF21B can also stabilize microtubule plus ends, while Eribulin can only perturb microtubule elongation but has no stabilizing effect. We therefore propose that pausing by a single KIF21B molecule is caused by occluding only some protofilaments, while the rest remain dynamic and may grow and shorten for some distances.

B) It is suggested that the affinity of the WD40 domain for GMPCPP tubulin might stabilize motor-tip interactions, but this hypothesis still cannot explain an enzyme activity that probably involves more than one protofilament. A discussion of motor dimensions may help. The WD40 domain, for example, is 4 nanometers in diameter. What is the predicted length of the stalk? Can a single KIF21B motor crosslink multiple neighboring protofilaments?

KIF21B is a long polypeptide which contains potentially unstructured regions that can be quite extended that could allow the folded domains of KIF21B to interact with different sites on the microtubule. A KIF21B dimer contains six potential microtubule-interacting regions – two motors, two WD40 domains and two microtubule-binding regions in the stalk, which could all interact with the same or different protofilaments. As also mentioned above, our recently published experiments with Eribulin (Doodhi et al., 2016) showed that an agent binding to a single tubulin dimer at the microtubule tip is sufficient to strongly perturb microtubule growth. Therefore, one or two KIF21B molecules bearing six microtubule binding domains each can indeed be envisaged to induce transient microtubule pausing (or strong growth inhibition) even if they do not occlude all protofilaments of a microtubule. These aspects are now discussed in the Discussion section of our revised manuscript.

A minor issue related to this point concerns the purity of the KIF21B preparation (Figure 1—figure supplement 2). What is the stoichiometric band that runs at ~65 kDa? Are the authors sure that this protein is irrelevant for the observed KIF21B effect on microtubule dynamics?

To address this comment, we performed a complete mass spectrometry analysis of our purified proteins (see new Supplementary file 1). We did not find any microtubule regulators in our purifications; the main contaminants are chaperones, spectrin, vimentin, desmoplakin and 14-3-3 proteins. The ~65 kDa band corresponds to a heat shock protein. We note that the contaminants observed in KIF21B full length (FL), FL-ΔrCC and MD-CC-ΔrCC samples were very similar, while only the full length KIF21B protein efficiently caused pausing, supporting the specificity of the observed effect.

C) The FL motor kymographs in Figure 2 are difficult to see, but almost all of the visible events in panel D are consistent with "stay on MT lattice" behavior, while the authors claim that the majority of events (~45%) are pausing of MT growth. The pausing is very striking and compelling for high motor decoration, but is the same phenotype observed for the dim complexes, which might be single molecules? For example, in panel D, the first 2 events in the upper kymograph have dim signals and are clearly "lattice" events. The third event with a somewhat brighter complex does look like pausing, but strangely the pause appears to start before the motor arrives. In the second row of kymographs the first event is also clearly a wall-bound complex that does not induce pausing. In the leftmost kymograph in Figure 2—figure supplement 1, the microtubule tip appears to pause even in the absence of any complex. In the middle panel in the same figure one pause starts before the motors arrive.

We now show better examples of pausing events induced by single KIF21B motors (see Figure 2F); we also show plots of motor intensity overlaid with plots of microtubule growth and X-Y plots of the motor vs microtubule tip position (see Figure 2F). We note that we have never observed any pausing in our in vitro assays in the presence of EB3 alone, and all observed pauses could be correlated with the presence of KIF21B at the microtubule tip. However, it is true that we did observe events when microtubule polymerization appeared to slow down before the arrival of KIF21B and subsequent pausing. It is possible that a slower growing microtubule is more easily converted into a pausing state. Furthermore, as discussed above, we now provide a more extensive illustration and analysis of the “stay on the lattice” events (Figure 3—figure supplements 1 and 2), and show that such events are often manifested by microtubule growth perturbation, though not a complete pausing, and are consistent with idea that a single KIF21B molecule would block growth of a few protofilaments.

D) The lines for moving motors are segmented, with only 3-6 dots per 2 micron (based on Figure 2 —figure supplement 1 images). Thus, single GFP dimers near the tip would be easy to miss (see rightmost image in the supplemental figure where only the longest lines are clear). This raises the possibility that several molecules could cause pausing events. Please provide more images with improved time resolution and better contrast to determine if single molecules can indeed induce pausing. XY plots for motor vs. tip position should also be presented.

As indicated above, we now show the plots of motor intensity vs motor position/microtubule elongation (Figure 2F, Figure 3—figure supplement 1). Collecting the data with a better temporal resolution proved difficult because at low motor concentrations, the pausing events are quite rare, so a lot of material needs to be screened in order to find them. At higher KIF21B concentration all seeds are blocked and no microtubule growth/pausing events can be observed.

E) Plotting the duration of pause vs. tip brightness will address the concern that the pauses are brought about by multiple molecules.

Plots of motor intensity vs motor position/microtubule elongation are shown in Figure 2F, H.

F) The quantification of the number of GFP molecules is very important for this study. For example, the evidence in Figure 2G is not very convincing. The population of molecules appears to be very heterogeneous. The authors should show bleaching step analysis with pairwise intensity distributions, as is common in the single molecule field. The impact of the evanescence field depth should also be taken into account and discussed.

Over the past years, we have tested and applied multiple approaches to carefully analyze the number of GFP-tagged proteins involved in microtubule-based events (e.g. Kapitein et al. JCB 2008, Curr Biol. 2008, Doodhi et al., 2014, 2016). We, as many others, have found that the rich photophysical properties of GFP (e.g. blinking and different fluorescent states, Dickson et al. Nature 1997) make a bleaching step analysis not as reliable as it can be for stable organic dyes. While example traces with clearly identifiable bleaching steps can certainly be observed and analyzed (new Figure 1I, 2B, 5A), a more reliable approach is to compare the initial, pre-bleach intensities with known standards measured in the same conditions, as shown in Figure 1H, 2A and 5A. We now also show that the histogram of intensities of individual GFP fluorophores can be fitted with lognormal distribution (Figure 1H, 2A, 5A). This fact precisely accounts for the effect of evanescence field on otherwise expected normal distribution of intensities.

3) The claim that the full-length motor induces catastrophe is not well justified. Please provide quantitative data to confirm this.

We now show a clearer example of a catastrophe induction event as well as a quantification of the catastrophe frequency in the presence of full length KIF21B (Figure 3A, C).

4) The authors provide velocity measurements for KIF21B constructs (full length and MD-CC1) that are expressed in cells. Do these represent the speed distributions of single molecules or motors that travel in teams? Either should be substantiated by fluorescence intensity distributions of GFP spots that have been tracked.

While the velocity of kinesins in cells can be determined unambiguously from kymographs, obtaining meaningful intensity distributions is much more difficult due to low signal and high background in the images. We note that we do not make any conclusions about the single molecule behavior or clustering of KIF21B in cells.

5) Although GFP intensity measurements for full length KIF21B are provided (Figure 2F) – which support the conclusion that KIF21B is a dimer – similar measurements are not provided for other constructs. In some cases, statements are made that are not supported by such data, for example "We conclude that the motor domain of KIF21B in a dimeric configuration is motile and can inhibit but not block microtubule plus-end depolymerization". This should be addressed.

GFP intensity measurements, demonstrating that these proteins are dimers are now shown for all motile KIF21B constructs used in this study (Figure 1H, I, Figure 2A,B, Figure 5A).

6) There is some negative-stain EM that is presented as evidence that KIF21B is folded and globular. Please include more than 2 images as evidence, perhaps in a small gallery in the Supplement.

Additional EM images are now included in Figure 4—figure supplement 1D-F.

7) Why do so few KIF21B molecules can escape the seed area (see Figure 2A). A higher affinity for the seed might recruit motors there, but why are they stuck?

It is possible that the border between the seed and the GDP microtubule lattice displays some defects to which KIF21B preferentially binds. This possibility is now mentioned in the Discussion section of our revised manuscript.

8) The data on the length-dependence of these results (Figure 2B) is underdeveloped relative to the data on other kinesin-4's and especially kinesin-8's.

We have now extended the data demonstrating that the ability of KIF21B to block microtubule seeds depends on the length of the seeds (Figure 2D). Unfortunately, we cannot extend these data to studies of the length-dependence of the effect of KIF21B on dynamic microtubules, because in the conditions that we used all landing events are observed on the seeds, and the motors that do move on to GDP lattice are highly processive.

9) The extent of protein overexpression in cells (Figures 1 and 3) is not document or discussed.

The COS-7 cells used in this study do not express endogenous KIF21B (this is now mentioned in the first paragraph of the Results section of our revised manuscript), and therefore we cannot discuss the level of KIF21B overexpression in this system. The experiments in cells are used only to illustrate the ability of the motor to strongly block microtubule growth, as support for this otherwise in vitro study. We do not make any strong conclusions about the cellular activity of the protein.

10) It is interesting that the L-WD40 construct localizes strongly to the GMPCPP seed, but what is the explanation for why the construct does not localize to growing microtubule tips (Figure 4C)? If the WD40 domain of KIF21B "senses" the nucleotide state of tubulin within the lattice, then one might expect for it to target tips (similar to TPX2, as recently shown by the Surrey laboratory). That it does not suggests that the interaction is blocked by a feature at microtubule plus ends, perhaps curvature. Related to this point, L-WD40 localizes uniformly along the microtubule lattice in cells (Figure 3B), which is presumably representative of GDP-tubulin binding. This requires clarification.

It is still not clear how well microtubule lattices bound to different GTP analogues mimic the tubulin states present at the growing microtubule tip and how these states are distributed at the tip. Therefore, the isolated L-WD40 domain might be difficult to detect at the microtubule tips because the number of actual high-affinity sites is low, or because the conformation of these sites, e.g., the curvature, is different at the growing microtubule tips. Furthermore, using mass spectrometry analysis of KIF21B binding partners, we have detected weak interactions between the WD40 domain and some MAPs (which are not present in our purified KIF21B samples due to high salt washes). Describing these interactions and their impact on KIF21B function goes beyond the scope of this manuscript, but we think that they might contribute to the uniform distribution of L-WD40 domain along cellular microtubules. These MAPs could in fact serve as additional microtubule loading factors for KIF21B in cells, explaining how KIF21B would attach to microtubules in the absence of a GMPCPP seed. Furthermore, tubulin post- translational modifications could also play a role. Thus our in vitro reconstitutions cover only a part of the complexity of KIF21B interactions with microtubules, as now discussed in the Discussion section of our revised manuscript.

11) The authors emphasize repeatedly that L-WD40 domain shows "strong preference" for the GMCPP lattice, speculating about the implications of this property for motor's behavior at the tip. This statement is based on couple images in Figure 4—figure supplement 1, in which GMPCPP seed and GDP microtubule walls are compared. However, these microtubule fragments differ in other respects, such as percent of labeled tubulin, biotin label and attachment to the coverslip (seed is attached while the GDP part is not). Moreover, this experiment was done with cell extracts, rather than with purified proteins, so many other MAPs were present. To be certain that L-WD40 can discriminate different microtubule lattices, microtubule binding affinity should be quantified using purified proteins and similarly prepared and coverslip-attached microtubules.

12) Please provide histograms of run lengths and velocities, not just their averages.

We have now compared side by side the binding of purified L-WD40 domain at different concentration to GMPCPP- and taxol-stabilized seeds, which were prepared and attached to glass in the same way, and found that, in agreement with our previous conclusion, the L-WD40 fragment strongly preferred GMPCPP seeds but displayed no specific affinity for taxol-stabilized seeds (Figure 5D, Figure 5—figure supplement 1B).

13) The authors did a great job dissecting the domain structure of KIF21B, and the microtubule binding results are represented clearly with Table in Figure 3A. An analogous table for the in vitro data should be included.

A table summarizing the microtubule-binding results for different KIF21B mutants in vitro is shown in Figure 5—figure supplement 1C.

14) Please describe all buffer conditions in more detail (see major point 1). Also, is ATP present in the buffers used for the microtubule co-pelleting experiments (Figure 3C)?

A more detailed description of buffer conditions is now included in the Materials and methods section. No additional ATP was added in the pelleting assay.

15) A short discussion on how the results obtained in this study compares to the recent paper by Muhia et al., published in Cell Reports should be included. Muhia et al. find that microtubule growth rates are increased by KIF21B: in their hands, microtubules grow faster when the motor is overexpressed, and slower when the motor is depleted. Muhia et al. do show that KIF21B reduces the average time to catastrophe (although the effect is quite modest), which is consistent with results here.

We have now included a short discussion on the comparison of our results with those of Muhia et al. (which appeared after our paper was submitted) in our revised manuscript. In brief, In KIF21B knockout neurons, the length of growth episodes detected with EB3-GFP was increased while the growth rate was decreased, which would be consistent with the idea that the presence of KIF21B induces either catastrophes or pausing, since both types of events would cause a loss of EB3 signal. If the primary impact of KIF21B is through interrupting growth episodes, the effect of its loss on microtubule growth rate could be indirect, by affecting the tubulin pool, which would be decreased if more microtubules keep growing in the absence of KIF21B, and this would result in a slower growth rate.

In Hela cells, Muhia et al. observed that the overexpression of the full length KIF21B, a KIF21B construct lacking the C-terminal part (similar to our MD-CC1) as well as a KIF21B point mutant in the motor domain all reduced the length of microtubule growth episodes, and that the full length protein also increased the growth rate and increased the catastrophe frequency. The increase in catastrophe frequency is consistent with our data, as described above. However, the changes in growth rate are not consistent: we observe a reduction of microtubule growth rate induced by KIF21B-MD-CC1 and the full length KIF21B both in COS-7 cells and in vitro, while Muhia et al. see an opposite effect with the full length KIF21B in HeLa cells. Unfortunately, no images of different overexpressed constructs are shown in the Muhia et al. study, and it is thus unclear whether in the conditions used, the proteins decorate microtubules, accumulate at microtubule tips, etc, making it difficult to directly compare the two datasets. The difference between the results obtained by us COS-7 cells and the results by Muhia et al. obtained in HeLa cells might be due to differences in the cell type used. COS-7 cells express no endogenous KIF21A or KIF21B, while HeLa cells express KIF21A and display very strong regional differences in microtubule plus end dynamics (cortex vs cell interior) dependent on the localization of this protein (van der Vaart et al., Dev Cell 2013). The potential interplay between KIF21A and KIF21B is currently unclear. Therefore, it is difficult to make a conclusive comparison between the KIF21B overexpression results obtained by us in COS-7 cells and by Muhia et al. in HeLa cells, and we prefer not to comment on this specific issue.

[Editors’ note: what now follows is the decision letter after the authors submitted for further consideration.]

Three reviewers, whose evaluation was overseen by a Reviewing Editor, have now reviewed your revised manuscript. While all agreed that this was a stronger manuscript, unfortunately there were remaining major concerns that preclude acceptance for publication in eLife. We hope that these specific comments will help you revise your work for publication elsewhere.

1) The reviewers continued to be unconvinced that single molecules of KIF21B cause pausing, a statement that was toned down in places in the manuscript, but explicitly stated in others. Some comments included:

– The KIF21B preparation appears to be heterogeneous (as evidenced by the broad distribution of brightness in Figure 5A). There are many noticeable differences in brightness throughout the kymographs that are shown. This raises the possibility that multiple motors are being analyzed in some cases.

Some heterogeneity is inherent to all single molecule experiments, but, as shown in more detail below, we have additional data demonstrating that we are mostly observing one or two KIF21B molecules walking on microtubules and that a small number of KIF21B molecules is sufficient to induce microtubule pausing.

– The brightness of single GFP molecules is compared to KIF21B. However, single GFP molecules will be present on the glass surface, while KIF21B will be located on the MT. This places GFP and KIF21B in a different region of the evanescent field, which decays exponentially. This could also lead to an underestimate of the number of KIF21B molecules.

As outlined below, we have already published an analysis where we compared the intensity of single GFP molecules on glass to GFP-tagged kinesin-1 dimers (KIF5B deletion mutant 1- 560, which contains the motor domain and a dimeric coiled coil) walking on microtubules (Doodhi et al., 2014). As a result of being slightly further away from the cover slip, dimeric kinesin-1 was not 2-fold brighter than a single GFP molecule, but only by a factor 1.7-1.8. This fits very well with the data in the plot shown in Figure 2G of the previous version of the manuscript (Figure 5A of the new version of the paper), where we compare the intensity of motors inducing microtubule pausing with the intensity of immobilized dimers and find a ratio of 0.75-1.9, consistent with 0.9-2.2 motors (based on multiplication by 2/1.75).

In the newly revised manuscript, we have now also compared the intensities of GFP-tagged kinesin-1 (amino acids 1-560 of KIF5B, denoted KIF5B-560), which are dimers based on our own analysis as well as numerous previous publications, to our KIF21B full length molecules moving on microtubules in separate chambers on the same coverslip and thus in identical imaging conditions. We found that these intensities were the same, confirming our conclusion that we are observing events of motility and pause induction by one or two KIF21B molecules.

– Photobleaching of KIF21B that could induce pausing was not taken into account. Prior photobleaching could also lead to an underestimate of the number of molecules present.

Essentially, the concern here is that fluorescent spots that we interpret as one or two KIF21B molecules are in fact larger but partially photobleached oligomers that managed to escape from the seed to the dynamic microtubule lattice and appear as dimers on the latter part of the microtubule. First, we now show that most of the experiments described in the paper were performed at a laser power and frame rate where the average kinesin photobleaching time (~200 s) was significantly longer than the duration of kinesin runs (tens of seconds) (new Figure 5—figure supplement 2). We have also included in the paper a new experiment, in which we show an example of an event observed at a 12 times higher frame rate (and thus with a ~12 times shorter bleaching time) (Figure 5H,I of the revised paper). In this case, photobleaching does occur, and the intensity of the imaged KIF21B molecule is reduced by half, supporting the notion that it is a dimer. Furthermore, we provide a comparison of intensities for molecules moving on the seeds to molecules moving on dynamic microtubules to illustrate that the movements from the seed to the dynamic microtubule lattice do not occur preferentially for larger oligomers of KIF21B (Figure 5E, Figure 5—figure supplement 1). Finally, we directly compare intensities of motile single KIF21B molecules to the intensities of single KIF5B-560 molecules, which are known to be dimers, and show that they are very similar (Figure 5F-I).

2) Perhaps most troubling, in two places in the revision the figures that are shown do not match the data described in the text.

– In Figure 1J at 2 nM MD-CC1 KIF21B moves towards the microtubule plus end, but at 10 nM MD-CC1 KIF21B appears to move in the opposite direction. Does this mean that it was difficult to distinguish plus and minus ends? How often where minus ends confused with plus ends? This is not discussed in the text and is quite troubling.

We very sincerely apologize for the mistake in preparing this figure. While microtubule plus and minus ends were easily distinguished based on the directionality of the motor, we inadvertently showed the wrong end in one of the panels. In the conditions shown in this panel (10 nM KIF21B-MD-CC1), the growth rate of microtubule plus and minus ends was almost the same (compare new Figure 2G with Figure 2—figure supplement 3B), while normally microtubule plus ends grow in vitro significantly faster than the minus ends. This observation demonstrates once again that the effect of KIF21B-MD-CC1 is not due to some impurities in the protein preparation, which affect the assay, but is rather due to a specific effect on microtubule plus end growth, as the rate of minus end polymerization is not altered. These data are now illustrated more clearly in the revised Figure 2C, G, and Figure 2—figure supplement 3B.

– The text claims that pausing is never observed in the presence of EB3 alone and that all observed pauses correlated with the presence of KIF21B. However, there are numerous examples where this is not the case: 1) Figure 1—figure supplement 4: there is a pause in the presence of 10 nM GFP. 2) Figure 2—figure supplement 1: in the first panel the second pause is not associated with GFP-labeled KIF21B. 3) Figure 3—figure supplement 3 it appears that the microtubule is already paused prior to KIF21B-GFP arrival.

We believe that this comment is incorrect: the examples listed above with the exception of one are not in the presence of EB3, and the last example in fact shows no pausing without KIF21B, as explained below and now illustrated better in the revised paper (Figure 3—figure supplement 2 in the current paper version, formerly Figure 3—figure supplement 3). We fully acknowledge that small pauses (or events that can be mistaken for pauses due to irregular microtubule lattice labeling) can be seen when microtubule dynamics are imaged with rhodamine-tubulin alone. This was exactly the reason why for most of the analyses in this paper, we have used the conditions when microtubules were labeled with both rhodamine-tubulin and mCherry-EB3, as this allowed us to unambiguously distinguish between microtubule growth and pausing.

The detailed comments of the reviewers are below.

Reviewer #1:

The revised manuscript by van Riel et al. contains a substantial amount of new data. Most new data relate to reviewers' comments. It is notable, however, that the authors now include new data that address the mechanism of Kif21B autoinhibition (Figure 4—figure supplement 3).

Overall, I found the revised paper to be significantly improved. I still remain mystified by how single Kif21B molecules can affect microtubule plus-end dynamics (even after the plus-end has extended beyond the point of Kif21B-microtubule association), and was not terribly satisfied by its comparison to the Eribulin. However, the work has been carefully conducted and contains the appropriate controls. I now support publication of this manuscript in eLife.

We acknowledge that we do not have a biochemical explanation of the effect of KIF21B motor domains on microtubule growth. Detailed structural studies similar to those performed over the years with kinesin-13s would be needed to understand the mechanism, and such studies obviously go beyond the scope of this paper. Our data on Eribulin published in our recent Current Biology paper (Doodhi et al., 2016) represent the first demonstration that blocking of a single microtubule protofilament is sufficient to very significantly perturb microtubule growth when a microtubule extends beyond the point of Eribulin attachment. These data suggest that protofilaments can elongate asynchronously: when one protofilament is blocked, the remaining ones can grow, but when a microtubule is incomplete, its growth is perturbed.

We agree that more data are needed to make this concept generally accepted. In fact, by showing that full length KIF21B molecules that stay on microtubule lattice can perturb microtubule growth beyond the point of their attachment, we provide independent support for this concept. In particular, we show that if KIF21B stays attached to the microtubule plus end but the microtubule keeps growing, microtubule polymerization becomes irregular, it can alternate between phases of growth and shortening, and microtubule elongation is often accompanied by bending. All these aberrations suggest that the microtubule extending beyond the site where KIF21B is immobilized is incomplete. These data are now illustrated better in the new Figure 4, and additional examples are provided.

Further, we propose that in case of dimeric KIF21B motor domains, the proteins do not stay on the microtubule plus ends, but their transient association with these ends can still be sufficient to transiently perturb the structure of the tip and thus reduce its growth rate. We have now obtained some experimental support for this idea. We reasoned that transient perturbation of the microtubule tip might be reflected in the brightness of the EB3 signal. Therefore, we performed the assay in the presence of 1 nM KIF21B-MD-CC1-GFP (to make the assay less crowded with the proteins running on microtubules) with faster imaging conditions (50-100 ms/frame). As shown in the new Figure 2I, in these conditions, we could clearly see KIF2B-MD-CC1-GFP molecules running on microtubules and hitting the microtubule tip. In these conditions, we often see a reduction of EB3 signal, suggesting an alteration at the microtubule plus end in the presence of KIF21B-MD-CC1-GFP.

To quantify this effect, we analyzed fluctuations of EB3 intensity in the presence of 1 nM GFP or 1 nM KIF21B-MD-CC1-GFP in separate chambers on the same coverslip, in the same imaging conditions. In the plots shown in the new Figure 2J,K, we characterized the distributions of EB3 intensities (normalized to the maximum value) during the course of a growth event. If EB3 intensity would be constant, the average value would be close to the maximum value and the distribution would be narrow with a mean in the range of 90-100%. If the signal frequently fluctuates between 0 and 100% of the maximum intensity, the distribution would be more wide and flat, resulting in a smaller mean value and a larger standard deviation (SD). We note that this analysis is not dependent on the absolute growth rate of microtubules, which can affect the absolute EB3 signal, because the analyzed intensities were normalized to the maximum value. In both cases, we excluded from our analysis the EB3 signal during the last phase of growth before catastrophe, since it is known that at this point the comet intensity is reduced (see, for example, Maurer, Fourniol et al., 2012, Cell; Mohan, Katrukha et al., 2013 Proc Natl Acad Sci USA). The data show that in the presence of 1 nM KIF21B-MD-CC1, fluctuations of EB3 signal are more pronounced than in the presence of GFP (Figure 2K of the revised manuscript). These data suggest that the occasional arrivals of KIF21B-MD-CC1-GFP can affect the structure of the growing microtubule tip and this might be the reason behind the slower microtubule growth rate in the presence of this kinesin fragment.

Reviewer #2:

The authors have addressed many critical points, leading to a stronger manuscript. However, the main criticism concerning the authors' claim that a single molecule of KIF21B is capable of causing specific modulation of the microtubule tip behavior has not been addressed fully. Although some statements to this effect have been softened in the main text, this claim is firmly stated in several places, e.g. see impact statement or labels in Figure 5G,H.

I am concerned about this statement because there are multiple indications in this manuscript that the molecular composition of KIF21B preparation is heterogeneous: the distribution of brightnesses of these molecules is broad (e.g. see Figure 5A and point 2 below), there are visible differences in the brightness of molecules in virtually all kymogpraphs (e.g. see Figure 3A) and movies (e.g. Video 2, Figure 3—figure supplement 3), there are visible differences in the size of globules attributed to KIF21B in EM images (some globules are almost 15-20 nm in diameter, exceeding the size of single molecule of Kif21B molecular weight), and the molecular effects at microtubule tip are also heterogeneous (e.g. some molecules induce pausing, while others induce catastrophe). My interpretation of these results is that small oligomers, not just the single molecules of KIF21B, are present in experimental chambers, which is often the case with purified proteins.

We certainly agree that there is some heterogeneity in our KIF21B preparations. The question is if all effects that we see are caused by the small fraction of multimers that could be present in our preparation. As detailed below, we have now performed a series of additional control experiments that, in our view, justify the interpretation that most motile entities represent one or two KIF21B molecules. Most importantly, we now systematically performed the assays with KIF21B side-by-side with experiments using the robustly dimeric KIF5B motor.

As to the heterogeneity of effects on microtubule growth, we note that this is intrinsic to the dynamic instability of microtubules – some microtubules grow and some switch to shrinking, and this reflects many factors such as “aging” of a microtubule tip. It is possible and even likely that depending on the state of the microtubule tip, a certain type of transition such as pausing or a catastrophe becomes more likely.

To support their claim that only single molecules can elicit certain effects the authors provide few selected examples in which one fluorescent complex appears to lead to some specific effect (e.g. pausing) but the rigorous proof that these specific dots correspond to 1 or 2 Kif21B molecules is lacking. Many or some of these dots, in my opinion, could correspond to complexes of 3-4 molecules, consistent with the heterogeneities listed above. I do not think the slightly larger size of the complexes changes the main message of the paper, but if the authors insist on their quantitative 1-2 molecules statement, I will have to ask for a more convincing evidence. This manuscript is considered for a publication in a very visible and respected journal, so keeping high standards for single molecule aspects in this paper is important.

We agree with the reviewer that even a slightly larger size of a KIF21B cluster will not affect the main conclusions of our paper. We have now formulated our conclusions more carefully.

Specific criticism of the brightness analyses in this paper:

1) The single most important quantification that is lacking in this paper is a quantitative comparison of the brightness of a single GFP molecule with the brightness of the complexes at the MT tip imaged under identical conditions and while taking into account the differences that could not be eliminated. Brightness of single GFP molecule is measured in this paper but it is reported in the manner that prevents any meaningful comparisons. Indeed, brightness of a single GFP molecule is roughly 2,000 au in Figure 1 H and I; 5,000 au in Figure 2A; ~1,200 au in Figure 2B; in the range of 1,700- 2,500 au in different panels in Figure 5A. At the same time, the authors claim that brightness 20 au corresponds to a single motor (2 GFPs) in Figure 2F, ~ 40 au and > 60 au in Figure 3—figure supplement 1 A and B. This clearly illustrates a lack of effort to use these quantifications for obtaining a convincing estimate of the number of GFP molecules at the microtubule tip.

The absolute intensity of a single GFP molecule depends on the imaging parameters that could not be kept entirely constant from one experiment to another or were actively altered depending on the aim of the experiment (e.g. exposure time and frame rate). To enable robust quantifications and comparisons, we used for each quantification (Figure 2A,2D, Figure 3—figure supplement 1A, Figure 5C and 7A) an additional control lane of GFP on the same coverslip, with the exactly same TIRF angle, the same focus plane, the same laser power and the same imaging conditions. This is where we put extra effort to provide robust quantifications for obtaining convincing estimates, no matter how different the imaging conditions might be. As shown in the paper, the average GFP intensity value indeed differed 2-5 times among our experiments, but since we always used the same reference GFP lane, we were able to compare the quantifications with each other.

The second point is the order of magnitude difference in the signal intensity for GFP number quantifications (Figure 1H, 2A and 5A, which are Figure 2A, Figure 3—figure supplement 1A and 7A in the new version of the paper) and for kinesin molecules in microtubule dynamics assays (Figure 2F,H, 3A, corresponding to new Figure 3C, 3F and 3D). This reflects different laser power levels used for imaging in these conditions. In the first case, we intentionally used high laser power to observe bright single step bleaching events, which happened during 5-10 seconds (Figure 2A, Figure 3—figure supplement 1A and 7A of the new version of the paper). For imaging of microtubule dynamics (e.g. Figure 3C,D,F,G, Figure 3—figure supplement 1C, Figure 3—figure supplement 2, Figure 4, 7E of the new version of the paper), we used 5-10 times lower laser power with 10-12 times lower frame rate to prevent photobleaching of GFP fused to kinesin molecules. This also partly addresses the concerns of the reviewer about photobleaching conditions (see below).

To address this omission, the authors should provide all peak values with errors for their fits and use consistent imaging conditions and data representation, so that all measurements for single GFP reported in this work are consistent and can be used to compare with the brightness of kinesin molecules that elicit certain response at the microtubule tip (e.g. pausing, see previous criticism 2E, which has not been addressed).

All fitted parameters with corresponding errors of fit are provided in Supplemental file 2 (please note that within the figures, median intensity values are indicated). Further, as argued below, we have also now re-performed experiments with full length KIF21B using a proper dimeric intensity standard within the same experiment (i.e. in a parallel sample chamber). In our opinion, this is the most robust way to address the major concerns of this reviewer.

For accurate comparison, the authors will have to take into account two additional factors that can greatly affect their conclusions:

First, brightness of single GFP molecules was measured in this work at the coverslip surface, while microtubule tips are located at some distance away. I do not believe that measuring this distance for every event can be done (or should be done) accurately, but since the evanescent field decays exponentially, this effect cannot be simply ignored, as in this paper. Approximate estimate of the average depth at which MT tips were imaged should be obtained and used to calculate the brightness at the coverslip surface. Without such an adjustment, the ratio of approximately 1 of Kif21B intensity at the microtubule tip to the GFP intensity on the coverslip (Figure 2G) cannot be used to argue that these complexes have the same number of molecules.

Indeed, the exponential decay of the evanescent field can affect single molecule intensity analysis. TIRF angles used for imaging of our assays provided characteristic penetration depths in the range of 80-200 nm, same as in (Grigoriev, Akhmanova Methods in Cell Biology 2010). Under these conditions, if there is a 25 nm difference in z coordinates of two fluorescent molecules (equal to the maximum distance between the coverslip and the top of a microtubule), the very minimal relative intensity of a molecule lying further away from the coverslip should be ~75% of the molecule at the coverslip (Author response image 1). For a higher penetration depth, the signal loss will be less.

Author response image 1.

Author response image 1.

DOI: http://dx.doi.org/10.7554/eLife.24746.041

In our recent paper (Doodhi et al., 2014), we have already performed a similar comparison of “kinesin-on-top-of-microtubule” to the intensity of single GFP molecules absorbed on glass, see Supplementary Figure S2B in that paper and Author response image 2. At that time, we compared the intensity of KIF5B-560-SxIP-GFP molecules running on the lattice of microtubules to the single GFP intensity of the same molecules attached to the coverslip at the moment just before complete bleaching. Author response image 2 shows the two distributions of fluorescent intensities (values of intensities at the microtubule tips are removed from original Figure S2B of Doodhi et al. 2014).

Author response image 2.

Author response image 2.

DOI: http://dx.doi.org/10.7554/eLife.24746.042

KIF5B-560 construct is known to be a dimer. Our analysis provided the ratio of 154/90 = 1.7 between the median intensity values of KIF5B-560-SxIP-GFP and single GFP (estimated from the last bleaching frame), which is very close to a factor of 2. The relative signal can be estimated as 1.7/2 = 83%, which is close to the 75% estimation provided above.

To further validate and improve the intensity analysis in the current paper and address the concerns of the reviewer, we carried out a set of additional experiments. First, we performed comparisons of immobilized single GFP molecules to purified KIF5B-GFP molecules running on microtubules. We compared initial pre-bleach intensity of immobilized GFP to the intensity of KIF5B-GFP (5 nM) molecules moving on dynamic growing microtubules on the same coverslip (Figure 5C). The obtained ratio of median intensities KIF5B-GFP/GFP was equal to 1.8, i.e., again very close to the value of 2 (1.8/2=90%). This is in a good agreement with the requirement for KIF5B being a dimer to be able to walk on microtubules and with our previous estimations of the penetration depth. This additional control experiment reassured us that we can get reasonable estimates of GFP numbers in spite of the TIRF evanescence field effect and that we can use KIF5B-GFP moving on microtubules as a fluorescence intensity reference of GFP dimers imaged at the same average height.

We then compared intensities of KIF5B-GFP and KIF21B-FL-GFP measured in two different chambers on the same coverslip in identical conditions. Note that these imaging experiments were performed at a higher frame rate (100 ms vs 1.2 s/frame) and with a more sensitive camera than those shown in the other figures of the paper. This imaging regime allowed for obtaining nicer kymographs; however, it is less suitable for collecting statistics on different events because of higher photobleaching and much smaller number of events observed in each movie.

First, we compared the intensities of KIF5B-GFP with that of KIF21B-FL-GFP running on the microtubule seed, the growth of which was blocked by KIF21B-FL-GFP. The intensity distributions were very similar, suggesting that KIF21B-FL represents mostly dimers (Figure 5D). We then proceeded with a comparison of KIF5B-GFP to KIF21B-FL-GFP intensities on dynamic microtubules. We observed multiple KIF5B-GFP runs, while KIF21B-FL-GFP single molecule runs on growing microtubules were rare, because we had to use a very low KIF21B-FL-GFP concentration due to the very potent microtubule growth inhibition by KIF21B.

The observed intensity distributions of moving KIF5B-GFP and those rare events of KIF21B- FL-GFP running on both the seed and newly grown microtubule again were almost identical (Figure 5F-H). In Figure 5F-H, KIF21B-FL-GFP motility along the seed and microtubule lattice, arrival at the microtubule tip, induction of microtubule pausing and switching to depolymerization can be clearly distinguished. Further, we also compared the intensities of KIF21B-GFP molecules running on the seed and on the dynamic microtubule lattices observed on the same microtubule. In all the analyzed examples, the median intensities were found to be very similar (Figure 5E, Figure 5—figure supplement 1). These measurements argue against the idea that only larger KIF21B aggregates can “escape” from the seed to the freshly polymerized microtubule lattice.

Together, our new data indicate that the main conclusions of our intensity analysis remain valid when taking into account additional aspects of illumination and acquisition methods.

Second, the authors should provide evidence that they are justified to ignore bleaching. The initial intensity of GFP molecules was measured, while KIF21B dots were visualized for extended time. Few examples of Kif21B intensity kinetics on microtubule shown in this paper are too noisy to make reliable conclusions about the extent of bleaching during the observation time, so this issue should be addressed by direct measurements. This concern is valid especially for KIF21B because, as reported in this paper, this motor first binds at the GMPCPP seeds and only few molecules escape later and run along the GDP lattice. The exact time these "escaped" motors spent on the seed is not known. It is possible that only the relatively large clusters escape and that at this time some of their GFPs have already bleached.

Importantly, both factors, the z distance and bleaching, can lead to underestimation of the size of Kif21B complexes, so the dots that seem to contain 1-2 molecules may in fact be larger. Moreover, It has not been ruled out by the authors that processivity of Kif21B molecules, or their ability to walk on GDP lattice, or the strength of the effects they cause at the MT tip increase with increasing number of clustered molecules. Any one of these plausible possibilities could help to "select" larger complexes from heterogeneous population even if they were present in minor quantities.

As discussed above, KIF21B-FL-GFP motors escaping from the seed to the dynamic lattice have intensities corresponding to single dimers. Furthermore, we analyzed the average photobleaching time in the conditions used for the estimation of the number of molecules (Figure 3C, D, F, G, Figure 4, 5A and 7E, 1 frame per 1.2 s with 100 ms exposure time) and found that it was ~200 s (Figure 5—figure supplement 2), while the duration of kinesin runs was significantly shorter, on the order of tens of seconds.

To further illustrate that the effect of photobleaching is not significant and that end-binding of one molecule is sufficient to induce a pause followed by a catastrophe, we analyzed the trajectory of a moving KIF21B-FL-GFP molecule from the example shown in Figure 5H, where we were illuminating our sample 12 times more frequently (100 ms, stream acquisition) at a similar laser power. In this case, we measured the intensities of moving KIF5B-GFP molecules in a parallel chamber on the same coverslip. The characteristic values of median intensities of KIF5B-GFP are indicated in the plot in Figure 5I: as can be seen, the initial intensity of the analyzed individual KIF21B-FL-GFP molecule when it starts its movement on the seed is in the range of 1x median of KIF5B-GFP molecules. According to our previous reference measurements, this means that it is in the range of two GFP molecules, i.e., the molecule is a dimer. While it moves onto the freshly polymerized microtubule lattice, its intensity is reduced by half, which we attribute to the bleaching of one of the GFP molecules. After arriving to the microtubule tip and inducing a pause, the molecule bleaches or desorbs as the microtubule switches to catastrophe. These data show that the laser power used for illumination was gentle enough for 20 seconds of imaging of a single molecule at 10 frames per second. This fits well with the average photobleaching time in these conditions, which was found to be ~16 s at 100 ms/stream acquisition (Figure 5—figure supplement 2). As indicated above, in our regular experiments, where the data are acquired at a 12 times slower frame rate, the average bleaching time is ~12 times higher, and thus much longer than the characteristic duration of kinesin runs. These data indicate that photobleaching does not significantly affect our conclusions.

Other errors in the manuscript:

2) In the rebuttal letter and manuscript text the authors state that the lognormal distribution (Figure 1H, 2A, 5A) of the intensities of individual GFP fluorophores "precisely accounts for the effect of evanescence field on otherwise expected normal distribution of intensities". No reference was provided. I am not familiar with this effect and believe that this statement is wrong. Methods section explains that these intensities were collected from molecules attached to the coverslip surface, so all molecules were positioned in the same plane. The decay in intensity at distances away from the coverslip is therefore irrelevant for interpreting the shape of these experimental distributions. Moreover, even if the molecules were located at variable distances from the coverslips, this would have increased the proportion of molecules with the lower than peak intensity. The lognormal shape of the distribution, characterized by the presence of complexes with higher than peak intensities, can be caused by other experimental factors.

The lognormal distribution of single molecule intensities imaged using TIRF setup is a phenomenon observed before, see for example: Mutch SA, Fujimoto BS,et al. Deconvolving single-molecule intensity distributions for quantitative microscopy measurements. Biophys J. 2007 Apr 15;92(8):2926-43; Mehta SB, McQuilken M, et al. Dissection of molecular assembly dynamics by tracking orientation and position of single molecules in live cells. Proc Natl Acad Sci U S A. 2016 Sep 27. pii: 201607674; and references therein. However, we agree with the reviewer that we do not have enough experimental data to claim the precise physical mechanism underlying this effect, so we have removed this explanation and used lognormal fitting only as a descriptive tool.

First, by a relatively high density of molecules on the coverslip, so that 2 or 3 single molecules could not be resolved. This explanation is indeed possible in the current work because the authors use 2-9 times higher density than recommended by others for this type of analysis (Jain et al., 2012). Second, the lognormal shape is expected for heterogeneous preparations, so it may simply reflect presence of a significant proportion of complexes that are larger than single molecules. This second possibility supports my concern that the actual size of Kif21B complexes acting at the microtubule tip is larger than stated by the authors.

We assume that the reviewer refers to the paper by Jain, Liu, Xiang and Ha (Single-molecule pull-down for studying protein interactions. Nat Protoc. 2012 Feb 9;7(3):445-52), and, more specifically, to Figure 4 in this paper.

We went back to our raw data and performed precise density measurements for our quantifications and found that they were in the recommended range of 0.1-0.4 fluorophores per µm2 in all our „counting‟ experiments. We apologize for the confusion; the single molecule density reported in the original version of the paper was given as a very rough estimation (in the text “400-800 molecules per 30x30 µm area”). We have now provided fluorophore density values for each measurement/plot/condition in respective figure legends. As an example, we show typical density in Author response image 3 in comparison to Figure 4 of Jain et al., 2012:

Author response image 3. Example image of KIF21B-FL-GFP density used for quantification.

Author response image 3.

It can be seen that the density of single molecules is in the optimal range

DOI: http://dx.doi.org/10.7554/eLife.24746.043

</Author response image 3 title/legend>

3) New Figure 1J is remarkable because it shows that at 2 nM the MD-CC1 motor runs toward the tip of MT, but at 10 nM it switches polarity and runs toward the seed. The authors will have to explain this result, but I suspect that for 10 nM panel they show imaging of the minus MT end, not the plus. This is very disturbing because it implies that these experiments were done under conditions when discriminating between different MT ends was difficult, the directionality of motor's walking was not taken into account, and the data from different types of ends were combined to show retardation of MT polymerization rate. In Discussion section the authors write: "The dimeric version of the motor is sufficient to inhibit microtubule growth.. It is possible that KIF21B motors arriving at the microtubule tip somehow affect the conformation of terminal tubulin dimers, thereby reducing the tubulin on-rate. " If this is the model, how do the authors explain that the velocity of growth of minus end was also reduced in Kif21B presence? Or is it possible that the reported results are affected by the relative sampling of the plus and minus end kinetics and the authors failed to discriminate these effects? This situation seems unacceptable to me because it raises serious concern about the quality of of data collection and analysis.

We thank the reviewer for spotting this mistake in the preparation of our figure, which we sincerely regret: the shown kymograph indeed represented a microtubule minus end. In fact, microtubule plus and minus ends were very easy to distinguish in this experiment by the slope of kymographs in the kinesin channel. Interestingly, at 10 nM KIF21B-MD-CC1-GFP, the growth rate of microtubule plus and minus ends became very similar, while normally microtubule plus ends grow in vitro approximately twice as fast as the minus ends (see new Figure 2C, 2G and Figure 2—figure supplement 3B). This observation demonstrates once again that the effect of KIF21B-MD-CC1 is not due to some impurities in the protein, which affect the assay but rather due to a specific effect on microtubule plus end growth. To rule out that potentially incorrect plus-end assignment has introduced an error, we have completely re- analyzed our data but detected no significant differences with the previous analyses (new Figure 2G). Furthermore, we included the analysis of microtubule minus end growth rate and showed that it was not affected by 10 nM KIF21B-MD-CC1-GFP (new Figure 2—figure supplement 3B)

4) The authors state that they "..have never observed any pausing in our in vitro assays in the presence of EB3 alone, and all observed pauses could be correlated with the presence of KIF21B at the microtubule tip. However, it is true that we did observe events when microtubule polymerization appeared to slow down before the arrival of KIF21B and subsequent pausing." The distinction between "pausing" and "slowing down" is unclear to me. Multiple examples in this paper show pausing/slowing in the absence of KIF21B. See Figure 1—figure supplement 4 (Tub 15 μm with GFP middle of the first track). In Figure 2—figure supplement 1 panel A only first pause is associated with GFP. In Figure 3—figure supplement 3 polymerization pauses at 10-25 s, ie before the arrival of GFP-labeled molecule. Figure 3 panel F lower example clearly shows that MT growth is stalled in the absence of GFP signal. It could either be caused by the bleached GFP-kinesins or by a low quality of tubulin preparation. These issues have not been addressed or even mentioned. Since pausing at the MT end is the primary focus of this paper, I am very concerned about the discrepancy between author's statement and actual images.

Actually, the statement as written in the paper is correct, and there is no discrepancy between this statement and the actual images. We state that we did not observe pausing in the presence of EB3 alone. Current Figure 2—figure supplement 2 (former Figure 1—figure supplement 4) and current Figure 3—figure supplement 1C (former Figure 2—figure supplement 1) show microtubule dynamics in the absence of EB3, and we fully acknowledge that some pausing might be present in these conditions (or that pausing and growing microtubules are not easy to distinguish because of the strongly speckled tubulin signal). This is exactly the reason why mCherry-EB3 was included in all our quantitative analyses. The slow growth shown in the current Figure 3—figure supplement 2 (formerly Figure 3—figure supplement 3) can be taken as a pause because of the stretched time scale and low signal of fluorescent tubulin. We now show an enlarged version of the same plot to illustrate the slow growth events better. Furthermore, as can be seen from the kymograph, there is a clear EB3 signal at the tip, meaning that the microtubule is in the growth phase. Finally in the former Figure 3 lower part of panel F (which became panel 3C in the revised paper), there is no stalled microtubule growth in the absence of GFP signal – this panel starts with a microtubule depolymerization event.

Reviewer #3:

van Riel et al. have resubmitted their paper on the kinesin-4 KIF21B. Overall, I feel they have done a fairly solid job of responding to our concerns. The data quality has improved in many of the figure panels. The mass-spec of their contaminants and the analysis of particle brightness are particularly welcome.

It is still very puzzling that a single transient encounter of KIF21B with the microtubule end can slow down the growth rate by half. Their rebuttal just says: "this is how it is"--and they make a point about Eribulin. It was indeed a striking point about their Curr Biol paper that a single eribulin could slow down growth (and produce a secondary EB comet!). But of course it was also the case that microtubule growth resumed after the Eribulin unbinds (e.g., see Figure 4A, bottom half).

As explained above in response to the comment of reviewer 1, we propose that transient short perturbations of the growing microtubule tip caused by the arrival of KIF21B-MD-CC1- GFP molecules result in an effective reduction of the microtubule growth rate. The key point of our Eribulin paper (Doodhi et al., 2016) was that perturbing just one protofilament is enough to affect growth of the whole microtubule. We think that this concept is highly pertinent to understanding how single KIF21B motors arriving at the microtubule plus end can slow down its growth. As outlined above in response to the comments of reviewer 1, we now provide further support for this idea by showing that the EB3 signal at growing microtubule plus end is affected (becomes more variable) even at 1 nM KIF21B- MD-CC1.

I was disappointed that they did not perform their experiments at multiple tubulin concentrations. They say that "further mechanistic insights" won't come out of such experiments, but that's clearly not true. Microtubule end structure is thought to change as a function of tubulin concentration, so the motor may struggle/succeed in suppressing growth differently at different tubulin concentrations. I'm on the fence about whether to insist that they perform these experiments. At the end of the day, this paper isn't the kind that deals with biophysical precision of that type, and while we could force them to perform the experiment, it's unclear that their data/interpretation would be definitive.

Since we do not know how exactly KIF21B motor exerts its action on microtubule plus ends (structural work would be needed to determine this), and since, to our best knowledge, it is not clear how exactly microtubule plus end structure changes as a function of different tubulin concentrations, we felt that the combination of these two unknowns will not necessarily lead to a mechanistic insight. Therefore, in the short time allowed to us for the initial revision, we preferred to focus on improving other aspects of the study. However, we agree that such measurements might be useful, and we have now performed them and included them in the revised version of the manuscript (new Figure 2H, Figure 2—figure supplement 3). We found that KIF21B-MD-CC1-GFP could almost completely block microtubule growth at 7.5 μM tubulin, while control microtubules could still grow at this tubulin concentration. Furthermore, the reduction of microtubule growth rate in the presence of KIF21B-MD-CC1- GFP was observed at all other tubulin concentrations tested, from 10 to 30 μM.

We also included the data for microtubule growth with 30 μM tubulin in the presence of 0.5 nM full-length KIF21B (Figure 3G-I and Figure 4—figure supplement 1B). In this case, we did observe a significant difference with the samples containing 15 μM: fewer microtubule seeds were blocked and microtubule elongation was observed more readily, suggesting that KIF21B inhibits tubulin addition to microtubule plus end, but this inhibition can be overcome when tubulin concentration is increased. Interestingly, also in this case we observed a reduction of microtubule growth rate, in spite of the fact that KIF21B molecules were not continuously present at elongating microtubule plus ends. This can be explained by the observation that KIF21B molecules that stably attached to microtubule tips often perturbed microtubule growth beyond the point of attachment, likely because only some of the protofilaments could elongate in such situations. In this way, “action at a distance” is indeed possible, because microtubules consist of multiple protofilaments that are stabilized not only by longitudinal but also lateral interactions between tubulin dimers. Therefore, when some protofilaments are prevented from growing, other protofilaments experience hindrance even although they are not blocked (as the number of lateral contacts they can form is reduced), and as a result, a microtubule grows more slowly and undergoes catastrophe more readily, just like we previously observed with Eribulin (Doodhi et al., 2016).

Taken together, all our data are consistent with the view that KIF21B can pause protofilament elongation without causing their disassembly. This can result in an apparent pausing of the whole microtubule, but, in case when some protofilaments are blocked and others continue growing, the overall microtubule growth can become slow and irregular.

[Editors’ note: what now follows is the decision letter after the authors submitted for further consideration.]

Reviewer #2:

In this second revision by van Riel et al., the authors address major criticisms related to whether single molecules of KIF21B are indeed capable of causing microtubule plus ends to pause. There is an abundance of new content, including more intensive data analysis and experiments using kinesin-1 as a dimer control. As a result, the paper is now quite dense (I recognize that this is the outcome of the review process), and I am more convinced that low numbers (likely single molecules) of KIF21B motors are capable of stunting microtubule assembly. The authors are now much more explicit regarding models regarding how KIF21B might act; I found these text additions quite useful.

I would encourage the authors to also update their model figure to include the action of KIF21B on single protofilaments.

We have updated the model in the Figure 7J. We have depicted two options of how a single KIF21B molecule can affect microtubule growth without blocking all the protofilaments.

Overall, my disposition is that this manuscript is appropriate for eLife, but there are two issues that should be addressed. The first concerns the relationship between the dwell time of the motor on a protofilament, and the ability of the motor to induce a catastrophe. The MD-CC1 truncation does a good job of slowing microtubule growth, without dwelling appreciably anywhere on the lattice. This is quite a remarkable activity, and an indication that the motor must be doing something subtle to the microtubule lattice/protofilament end. By contrast, the last two constructs that are analyzed in the manuscript show no activity, and the authors therefore conclude that: "Taken together, these results suggest that both the regulatory rCC region and the C-terminal WD-40 containing domain can contribute to the ability of KIF21B to stay attached to the growing MT plus end and to induce pausing." These two interpretations are at odds with each other and must be reconciled.

We apologize for the confusion. The statement included above is indeed correct, and there are no discrepancies. We did not state anywhere that the two mutants described in the last part of the paper, FL-ΔrCC and MD-CC ΔrCC, show no activity at all. We just stated that they do not affect microtubule depolymerization and are much less potent at inducing pausing than the full length molecule. Importantly, these mutants can also induce some catastrophes and some pausing (Figure 7G). Moreover, both mutants reduce microtubule growth rate, similar to the full length KIF21B and MD-CC1 mutant. These data are now included in the new Figure 7F.

Second, the authors suggest that "It is possible that at growing MT plus ends the number of binding sites for which the C-terminus of KIF21B would have preference or its affinity for these sites would be affected by protofilament curvature." In Figure 4—figure supplement 1, the authors show clear examples of microtubule bending prior to a KIF21B-induced catastrophe, but KIF21B is not bound to these deformed plus ends. The statement in the Discussion is thus countered by their own data. I would suggest that the authors are more explicit regarding their ideas or remove the sentence from the Discussion.

We again apologize for the confusion here. We do not propose that the curling of the microtubules before catastrophe is caused by the kinesin present at the outmost microtubule tip. We propose that microtubule bending occurs because the kinesin blocks some of the protofilaments, while the remaining ones can elongate for some time and, since the microtubule is incomplete, it would be more flexible and more prone to catastrophe. This possibility is now depicted in Figure 7J.

In the sentence cited above, we refer to a different kind of curvature – the very mild outward protofilament bending that is generally believed to be found at the outmost microtubule tips and which was suggested to contribute to the preference some proteins, such as doublecortin, have for the microtubule plus ends.

Associated Data

    This section collects any data citations, data availability statements, or supplementary materials included in this article.

    Supplementary Materials

    Figure 1—source data 1. An excel sheet with numerical data on the quantification of kinesin velocities and MT growth rate in COS-7 cells represented as plots in Figure 1B,C,E,I.

    DOI: http://dx.doi.org/10.7554/eLife.24746.004

    DOI: 10.7554/eLife.24746.004
    Figure 2—source data 1. An excel sheet with numerical data on the quantification of KIF21B-MD-CC1-GFP dimer analysis, photobleaching-step analysis, velocities, run length, effects on MT growth rate and distribution of EB3 fluorescence intensity represented as plots in Figures 2A,B,D,E–H,J.

    DOI: http://dx.doi.org/10.7554/eLife.24746.007

    elife-24746-fig2-data1.xlsx (337.4KB, xlsx)
    DOI: 10.7554/eLife.24746.007
    Figure 2—Figure Supplement 3—Source Data 1. An excel sheet with numerical data on the quantification of the MT minus end growth rates represented as plot in Figure 2—figure supplement 3B.

    DOI: http://dx.doi.org/10.7554/eLife.24746.011

    DOI: 10.7554/eLife.24746.011
    Figure 3—source data 1. An excel sheet with numerical data on the quantification of KIF21B-FL seed blocking activity, pause induction, effects on MT growth rate and catastrophe frequency and outcomes of KIF21B-FL-GFP arrival at MT plus ends represented as plots in Figure 3B,C,E,H,I.

    DOI: http://dx.doi.org/10.7554/eLife.24746.013

    DOI: 10.7554/eLife.24746.013
    Figure 3—figure supplements 1—source data 1. An excel sheet with numerical data on the quantification of the KIF21B-FL dimer and photobleaching step analysis represented as plots in Figure 3—figure supplement 1A,B.

    DOI: http://dx.doi.org/10.7554/eLife.24746.015

    elife-24746-fig2.xlsx (363.7KB, xlsx)
    DOI: 10.7554/eLife.24746.015
    Figure 3—Figure Supplement 2—Source Data 1. An excel sheet with numerical data on the quantification of tracked positions of the kinesins and the MT tip together with the fluorescence intensities of the kinesins over time represented as plot in Figure 3—figure supplement 2.

    DOI: http://dx.doi.org/10.7554/eLife.24746.017

    DOI: 10.7554/eLife.24746.017
    Figure 4—source data 1. An excel sheet with numerical data on the quantification of tracking of kinesins and MT tips over time represented as plots in Figure 4A,B.

    DOI: http://dx.doi.org/10.7554/eLife.24746.020

    DOI: 10.7554/eLife.24746.020
    Figure 5—source data 1. An excel sheet with numerical data on the quantification of KIF21B-FL intensity during MT pausing events, KIF5B-560 dimer analysis and comparison of fluorescence intensities of KIF5B-560 with KIF21B-FL represented as plots in Figure 5A,C,D–I.

    DOI: http://dx.doi.org/10.7554/eLife.24746.024

    elife-24746-fig5-data1.xlsx (486.4KB, xlsx)
    DOI: 10.7554/eLife.24746.024
    Figure 5—figure Supplement 2—Source data 1. An excel sheet with numerical data on the quantification of photobleaching traces of KIF21B-FL-GFP represented as plots in Figure 5—figure supplement 2.

    DOI: http://dx.doi.org/10.7554/eLife.24746.025

    elife-24746-fig6.xlsx (40.9KB, xlsx)
    DOI: 10.7554/eLife.24746.025
    Figure 5—figure supplements 1—Source data 1. An excel sheet with numerical data on the quantification of KIF21B-FL fluorescence intensities represented as plots in Figure 5—figure supplement 1.

    DOI: http://dx.doi.org/10.7554/eLife.24746.027

    elife-24746-fig4.xlsx (368.9KB, xlsx)
    DOI: 10.7554/eLife.24746.027
    Figure 6—figure supplement 4—source data 1. An excel sheet with numerical data on the quantification of far-UV CD spectra (inset) and thermal unfolding profile of recombinant KIF21B rCC1 represented as plots in Figure 6—figure supplement 4A.

    DOI: http://dx.doi.org/10.7554/eLife.24746.030

    elife-24746-fig7.xlsx (12.3KB, xlsx)
    DOI: 10.7554/eLife.24746.030
    Figure 7—source data 1. An excel sheet with numerical data on the quantification of KIF21B mutants dimer analysis, photobleaching step analysis, velocities on seeds and MT lattices, MT growth rate in vitro and outcomes of the arrival of KIF21B mutants at MT plus ends, represented as plots in Figure 7A,C,F–I.

    DOI: http://dx.doi.org/10.7554/eLife.24746.036

    DOI: 10.7554/eLife.24746.036
    Figure 7—figure supplements 1—source data 1. An excel sheet with numerical data on the quantification of the intensity of KIF21B-L-WD40 on seeds and dynamic MTs represented as plot in Figure 7—figure supplement 1B.

    DOI: http://dx.doi.org/10.7554/eLife.24746.038

    elife-24746-fig5.xlsx (10KB, xlsx)
    DOI: 10.7554/eLife.24746.038
    Supplementary file 1. Analysis of purified KIF21B and its deletion mutants used in this study by mass spectrometry.

    Samples of purified KIF21B proteins were loaded on SDS-PAGE, isolated from the gel after in-gel digestion and subsequently analyzed by mass spectrometry to test for purity. All identified proteins are included in Supplementary file 1in alphabetical order. Indicated are the molecular weight and the number of unique peptides found for identified proteins in the different KIF21B samples. In total, 121 proteins were identified for KIF21B-FL-GFP, 183 for KIF21B-FL-ΔrCC-GFP, 107 for KIF21B-MD-CCΔrCC-GFP, 92 for GFP-L-WD40 and 63 for KIF21B-MD-CC1-GFP.

    DOI: http://dx.doi.org/10.7554/eLife.24746.039

    elife-24746-supp1.docx (41.8KB, docx)
    DOI: 10.7554/eLife.24746.039
    Supplementary file 2. Lognormal (best fit) values for the fluorescence intensity measurements.

    DOI: http://dx.doi.org/10.7554/eLife.24746.040

    elife-24746-supp2.docx (18.5KB, docx)
    DOI: 10.7554/eLife.24746.040

    Articles from eLife are provided here courtesy of eLife Sciences Publications, Ltd

    RESOURCES