

Abstract
While many aspects of blood production are now well understood, the spatial organization of myeloid differentiation in the bone marrow (BM) remains unknown. Here, we use imaging to track granulocyte/macrophage progenitor (GMP) behavior during emergency and leukemic myelopoiesis. At steady state, we find individual GMPs scattered throughout the BM. During regeneration, we observe expanding GMP patches forming defined GMP clusters, which, in turn, locally differentiate into granulocytes. We describe how the timed release of important BM niche signals (SCF, IL-1β, G-CSF, TGF-β, CXCL4) and activation of an inducible Irf8/β-catenin progenitor self-renewal network controls the transient formation of regenerating GMP clusters. In leukemia, we show that GMP clusters are constantly produced due to persistent activation of the self-renewal network and lack of termination cytokines that normally restore stem cell quiescence. Our results uncover a previously unrecognized dynamic behavior of GMPs in situ, which tunes emergency myelopoiesis and is hijacked in leukemia.
Our understanding of blood production has evolved considerably over the past years, mainly due to the introduction of new technologies to study hematopoietic stem cell (HSC) biology both in situ in their BM niche and at the clonal level. Recent tracking approaches in native conditions, as opposed to transplantation experiments, have uncovered a prominent role for multipotent progenitors (MPP) in maintaining blood production1,2. Detailed functional studies of the MPP compartment have identified three distinct MPP subsets (MPP2, MPP3, MPP4) with unique lineage preferences that work together to adjust blood production to the need of the organism3,4. In particular, increased production of myeloid-biased MPP2/3 by HSCs and myeloid reprogramming of lymphoid-biased MPP4 are now emerging as key first steps of regenerative myelopoiesis4.
Myelopoiesis has long been considered to progress with the orderly differentiation of MPPs into uncommitted common myeloid progenitors (CMP), which then produce lineage-committed granulocyte/macrophage progenitors (GMP) and megakaryocyte/erythrocyte progenitors (MEP)5. Of note, single-cell RNA-Seq approaches6,7 and more refined barcoding lineage tracking experiments8 indicate pre-existing lineage specifications in CMPs, and a large degree of molecular and functional heterogeneity in all myeloid progenitors (MP). However, our knowledge of MP biology still lacks a precise understanding of how myeloid differentiation occurs spatially in the BM cavity. Here, we used imaging approaches, to provide new insights into the mechanisms by which the BM niche microenvironment controls myelopoiesis.
Imaging GMPs in situ
We took advantage of the phenotypic characteristics of GMPs (Lin−/c-Kit+/Sca-1−/FcγR+/CD34+)5 to design an immunofluorescence (IF) staining scheme allowing their specific recognition on isolated populations and bone sections (Extended Data Fig. 1a). In wild type (WT) mice, GMPs were scattered throughout the BM cavity with no particular distribution in relation to the bone endosteum, trabecular regions or central marrow, and were usually identified as individual cells intermingled with other hematopoietic populations (Fig. 1a). In contrast, in myeloproliferative neoplasm (MPN) models such as Scl-tTA::TRE-BCR/ABL (BA)9 and junBflox/flox::MORE-Cre (jB)10 mice, most GMPs were found as part of large, compact clusters surrounded by lineage positive cells (Fig. 1b, Extended Data Fig. 1b, c). This process was progressive and directly associated with disease development, starting with loose GMP patches (pGMP) that evolved into large, compact GMP clusters (cGMP) (Extended Data Fig. 1d). We defined pGMPs as the collection of ≥ 4–6 GMPs loosely associated together, which could also be occasionally observed at steady state in WT mice, and distinguished them from cGMPs by the fact that they were not tightly surrounded by mature lineage cells (Extended Data Fig. 1e). While GMPs were never found in WT spleens, we observed abundant cGMPs in the disorganized red pulp of BA and jB mice (Extended Data Fig. 2a). Similar features were observed in the MLL-AF9 (MF9) transplanted model of acute myeloid leukemia (AML)11, with structures ranging from loose pGMPs to large, compact cGMPs (Extended Data Fig. 2b). Using a simplified version of this IF scheme, we investigated whether cGMP formation was associated with a major re-organization of the BM microenvironment, but found no obvious changes in blood vessel network, hypoxia level, or deposition of extracellular matrix (ECM) components, except for collagen IV as expected for the fibrotic BA BM niche12 (Extended Data Fig. 2c). We also localized mature populations in relation to cGMPs, and while some lymphoid cells were detected inside and at the periphery of cGMPs, myeloid cells were only found tightly surrounding cGMPs (Extended Data Fig. 2d). These results indicate that leukemic myelopoiesis is characterized by the presence of cGMPs, which are part of a continuum of differentiation separating progenitors from mature myeloid cells.
Figure 1. GMP clusters in leukemic and regenerative myelopoiesis.
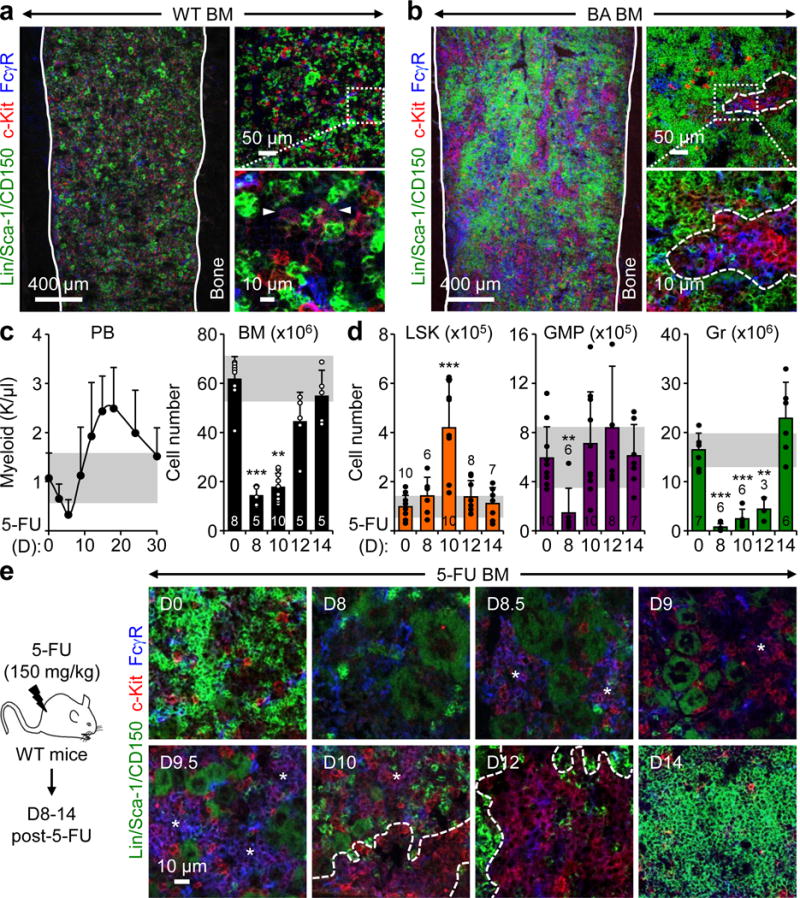
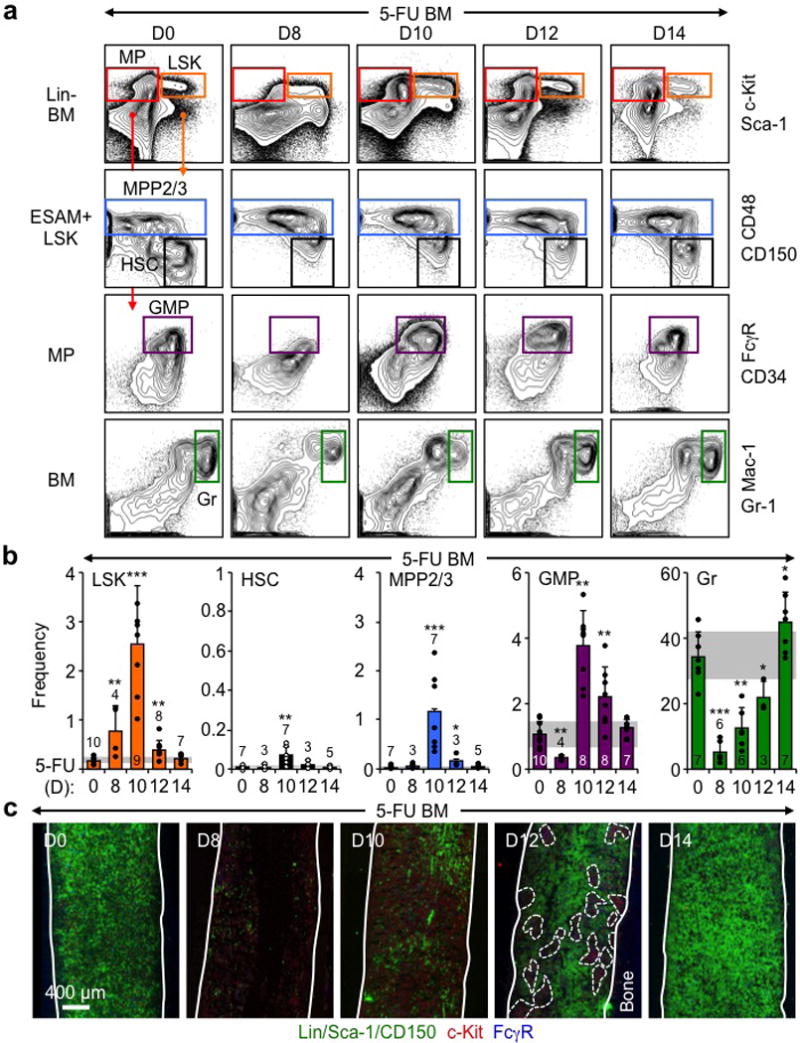
a, b, Representative IF staining showing GMPs (purple) in the BM of (a) wild type (WT), and (b) diseased Scl-tTA:TRE-BCR/ABL (BA) mice. Solid lines indicate bone surface, dotted lines cGMPs and arrowheads individual GMPs. c, PB (n = 5) and BM regeneration in 5-FU-treated WT mice. d, Changes in hematopoietic populations at the indicated days post 5-FU treatment. e, Representative IF staining showing GMPs (purple) in the BM of 5-FU -treated mice. Stars indicate pGMPs and dotted lines cGMPs. Results are expressed as mean ± S.D. (grey bars, reference range); **p < 0.01, ***p < 0.001.
cGMPs are features of myeloid expansion
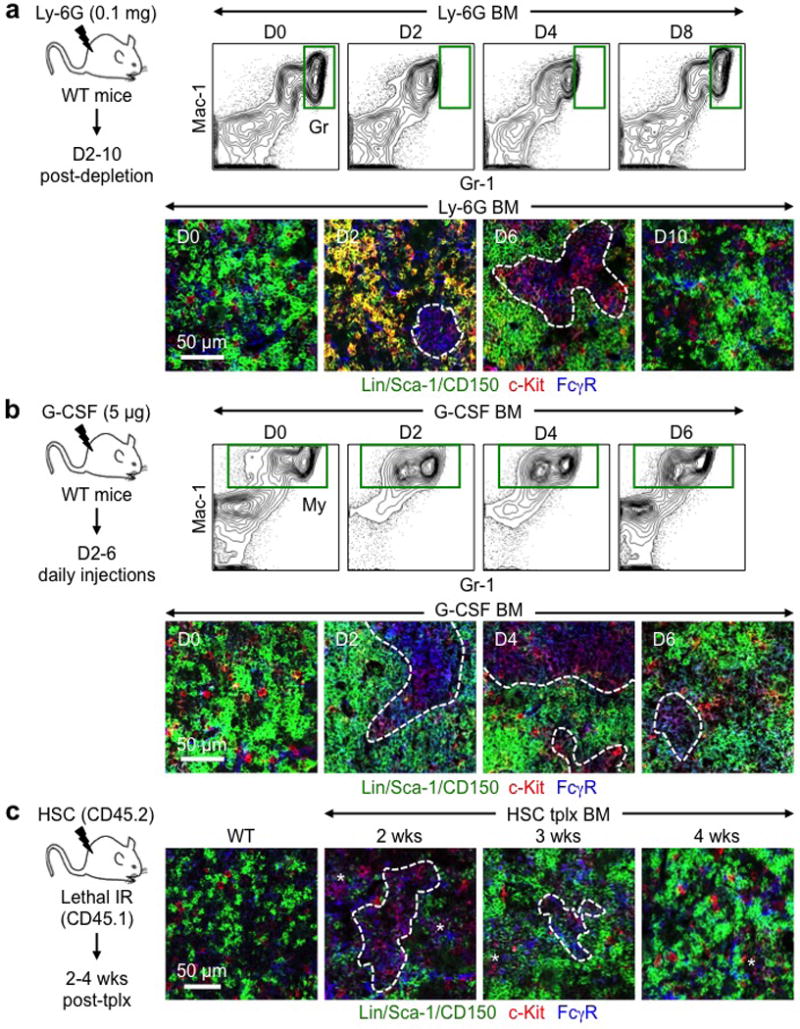
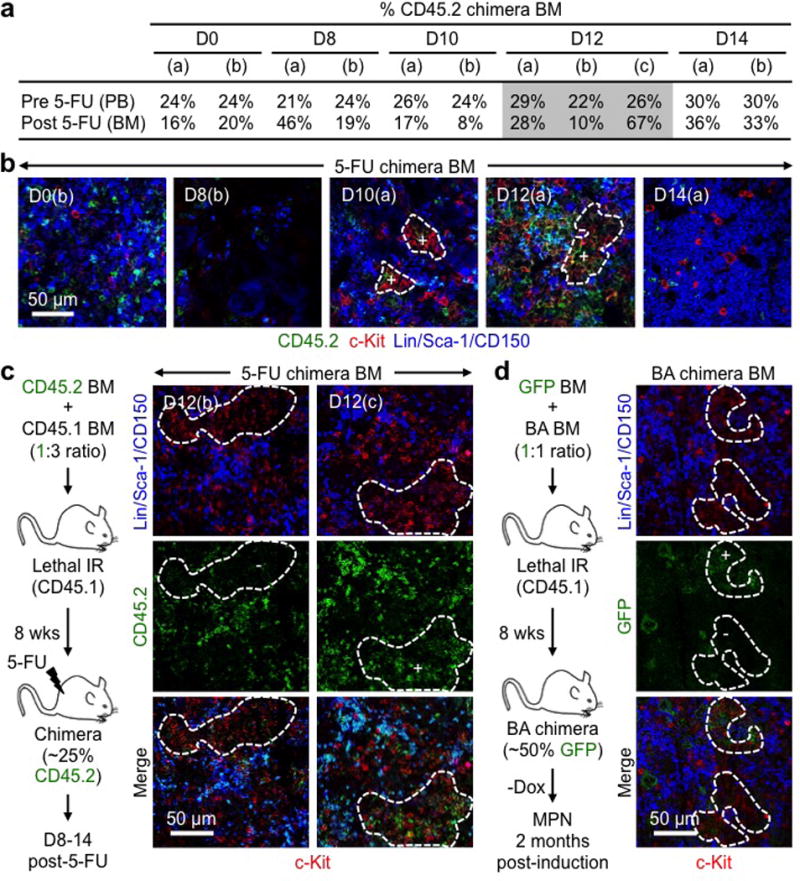
To determine whether cGMPs could be detected during emergency myelopoiesis, we used several models of myeloid regeneration or active myeloid cell production. First, WT mice were injected once with 5-fluorouracil (5-FU; 150 mg/kg) and followed for myeloid regeneration over time (Fig. 1c). Flow cytometry analyses showed increased numbers of immature Lin−/c-Kit+/Sca-1+ (LSK) cells by d10, which essentially reflected increased production of myeloid-biased MPP2/3 by 5-FU-activated HSCs (Fig. 1d, Extended Data Fig. 3a, b). In contrast, GMP numbers were reduced by d8 and reverted to steady state levels by d10, while granulocyte (Gr) numbers sharply decreased by d8, and then slowly recovered to exceed steady state levels by d14. Strikingly, IF staining of 5-FU BM showed rare GMPs at d8, followed by the appearance of pGMPs by d8.5, which quickly expanded in size up to d10 when the first cGMPs where observed (Fig. 1e, Extended Data Fig. 3c). By d12, we only found cGMPs, particularly along the bone endosteum, which then had completely disappeared by d14 upon Gr restoration. We observed similar transient cGMP formation in WT mice injected once with Ly-6G antibody (0.1 mg/mouse) to specifically ablate Grs13, or daily with G-CSF (5 μg/mouse) to increase Gr production14 (Extended Data Fig. 4a, b). We also confirmed transient cGMP formation during the peak of myeloid regeneration following HSC transplantation, when both myeloid-biased MPP2/3 and GMPs were specifically expanded4 (Extended Data Fig. 4c). Moreover, we demonstrated that cGMPs were predominantly clonal and composed of GMPs derived from individual HSCs-MPP2/3 undergoing regenerative or leukemic myelopoiesis (Supplemental Information, Extended Data Fig. 5, a–d). Collectively, these results indicate that transient cGMP formation is a hallmark characteristic of emergency myelopoiesis.
cGMPs are foci of myeloid differentiation
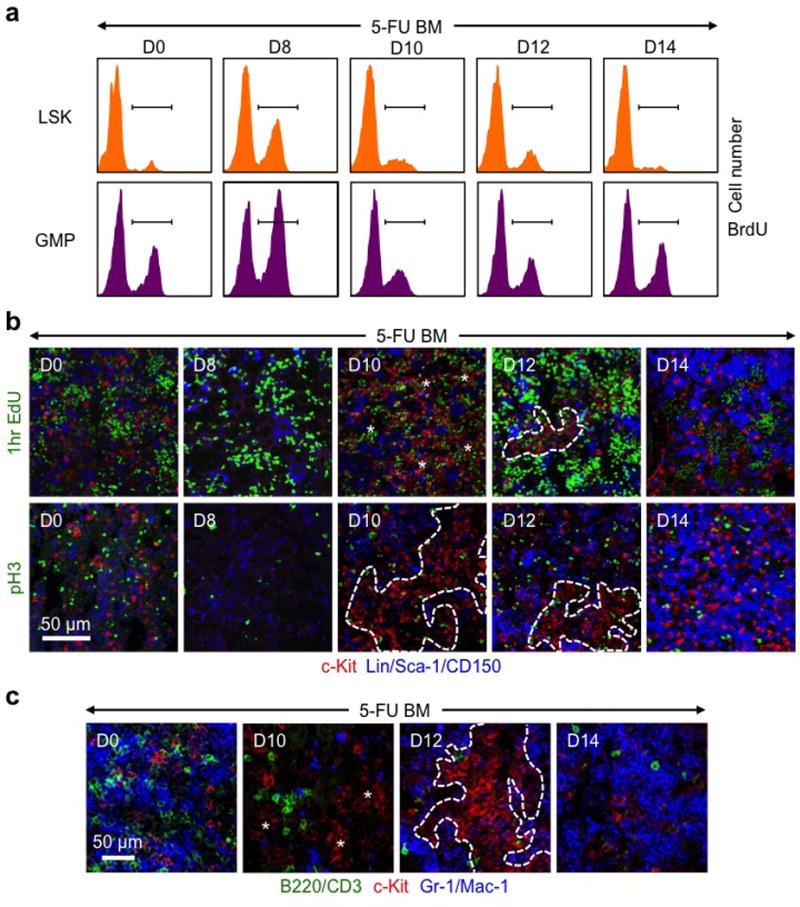
To understand the mechanisms of cGMP formation, we conducted detailed cell cycle analyses by injecting BrdU or EdU into 5-FU-treated WT mice (Fig. 2a, Extended Data Fig. 6a, b). In LSKs, BrdU incorporation peaked at d8 and then progressively reverted to steady state levels by d12. In GMPs, BrdU incorporation first increased at d8, at the onset of pGMP formation, and then dropped below steady state levels between d10–12 when pGMPs turned into cGMPs, before reverting to steady state levels by d14 when cGMPs had disappeared. This pattern was reflected in IF staining, with proliferating EdU+ pGMPs observed at d10, and cGMPs markedly devoid of proliferating EdU+ cells compared to their surroundings at d12. In contrast, the number of dividing phospho-histone H3 (pH3) positive MPs was not significantly different between cGMPs and their surroundings at d10–12, although they appeared preferentially located along the edges of the clusters. Similar analyses performed in BA mice did not uncover altered GMP proliferation rates, and emphasized the preferential distribution of pH3+ dividing cells along the edges of the clusters (Fig. 2b, c). Close examination of cGMP periphery in BA mice highlighted a clear differentiation gradient, with reciprocal expression patterns for FcγR and lineage markers in GMPs undergoing differentiation across the cluster boundary defined by c-Kit expression (Fig. 2d). Single cell clonogenic methylcellulose analyses of GMPs isolated from 5-FU-treated WT mice confirmed a change in differentiation potential associated with cGMP formation, with increased plating efficiency and immature GM colonies at d8–10, followed by restoration of low GM frequency and a significant loss of M colonies at d12–14 (Fig. 2e). Finally, we confirmed that mature myeloid cells also directly surrounded cGMPs in 5-FU-treated mice (Extended Data Fig. 6c). Collectively, these results uncover complex changes in the cellular behavior of GMPs associated with cluster formation, with increased proliferation and immaturity in expanding pGMPs that form the cGMPs, followed by a sharp block in proliferation and restoration of differentiation potential in differentiating cGMPs that divide to produce mature Grs. Moreover, these features of cGMPs as foci of differentiation appear conserved during leukemic myelopoiesis.
Figure 2. GMP clusters are foci of differentiation.
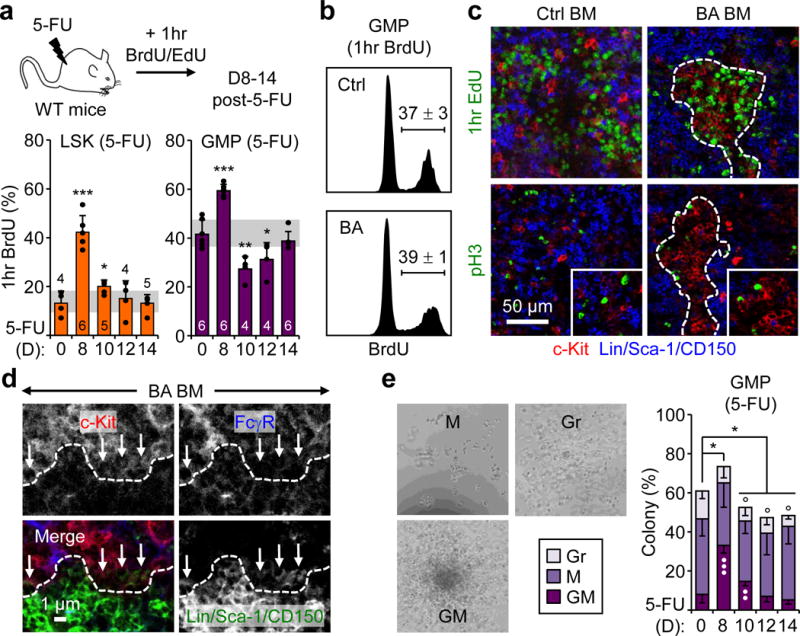
a, Proliferation in 5-FU-treated WT mice showing experimental scheme and BrdU incorporation in LSKs and GMPs. b, BrdU incorporation in GMPs from Ctrl and BA mice (n = 3). c, Representative IF staining showing MPs (red) in relation to proliferating EdU+ (green, upper row) and dividing pH3+ (green, lower row) cells in Ctrl and BA BM. d, Representative IF staining of GMP cluster periphery (dotted lines) highlighting differentiating GMPs (arrows) as they lose FcγR expression and gain lineage marker expression. e, Single-cell clonogenic methylcellulose analyses of GMPs isolated from 5-FU-treated WT mice (n = 4; *, vs. plating efficiency; •, vs. GM colonies; °, vs. M colonies). Results are percent colony type and pictures show representative colonies. GM: granulocyte/macrophage, Gr: granulocyte, and M: macrophage, colonies. Stars indicate pGMPs and dotted lines cGMPs. Results are expressed as mean ± S.D. (grey bars, reference range); *p ≤ 0.05, **p ≤ 0.01, ***p ≤ 0.001.
Molecular reprograming in cGMPs
To gain insights into the molecular mechanism controlling cGMP formation, we investigated pools of 100 GMPs isolated from 5-FU-treated WT mice using custom-made Fluidigm qRT-PCR arrays (Supplementary Table 1). Principal component (PC) and t-distributed stochastic neighbor embedding (tSNE) analyses of the 59 most robustly expressed genes revealed two distinct groups, with d8 and most d10 samples (group I) clearly separated from d0 and d12–14 samples (group II) (Fig. 3a). Examination of individual genes highlighted signatures of activated cell cycle and strong molecular immaturity in expanding pGMPs (group I), which were completely reverted in differentiating cGMPs (group II) (Fig. 3b, Extended Data Fig. 7a–c). Similar investigations on leukemic GMPs revealed a molecular signature of expanding pGMPs in both BA and jB GMPs, with increased Ccne1 expression and decreased levels of Irf8, Csf1r (MCSF-R) and Il6ra (Fig. 3c, Extended Data Fig. 7d, Supplementary Table 2). To investigate global transcriptional changes, we also performed single cell RNA-Seq on GMPs isolated from both 5-FU-treated WT mice, and BA and age-matched control mice. PC analysis and hierarchical clustering of all single GMPs similarly displayed two major clusters (Fig. 3d, Extended Data Fig. 7e, Supplementary Table 3, 4). Remarkably, d0 and control GMPs showed high expression of the previously defined group II genes and reflected steady state GMPs (ssGMPs), whereas d8 and BA GMPs were characterized by expression of group II genes and coincided with self-renewing GMPs (srGMPs). Allocation to each cluster of all single GMPs across the 5-FU kinetics and in BA mice showed the presence of 8.5 to 13.5% srGMPs at steady state, and persistence of ~ 15% ssGMPs at d8 and the peak of self-renewing GMP patches (Fig. 3e). Together, these results uncover significant molecular reprogramming during cGMP formation, characterized by cell cycle activation and suppression of maturation pathways in expanding pGMPs, followed by cell cycle blockade and re-activation of maturation pathways in differentiating cGMPs. They also indicate that leukemic GMPs are molecularly primed for cGMP formation. Moreover, they demonstrate the co-existence of distinct steady state and self-renewing GMPs in both normal and leukemic contexts, in proportions that reflect the activation state of emergency myelopoiesis.
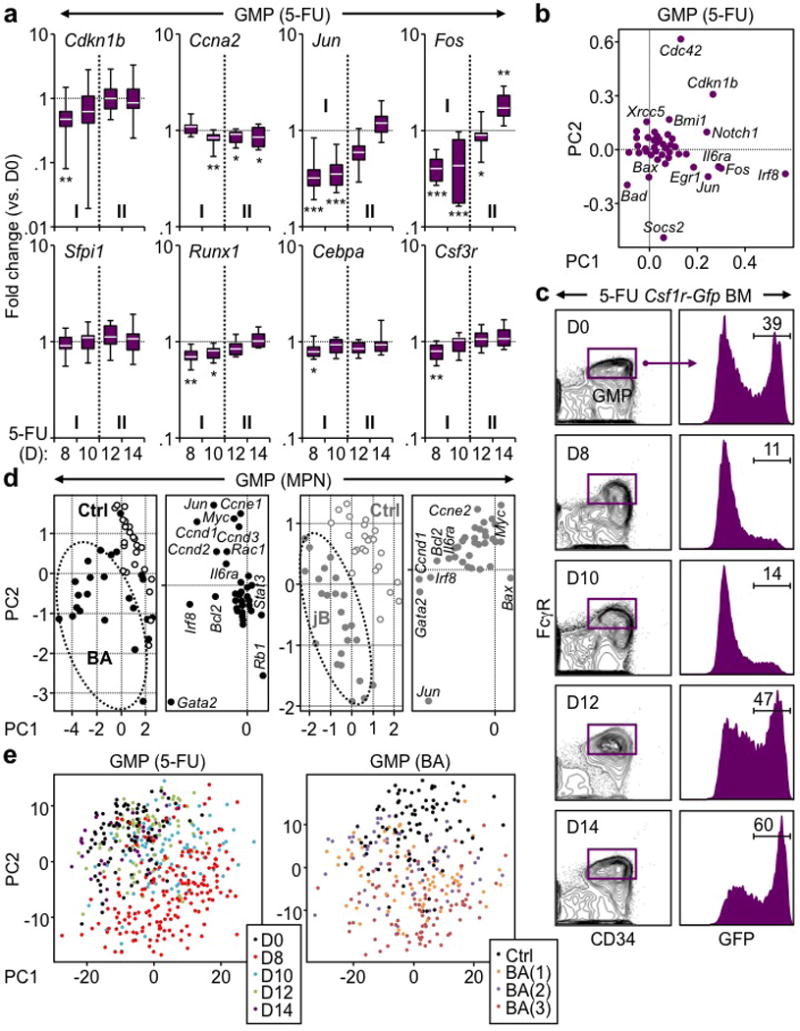
Figure 3. Molecular mechanisms of GMP cluster formation.
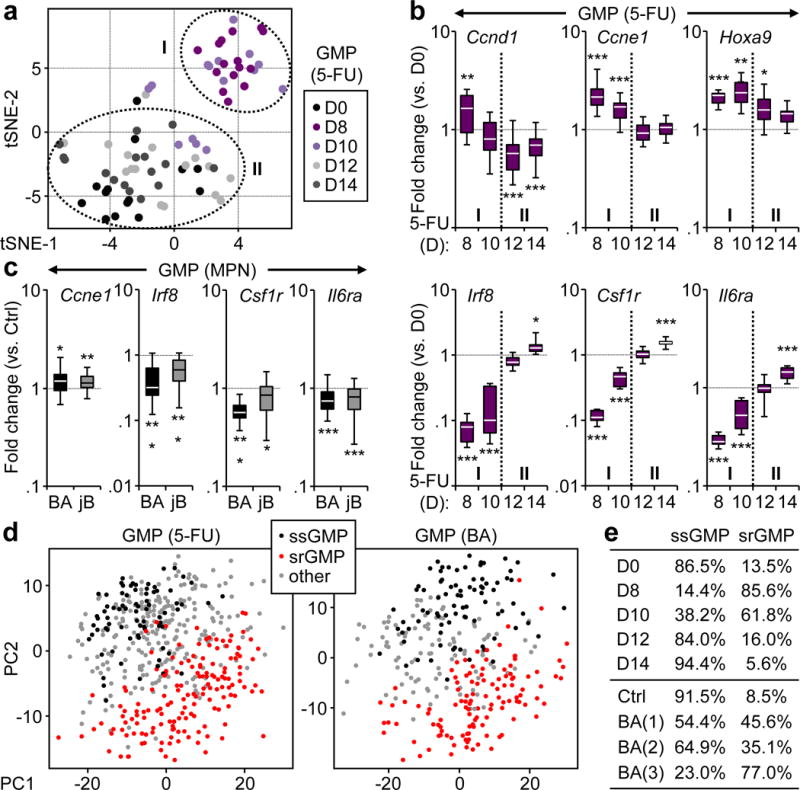
a, tSNE analyses of Fluidigm gene expression data from GMPs isolated from 5-FU-treated WT mice (n = 2; 10–16 pools of 100 cells/condition). b, Selected genes from Fluidigm analyses shown in (a). Results are expressed as fold change compared to levels in d0 GMPs and presented as boxplots (line: median; box: 25th and 75th percentiles; whisker: 90th and 10th percentiles). c, Selected genes from Fluidigm analyses of GMPs isolated from BA, jB and respective age-matched Ctrl mice (n = 4; 22–28 pools of 100 cells/condition). Results are expressed as fold change compared to levels in respective Ctrl GMPs and presented as in (b). d, PC analyses of single cell RNA-Seq data from GMPs isolated from 5-FU-treated WT mice (476 single cells) and BA mice (306 single cells). e, frequency of steady state GMP (ssGMP) and self-renewing GMPs (srGMP) in 5-FU-treated WT mice, and Ctrl and BA mice. *p ≤ 0.05; **p ≤ 0.01, ***p ≤ 0.001.
GMP self-renewal network
We next probed the function of the key myeloid transcription factor Irf8[15] in cGMP formation. Irf8−/− mice are immunodeficient and develop MPN over time16. Similar to BA and jB mice, we observed constitutive cGMP formation in the BM of primary or transplanted Irf8−/− mice (Fig. 4a, Extended Data Fig. 8a–c), thus demonstrating that decreasing Irf8 expression is sufficient to drive cGMP formation. We also found delayed cGMP formation in 5-FU-treated primary and transplanted Irf8−/− mice, which, in turn, indicates that restoration of Irf8 expression is essential for cGMP differentiation, likely by increasing expression of genes like Csf1r, a direct Irf8 target17. Interestingly, Irf8 and Ctnnb1 (β-catenin) are part of an antagonistic regulatory network in chronic myelogenous leukemia (CML)18, and activated β-catenin signaling provides aberrant self-renewal features to leukemic GMPs in both CML and AML19,20. Strikingly, we observed increased nuclear β-catenin in d8 regenerating GMPs, and in both BA and jB GMPs (Fig. 4b, c). However, downregulation of Irf8 did not directly drive β-catenin as neither Irf8−/− GMPs nor HSCs or MPPs showed increased nuclear β-catenin (Fig. 4d, Extended Data Fig. 8d). In contrast, GMPs from Ctnnb1 gain-of-function (GOF) and loss-of-function (LOF) mice had decreased and increased Irf8 expression, respectively, leading to the presence of pGMPs at steady state in Ctnnb1 GOF mice, and unchanged steady state levels but significantly delayed cGMP formation upon 5-FU treatment in Ctnnb1 LOF mice (Fig. 4e–g, Extended Data Fig 8e, f). Collectively, these results place Irf8 and β-catenin at the center of an inducible self-renewal progenitor network controlling cGMP formation, with β-catenin directly suppressing Irf8 expression and Irf8 eventually re-enforcing β-catenin expression in MPN contexts (Fig. 4h).
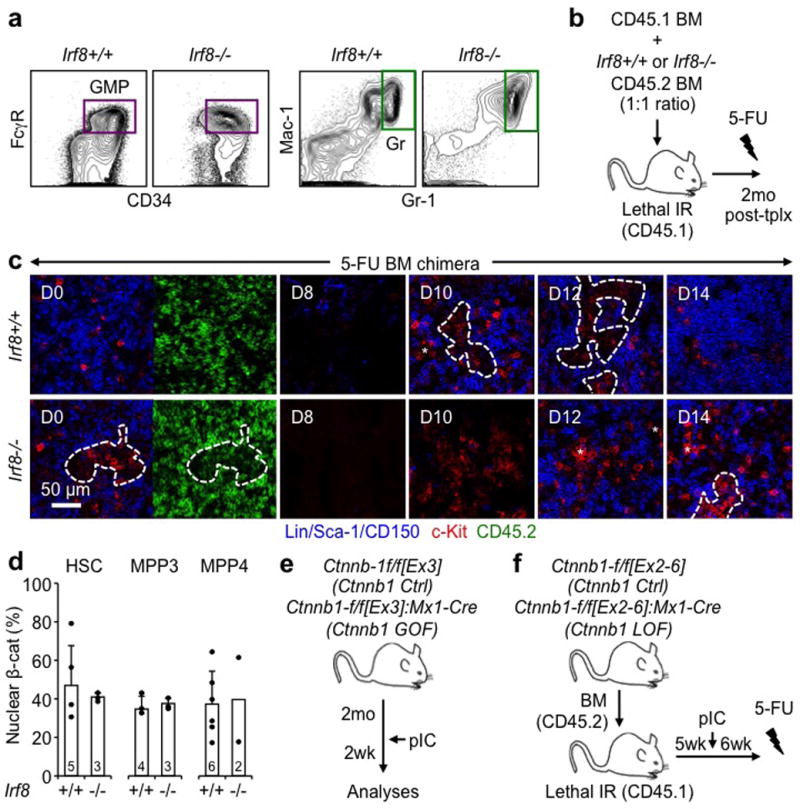
Figure 4. Irf8/β-catenin self-renewal progenitor network.
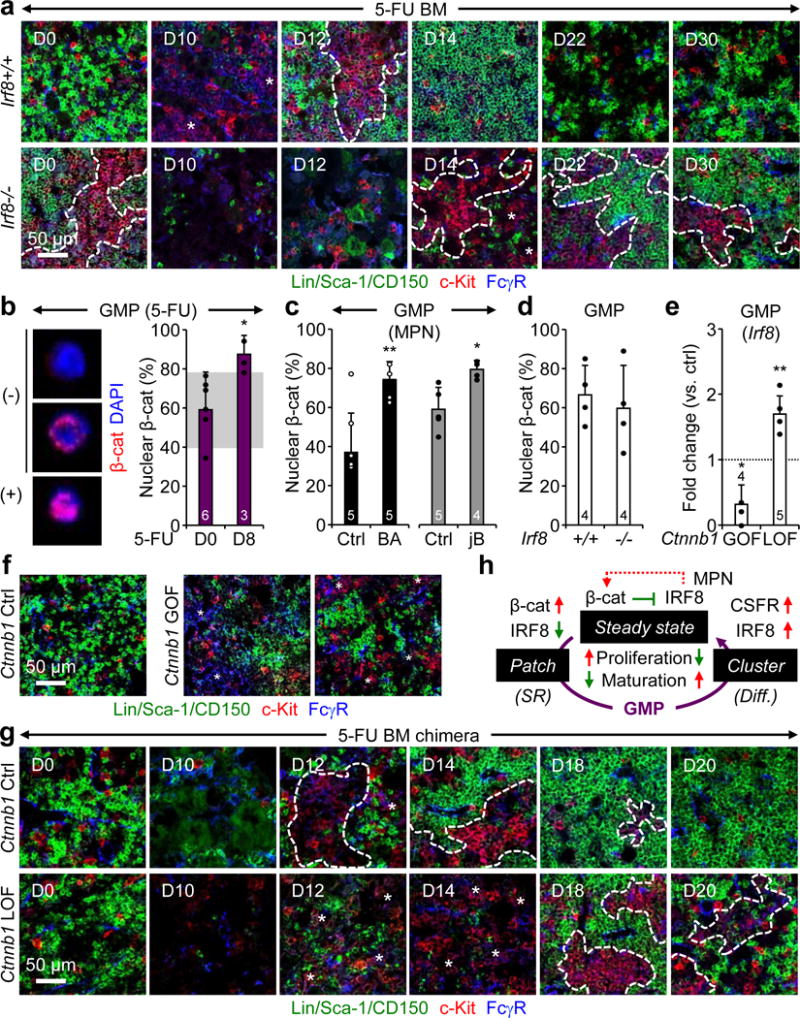
a, Representative IF staining of GMPs (purple) in 5-FU-treated Irf8+/+ and Irf8−/− BM. b–d, Nuclear β-catenin in (b) GMPs from d8 5-FU-treated WT mice with representative negative (−) and positive (+) staining shown for d0 GMPs, (c) GMPs from BA, jB and respective age-matched Ctrl mice, and (d) GMPs from Irf8+/+ and Irf8−/− mice. Results are expressed as percent positive cells. e, Irf8 expression in GMPs from Ctnnb1 gain-of-function (GOF) and loss-of-function (LOF) mice. f, Representative IF staining of GMPs (purple) in Ctnnb1 Ctrl and GOF BM. g, Representative IF staining of GMPs (purple) in 5-FU-treated Ctnnb1 Ctrl and LOF BM. h, Model of the molecular network controlling pGMP self-renewal (SR) and cGMP differentiation (diff.). Red indicates activation and green suppression, with dotted line highlighting re-enforcing pathways in MPNs. Stars indicate pGMPs and dotted lines cGMPs. Results are expressed as mean ± S.D. (grey bars, reference range); *p ≤ 0.05; **p ≤ 0.01, ***p ≤ 0.001.
BM niche signals control cGMP formation
To identify the environmental factors involved in cGMP formation, we performed ELISA analyses on BM fluid from 5-FU treated WT mice (Fig. 5a). Interestingly, we found significantly elevated levels of cytokines known to stimulate HSC proliferation and trigger myeloid differentiation, like SCF and G-CSF, prior to pGMP expansion (d5–8), and factors important for restoring HSC quiescence, like TGF-β1 and CXCL4 (PF4), at the time of cGMP formation (d10–12)21. In contrast, we observed no change in the BM homing chemokine CXCL12 (SDF1α) and a decrease, rather than the reported increase22, in FGF1 production (Extended Data Fig. 9a). G-CSF and IL-1 are both produced by damaging the vasculature in stress conditions23,24. IF staining confirmed significant vascular damage following 5-FU treatment, with major gaps between dysmorphic laminin+ ECs leading to vascular leakage into the stromal microenvironment, especially at d8–10 when pGMPs expand (Fig. 5b, Extended Data Fig. 9b). To directly probe the role of G-CSF, we injected it for 4 consecutive days in 5-FU-treated WT mice either from d1–4 (early injections) prior to pGMP expansion, or from d8–11 (late injections) during the cGMP differentiation period (Fig. 5c, Extended Data Fig. 9c). Strikingly, early G-CSF injections significantly accelerated cGMP formation, while late G-CSF injections significantly amplified and extended the period of cGMP formation. In addition, we recently reported impaired myeloid regeneration in 5-FU-treated Il1r1−/− mice, and showed that IL-1 triggers regenerative myelopoiesis by activating PU.1 in HSCs23. Consistently, we observed significantly delayed cGMP formation in 5-FU-treated Il1r1−/− mice, and constitutive cGMP formation at steady state in IL-1-treated WT mice (Fig. 5d, Extended Data Fig. 9d).
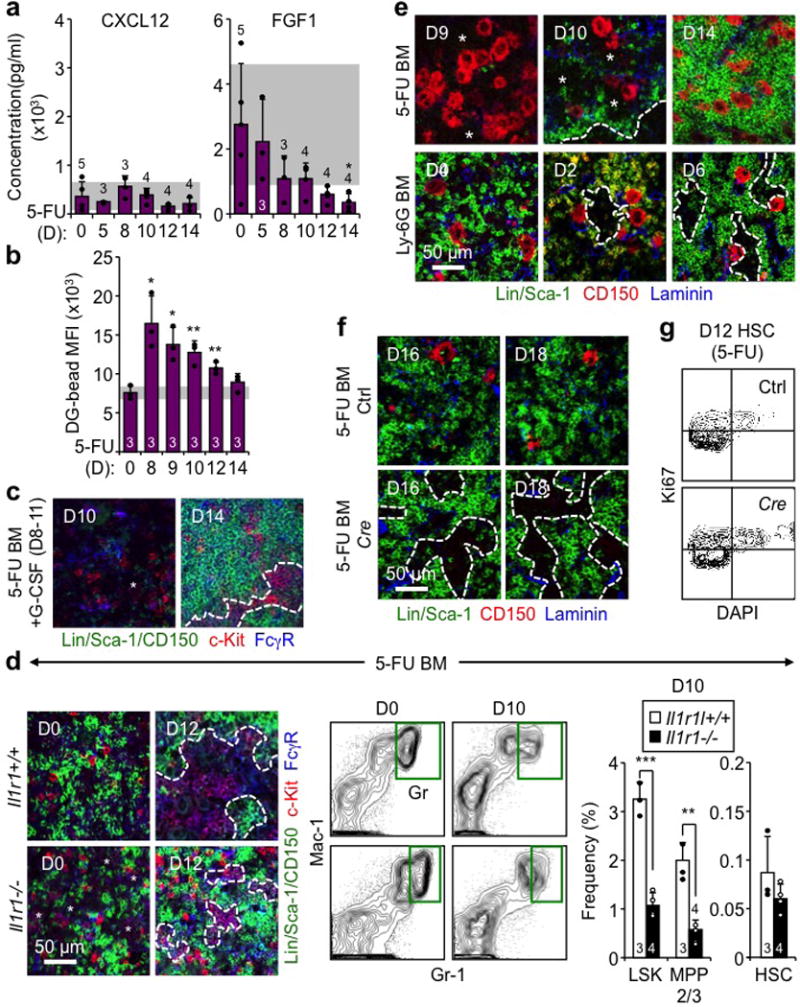
Figure 5. BM niche controls of GMP cluster formation during regenerative myelopoiesis.
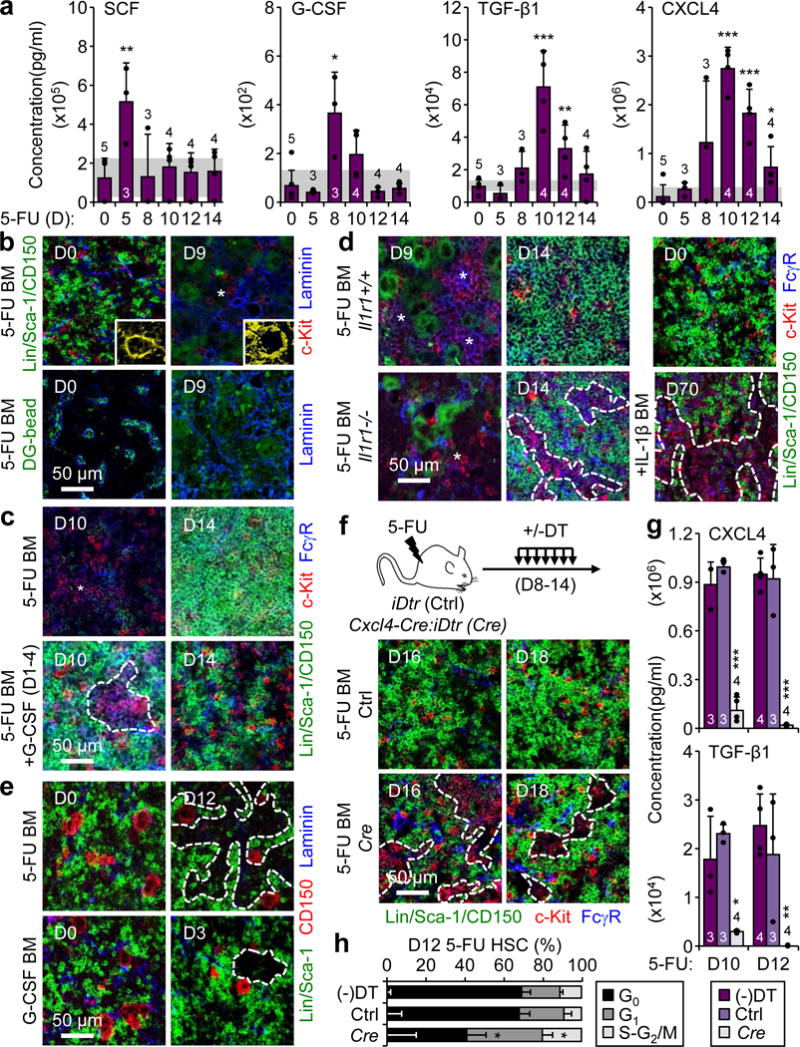
a, ELISA cytokine measurements in BM fluids of 5-FU-treated WT mice. b, Representative IF staining showing vasculature (blue, pseudo-colored in yellow in magnified inserts) and vascular leakage (green, dragon green (DG) microsphere diffusion assay) in 5-FU-treated BM. c, Representative IF staining showing GMPs (purple) in 5-FU-treated BM, with or without concomitant daily injections of G-CSF (+G) on d1-4. d, Representative IF staining of GMPs (purple) in Il1r1+/+ and Il1r1−/− 5-FU-treated BM, or BM of IL-1β-injected WT mice. e, Representative IF staining showing CD150+ megakaryocytes (red) in 5-FU- and G-CSF-treated WT BM. f–h, Megakaryocyte depletion studies in diphtheria toxin (DT) injected iDtr (Ctrl) and Cxcl4-Cre:iDtr (Cre) mice, and non-injected Ctrl mice [(−)DT]: (f) experimental scheme and representative IF staining of GMPs (purple) in 5-FU-treated BM, (g) ELISA cytokine measurements in BM fluids at d10 and d12, and (h) HSC cell cycle distribution at d12 (n = 3). Stars indicate pGMPs and dotted lines cGMPs. Results are expressed as mean ± S.D. (grey bars, reference range); *p ≤ 0.05; **p ≤ 0.01, ***p ≤ 0.001.
TGF-β1 and CXCL4 are both produced by megakaryocytes (Meg), which are important components of the HSC niche25,26. Interestingly, IF staining showed an overabundance of large, mature CD150+ Megs in close association with cGMPs in every tested regenerative context, including 5-FU, G-CSF and Ly-6G treatments (Fig. 5e, Extended Data Fig. 9e). To address the role of Megs in secreting quiescence-enforcing signals, we used a previously published diphtheria toxin (DT)-based approach to delete Megs in 5-FU-treated Cxcl4-Cre::iDtr mice25 (Fig. 5f, Extended Data Fig 9f). Strikingly, Megs depletion caused persisting cGMP formation during the Gr outburst period, a massive reduction in CXCL4 and TGF-β1 production, and prevention of HSC return to quiescence (Fig 5f–h, Extended Data Fig. 9g). Collectively, these findings demonstrate that many distinct and temporally regulated BM niche signals are important for various aspects of cGMP formation (Fig. 6a). This includes the early production of SCF and IL-1, which activate HSCs to produce MPP2/3 and initiate emergency myelopoiesis, the release of G-CSF, which dictates when self-renewing pGMPs are formed likely by triggering the Irf8/β-catenin progenitor self-renewal network, and the late production of TGF-β1 and CXCL4 by Megs surrounding cGMPs, which re-establish HSC quiescence and limit the duration of the regenerative response.
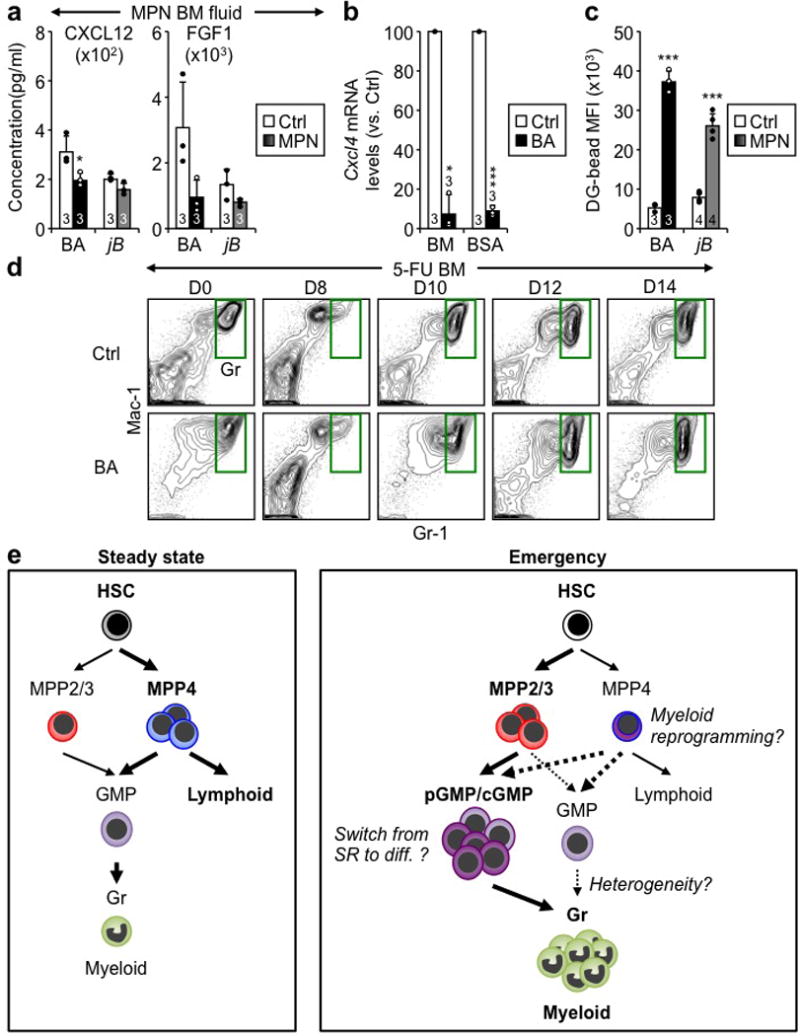
Figure 6. Continuous GMP cluster formation in leukemic myelopoiesis.
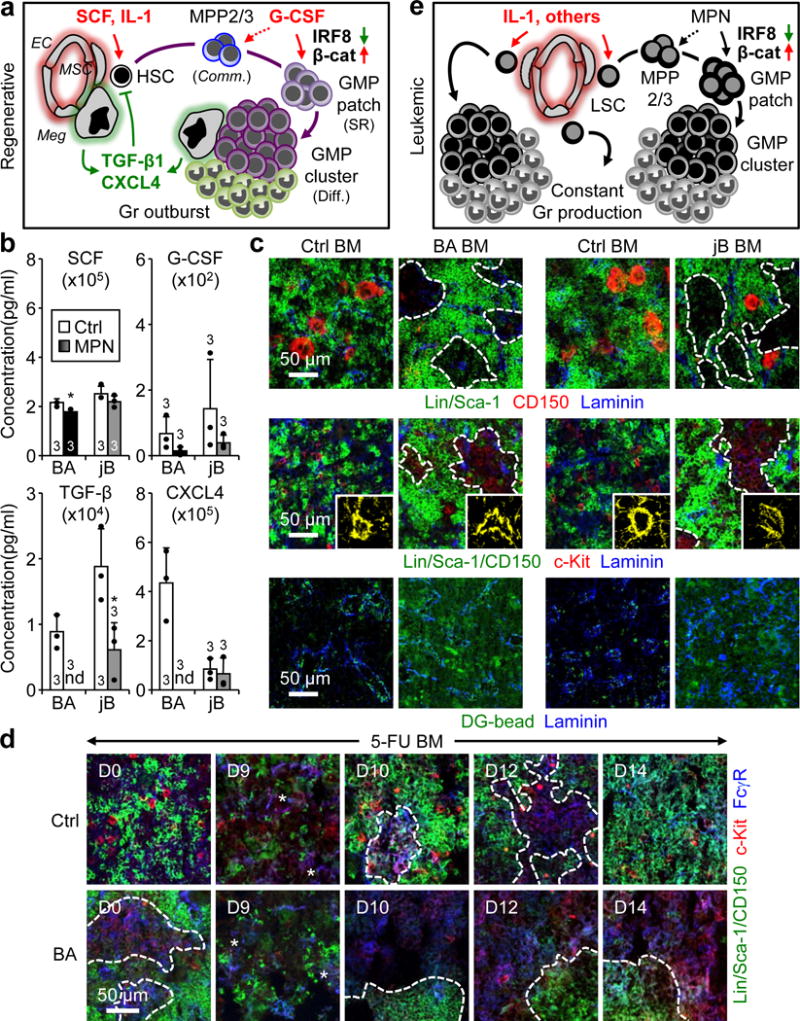
a, Model of regenerative myelopoiesis. EC: endothelial cells; MSC: mesenchymal stromal cells; Meg: megakaryocytes; Comm.: commitment; SR: self-renewal; Diff.: differentiation. Red indicates activation and green suppression. b, ELISA cytokine measurements in BM fluids of diseased BA, jB and respective Ctrl mice. c, Representative IF staining showing CD150+ megakaryocytes (red), vasculature (blue, pseudo-colored in yellow in magnified inserts) and vascular leakage (green, DG microsphere diffusion assay) in BA, jB and respective Ctrl BM. d, Representative IF staining of GMPs (purple) 5-FU-treated Ctrl and BA BM. e, Model of leukemic myelopoiesis. LSC: leukemia-initiating stem cells. Stars indicate pGMPs and dotted lines cGMPs. Results are expressed as mean ± S.D.; *p ≤ 0.05.
Deregulated cGMP formation in leukemia
To understand why cGMP formation is constitutively activated in leukemia, we performed similar ELISA analyses on BM fluid from BA and jB mice (Fig. 6b, Extended Data Fig. 10a). Strikingly, we found a consistent decrease in quiescence-enforcing cytokines in both MPN models, with undetectable levels of TGF-β1 and CXCL4 in BA mice, and significantly reduced TGF-β1 production in jB mice. IF staining revealed decreased numbers of CD150+ Megs in close proximity of cGMPs in both MPN models, ranging from almost absent in BA mice to infrequent in jB mice (Fig. 6c). QRT-PCR analyses further confirmed reduced Cxcl4 expression from BA Megs (Extended Data Fig. 10b). Moreover, IF staining of laminin+ blood vessels indicated constitutively damaged ECs with high vascular leakage in both MPN models (Fig. 6c, Extended Data Fig. 10c). We also observed persistence of very large cGMPs associated with constant Gr overproduction in 5-FU-treated BA mice (Fig. 6d, Extended Data Fig. 10d). These results indicate that transformed HSC-derived leukemic stem cells (LSC) continuously produce cGMPs as a direct consequence of high levels of activating cytokines, like IL-1, produced by the inflamed leukemic BM niche12. This, in turn, results in the overproduction of MPP2/3[9], which are committed to form pGMPs likely due to the constitutive activation of the self-renewal Irf8/β-catenin network by the driving oncogenes, rather than by extrinsic myeloid cytokines. Most importantly, this activation process never stops because essential quiescence-enforcing cytokines such as TGF-β1 and CXCL4 are missing due to the loss or insufficient production of leukemic Megs. Altogether, these results demonstrate that the leukemic BM niche is both constitutively activated and lacking important feedback mechanisms, thereby driving constant cGMP formation and Gr production (Fig. 6e).
Discussion
Our results expand the understanding of myeloid progenitor biology, and report a novel and highly dynamic in situ behavior of GMPs that for the first time link changes in their molecular and cellular functions with spatial organization in the BM niche. They identify two new functional states for GMPs, with self-renewing pGMPs building GMP clusters, and differentiating cGMPs producing mature myeloid cells until complete disappearance of the GMP clusters. This biphasic process is a transient feature of emergency myelopoiesis, and is highly controlled by the timed released of BM niche signals. These findings, together with the recent identification of myeloid-biased MPP2/3[4], help construct a revised map of emergency myelopoiesis pathways and a deeper understanding of their hijacking in leukemia (Extended Data Fig. 10e). They also provide an explanation for the recently reported molecular heterogeneity in GMPs6,7,27, with the co-existence in variable proportions of distinct steady state and self-renewing GMPs, and are essential for interpreting the results of lineage tracking experiments showing major contributions of MPPs and MPs to myeloid output1,2. Moreover, they equate cGMP formation with regulated myelopoiesis, and identify several new mechanisms that could be harnessed for translational applications. Pathological investigations have reported the presence of immature myeloid cell aggregates in bones of leukemic patients28, including clusters of proliferating myeloblasts surrounded by TGF-β-producing Megs29, which could represent similar aberrant cGMP formation in humans. Future studies will address whether targeting various regulators of cGMP formation can be used to prevent the development of myeloid malignancies or, conversely, to boost myeloid cell production in myelosuppressed conditions.
Online Methods
Mice
Six- to 12-week-old C57Bl/6-CD45.2 wild type mice were used as donor for cell isolation and in vivo treatments. Eight- to 12-week old C57Bl/6-CD45.1 (Boy/J) wild type mice were used as recipients for cell transplantation experiments. C57Bl/6-CD45.2 Scl-tTA::TRE-BCR/ABL (BA)9, junBflox/flox::MORE-Cre (jB)10, Irf8−/−16, Il-1r1−/−30, Csf1r-Gfp31, ß-actin-Gfp32, Ctnnb1 Flox(Ex3) (GOF)33, Ctnnb1flox/flox (LOF)34, Mx1-Cre35, Cxcl4-Cre36 and iDtr37 mice were used for bone harvest and in vivo treatments at various ages. Bones from control and MLL-AF9 transplanted mice11 shipped overnight (O/N) from Dr. Armstrong’s laboratory were immediately used upon delivery. BA mice were bred in the presence of 20 mg/L doxycycline (Sigma-Aldrich, D9891-10G) in their drinking water, and induced for CML-like MPN development by doxycycline withdrawal at 5 weeks of age. Recipient mice were irradiated at a lethal dose of 1100 rad delivered in split doses 3 hours apart using a Cs137 source (J.L. Shepherd). BM cells were injected in a volume of 100 μl into the retro-orbital plexus immediately after irradiation, and transplanted mice were treated with antibiotics for 4 weeks post-irradiation. Peripheral blood was obtained from retro-orbital bleeding, and either collected in tubes containing 4 ml of ACK (150 mM NH4Cl/10 mM KHCO3) containing 10 mM EDTA for flow cytometry analyses, or in EDTA-coated microtainer tubes (Beckton-Dickenson) for complete blood counts (CBC) using an Hemavet hematology system (Drew Scientific). BM cellularity was determined using a ViCell automated cell counter (Beckman-Coulter). For 5-FU treatments, mice were injected intraperitoneally (i.p.) once with 150 mg/kg 5-FU (Sigma-Aldrich, F6627-5G) or PBS control. All 5-FU-injected mice were screened for efficient myeloablation by CBC analyses and BM cellularity measurement. For Ly-6G treatment, mice were injected i.p. once with 0.1 mg of anti-Ly-6G or rat-IgG control antibodies (UCSF Hybridoma Core Facility). For G-CSF treatments, mice received daily i.p. injections of 5 μg G-CSF (Neupogen) or PBS control. For Mx1-Cre-mediated deletion, mice were injected i.p. three times 2 days apart with 250 μg of poly(I/C) (pIC, GE Healthcare) in 200 μl PBS. For IL-1β treatments, mice received daily i.p. injections of 0.5 μg IL-1β (Peprotech) or PBS/0.2% BSA control. For megakaryocyte depletion, mice received daily i.p. injections of 250 ng diphtheria toxin (List Biological Laboratories, 150) or PBS control. Megakaryocytes depletion was confirmed by CBC analyses and IF staining. For proliferation analyses, mice were injected once i.p. with either BrdU (Sigma-Aldrich, B5002-5G) or EdU (Thermo Fisher Scientific, A00144) 1 hour prior to sacrifice. For pimonidazol staining, mice were injected with 60 mg/kg pimonidazole-HCl (Hypoxyprobe, HP2-100Kit) and sacrificed 1 hour later. For investigations of blood vessel integrity, mice were injected with 50 μl of dragon green (DG) microspheres (Bangs Laboratories, FS02F/10597) 10 min prior sacrificing and immediately perfused with 10 ml PBS by cardiac puncture before bone harvest as described38. No specific randomization or blinding protocol was used, mouse of both genders were utilized, and all experiments were performed in accordance with UCSF IACUC approved protocols.
Flow cytometry
BM stem and progenitor populations were analyzed and/or isolated as previously described4. In brief, BM cells were obtained by either crushing leg, arm and pelvic bones or just flushing leg bones in Hanks’ Buffered Saline Solution (HBSS) containing 2% heat-inactivated FBS (Sigma-Aldrich). HBSS/2% FBS was used for all incubation and wash steps. Erythrocytes and contaminating bone material were removed by ACK lysis followed by centrifugation on a Ficoll gradient (Histopaque 1119, Sigma-Aldrich) for crushed bones. For cell analyses, unfractionated BM cells were incubated with purified, unconjugated-lineage antibodies (CD3 from Biolegend, and CD4, CD5, CD8, B220, Ter119, Mac-1 and Gr-1 from eBioscience) followed by goat anti-rat-PE-Cy5 (Invitrogen, A10691) and subsequently blocked with purified rat IgG (Sigma-Aldrich, I8015-10MG). Cells were then stained with c-Kit-APC-eFluor780 (eBioscience, 47-1171-82), Sca-1-PB (BioLegend, 108120), CD48-A647 (BioLegend, 103416), CD150-PE (BioLegend, 115904) and either CD34-FITC (eBioscience, 11-0341-85) together with FcγR-PerCP-eFluor710 (eBioscience, 46-0161-82) for combined stem/progenitor staining or only ESAM-FITC (Biolegend, 136205) for detailed analyses of HSC and MPP2/3 after 5-FU treatment. For Csf1r-Gfp mice, CD34-FITC was replaced by CD34-Bio (Biolegend, 119304) followed by staining with SA-PeCy7 (eBioscience, 25-4317-82). For GMP sorting, BM cells were first pre-enriched for c-Kit+ cells using c-Kit microbeads (Miltenyi Biotec, 130-091-224) and MACS Separation LS Columns (Miltenyi Biotec, 130-042-401), and stained as described with Lin/PE-Cy5, c-Kit-APC-eFluor780, Sca-1-PB, CD34-FITC and FcγR-PerCP-eFluor710. For mature cell analyses, unfractionated BM cells were stained with Mac-1-PE-Cy7 (eBioscience, 25-0112-82), Gr-1-PB (eBioscience, 57-5931-82), B220-APC-Cy7 (eBioscience, 47-0452-82) and CD19-PE (eBioscience, 12-0193-82). Peripheral blood cells were stained with Mac-1-PE-Cy7, Gr-1-PB, B220-APC-Cy7, CD3-APC (eBioscience, 17-0032-82) and Ter-119-PE-Cy5 (eBioscience, 15-5921-83), with either co-detection of GFP or addition of CD45.1-FITC (eBioscience, 11-0454-85) and CD45.2-PE (eBioscience, 12-0453) for analyses of chimeric mice. Stained cells were finally re-suspended in HBSS/2% FBS containing 1 μg/ml propidium iodide (PI) for dead cell exclusion, and either sorted on a FACS ARIAII or analyzed on a LSRII using DIVA software (Becton Dickinson). GMPs were double sorted to ensure maximum purity. For intracellular BrdU and Ki67/DAPI staining, BM cells were first stained as above, then fixed in Cytofix/Cytoperm buffer (BD Biosciences, 554714) for 10 min (BrdU) or 30 min (Ki67/DAPI) in the dark, washed in PermWash (BD Biosciences), permeabilized with CytoPerm Plus (BD Biosciences) for 10 min at room temperature (RT), re-fixed in Cytofix/Cytoperm buffer for 5 min in the dark and washed in PermWash. For BrdU staining, cells were then treated with 0.5 U/μl DNAseI in 3% BSA/0.2x PBS/5mM MgCl2/2mM CaCl2 for 30 min at RT in the dark, washed in PermWash, stained with FITC-conjugated anti-BrdU (347583, BD Biosciences) for 30 min at RT, washed in PermWash, and re-suspended in HBSS/2% FBS. For Ki67/DAPI staining, cells were then stained with anti-Ki67 antibody (eBioscience, 11-5698-80) for 1 hour at RT in the dark, washed in PermWash and re-suspended in HBSS/2% FBS containing DAPI at 1μg/ml (Sigma-Aldrich, 32670). In both cases, cells were analyzed on a FACS LSR II as described above.
Immunofluorescence on tissue sections
Mouse femurs or spleens were snap frozen in OCT (Tissue-Tek) and kept at −80C until sectioning. Frozen samples were cryosectioned (7μm) using a Cryostat equipped with the Cryojane tape transfer system and tungsten blades (Leica Microsystems). Sections were dried for 2–4 hours at RT and then frozen at −80°C until stained. Prior staining, sections were fixed with 100% acetone for 10 min at -20°C, dried for 5 min at RT and blocked for 1 hour 30 min at RT with 10% goat-serum (Gibco) in PBS. For regular GMP staining, sections were incubated first with rat anti-mouse c-Kit (Biolegend, 135102) primary antibody O/N at 4°C in PBS/10% goat-serum, followed with a goat anti-rat-Cy3 (Jackson Immunoresearch, 112-165-167) secondary antibody for 1 hour at RT in PBS/10% goat-serum and washed 3x for 5 min with PBS at RT. These wash steps were also performed between each staining steps. Sections were then blocked with 20 μg/ml Rat IgG (Sigma-Aldrich, I8015-10MG) for 10 min at RT in PBS, and finally stained with A488-conjugated lineage markers (B220 from Invitrogen, and Mac-1, Gr-1 and CD3 from Biolegend), Sca-1-A488 (Biolegend, 108116), CD150-A488 (Biolegend, 115916) and FcγR-A647 (UCSF Hybridoma Core Facility) for 1 hour 30 min at RT in PBS/10% goat-serum. For GMP staining of the MLL-AF9 transplantation model, the eBioscience mouse hematopoietic lineage biotin panel (88-7774), Sca-1-bio (eBioscience, 13-5981-1630), and CD150-bio (Biolegend, 115908) were used instead of A488-conjugated antibodies followed by staining with a SA-e450 (eBioscience, 48-4317) antibody. For laminin and GMP co-staining, FcγR was omitted and rabbit anti-mouse laminin (Sigma-Aldrich, L9393) followed by staining with a goat anti-rabbit-A647 secondary antibody was used instead. For the other GMP co-staining, A647-conjugated lineage antibodies (Biolegend, B220, Mac-1, Gr-1 and CD3), Sca-1-A647 (Biolegend, 108118) and CD150-A647 (Biolegend, 115918) were used instead of A488-conjugated antibodies, and FcγR was omitted. For laminin and ECM protein co-detection, rabbit anti-mouse laminin, Collagen IV (Abcam, ab6586) and fibronectin (Abcam, ab23750) were used followed by staining with a donkey anti-rabbit-A488 (Sigma-Aldrich, A-21206) secondary antibody. For clonality analyses, either CD45.2-FITC (Biolegend, 109816) or A488-conjugated anti-GFP (Aves labs, GFP-1020) were used. For laminin and DG-microsphere co-staining, sections were just stained with rabbit anti-mouse laminin followed by goat anti-rabbit-A647. For proliferation analyses, either pH3-FITC (Cell Signaling, 9708S) or Click-iT® EdU Alexa Fluor® 488 Imaging Kit (ThermoFisher Scientific, C10337) were used according to the manufacturer’s instructions. For myeloid/lymphoid cells and GMP co-staining, FcγR, CD150 and Sca-1 were omitted and B220-A488 (Invitrogen, RM2620), CD3-A488 (Biolegend, 100210), Gr-1-A647 (Biolegend, 108418) and Mac-1-A647 (Biolegend, 101218) were used instead. For megakaryocytes and GMP co-staining, FcγR was omitted and rat anti-mouse CD150 (Biolegend, 115902) followed by staining with a goat anti-rat-Cy3 secondary antibody was used instead. For cleaved caspase 3 (CC3) and GMP co-staining, FcγR was omitted and sections were fixed for 10 min with 4% PFA at RT then washed 3x for 5 min at RT in PBS/0.1% triton X100. Sections were first incubated with a rabbit anti-CC3 (Cell Signaling, 9661-S) antibody followed by a goat anti-rabbit-A647 (Thermo Fisher Scientific, A-21245) secondary antibody, and then stained as usual for c-Kit and A488-conjugated lineage. For pimonidazol staining, frozen sections were fixed with 4% PFA for 10 min at RT and stained with FITC-conjugated anti-pimonidazole (Hypoxyprobe, HP2-100Kit) according to the manufacturer’s instructions. After staining, all sections were counterstained with 1 μg/ml DAPI in PBS for 10 min at RT, mounted with fluoromount (Southern Biotech, 0100-01) and imaged on a SP5 upright or SP8 inverted confocal microscopes (Leica) with a 20x objective. Images were processed using Volocity software (Perkin Elmer v.6.2) and analyzed with ImageJ. The analyze particle function and a threshold mask covering laminin+ cells was also used in ImageJ to quantify DG-microsphere mean intensity fluorescence (MFI) outside of blood vessels.
Immunofluorescence on purified cells
GMP (2,000 cells/slide) were directly sorted onto poly-lysine coated slides (Sigma-Aldrich, P0425-72EA) and let settle down for 15 min at RT. Cells were washed 3x for 5 min with PBS at RT between each staining step. For GMP re-stain, cells were fixed with 100% acetone for 5 min at -20°C, blocked for 1 hour 30 min at RT with PBS/10% goat-serum and stained as described above for regular GMP staining on sections. For β-catenin staining, cells were fixed with 4% PFA for 10 min at RT, and then permeabilized and blocked with PBS/0.1% Tween-20/10% FBS for 1 hour at RT. Cells were then stained with a rabbit anti-mouse β-catenin (Cell Signaling, 9582S) primary antibody O/N at 4°C in PBS/0.1% Tween-20/10% FBS, followed by an anti-rabbit-A555 (Invitrogen, A31572) secondary antibody for 1 hour at RT in PBS/0.1% Tween-20/10% FBS. Slides were mounted with VectaShield (Vector Laboratories, H-1200) containing 1 μg/ml DAPI and imaged on a SP5 upright confocal microscope (Leica) with a 20x objective. Images were processed using Volocity software and an average of 390 individual cells were scored per condition for nuclear β-catenin quantification.
In vitro analyses
All cultures were performed at 37°C in a 5% CO2 water jacket incubator (Thermo Scientific). For clonogenic methylcellulose colony assays, GMPs (1 cell/well) were directly sorted into 96-well plates containing 100 μl methylcellulose (Stem Cell Technologies, M3231) supplemented with the following cytokines (all from PeproTech): IL-3 (10 ng/ml), GM-CSF (10 ng/ml), SCF (10 ng/ml), IL-11 (10 ng/ml), Flt-3L (10 ng/ml), Tpo (100 ng/ml) and Epo (4 U/ml). Colonies were visually scored after 7 days of culture.
Fluidigm analyses
Gene expression analyses using the Fluidigm 96.96 Dynamic Array IFC were performed as previously described4. Briefly, GMPs (100 cells/well) were directly sorted into 96 well-plates containing CellsDirect lysis buffer (Invitrogen, 11753-100), reverse-transcribed and pre-amplified for 18 cycles using Superscript III Platinum Taq DNA polymerase (Invitrogen, 18080-044) using a custom-made set of 96 proprietary target-specific primers (Fluidigm). The resulting cDNAs were analyzed on a Biomark system (Fluidigm) using EvaGreen Sybr dye (Bio-Rad, 172-5211). Data were collected using Biomark Data Collection Software (Fluidigm) and analyzed using Biomark qPCR analysis software with a quality threshold of 0.65 and linear baseline correction. Identical settings used across all experiments performed on different 96.96 dynamic arrays. Melt curves and Tm values for each assay reaction were checked individually, and reactions with melt curves showing multiple peaks or poor quality (<0.65) were discarded, leaving 60 genes and 2 housekeeping genes (Gusb and Gapdh) for further analyses. For gene expression quantification, data were exported as an Excel .csv file and analyzed by the ΔΔCt method using Gusb (5-FU GMPs) or Gapdh (MPN GMPs) for normalization. tSNE and PC analyses were performed as previously described4 on the 59 (5-FU GMPs) and 35 (MPN GMPs) most robustly expressed genes following quality control assessment, and normalized to Gapdh.
Single cell RNA-Seq
Single GMPs were directly sorted into individual wells of a 96-well PCR plate containing 2.3 μl of 0.2% Triton-X100 (Sigma-Aldrich, 93443) and 2.3 U of SUPERase-In RNase Inhibitor (Ambion, AM2694). cDNA was obtained and amplified following the described SMARTSEQ2 protocol39. Libraries were prepared for sequencing from 125 ng of cDNA using the Illumina Nextera XT DNA preparation kit. Pooled libraries were run on the Illumina HiSeq 2500 (5FU samples) or Illumina HiSeq 4000 (BA samples). Reads were mapped to the Mus musculus genome (Ensembl GRCm38.81) and the ERCC sequences using GSNAP (version 2015-09-29) with –B 5 (batch mode 5) –n 1 (maximum pathsallowed: 1) -Q (if maximum paths more than n, not print) –N 1 (look for novel splicing). HTseq-count was used to count the number of reads mapped to each gene with -s no (non-strand specific mode)40. For further analyses, we only retained samples that had (1) more than 100,000 reads mapped to nuclear mRNAs, (2) more than 4,000 highly detectable genes (defined as genes with more than 10 reads per million), and (3) less than 20% of mapped reads allocated to mitochondrial genes. The data were normalized for sequencing depth using the package scran from R Bioconductor. Highly variable genes were identified as described41, using a false discovery rate threshold equal to 0.1. Only highly variable genes were considered to perform PC analysis, using the prcomp command in R. Hierarchical clustering was performed using highly variable genes to identify ssGMPs and srGMPs. The pairwise Spearman correlation coefficients (ρ) were calculated between the expression levels of highly variable genes in each pair of cells. The dissimilarity matrix was then calculated as (1 − ρ)/2. Hierarchical clustering was performed using the default ‘complete’ method on the dissimilarity matrix. Identification of cells contained in each of the two clusters (corresponding to ssGMPs and srGMPs) was done using the cutree method with k=2 (2 groups). Genes differentially expressed (DE) between ssGMP and srGMP clusters were identified using DESeq2 (version 1.12.2)42 and only DE genes having a fold change significantly greater than 1.5 with a false discovery rate threshold less than 0.1 were used for hierarchical clustering.
qRT-PCR
For megakaryocytes enrichment, flushed BM cells were filtered through a 100μm mesh filter and sedimented 30 min at RT through a gradient of 1.5 to 3% BSA, with megakaryocytes pelleting at the bottom of the 3% BSA gradient. Total RNA was isolated from 3×10⁴ cells re-suspended in Trizol LS (Life Technologies, 10296-010) according to the manufacturer’s protocol. For qRT-PCR, RNA was treated with DNaseI and reverse-transcribed using SuperScript III kit and random hexamers (Life Technologies, 18080-051). Runs were performed on a 7900HT Fast Real-Time PCR system (Applied Biosystems) using SybrGreen reagents (Kapa Biosystems, KK4603) and the cDNA equivalent of 200 cells per reaction. Sequences for qRT-PCR primers were: Cxcl4, (S) TCTCCTCTGGGATCCATCTT, (AS) CATTCTTCAGGGTGGCTATGA (NM_019932); β-actin, (S) GACGGCCAGGTCATCACTATTG, (AS) AGGAAGGCTGGAAAAGAGCC (NM_007393). Values were normalized to β-actin expression levels.
Cytokine ELISA
For collecting BM fluids, the four long bones (two femurs and two tibiae) of each mouse were flushed with the same 200 μl of HBSS/2% FBS using a 0.3cc insulin syringe with a 28g needle and spun at 500 × g for 5 min to remove BM cells. Supernatants were further clarified by spinning down at 12,000 × g for 10 min, and samples were subsequently stored at −80°C until use. For ELISA measurements, 4x-diluted (SCF, CXCL12, FGF1), 5x-diluted (TGF-β1), 20x-diluted (G-CSF) and 1000x-diluted (PF4) samples were analyzed according to the manufacturer’s instructions (Raybiotech for SCF, G-CSF, PF4 and CXCL12; R&D Systems for TGF-β1) or as previously described for FGF122.
Statistics
All experiments were repeated as indicated. N indicates the numbers of independent biological repeats. The numbers of independent experiments are reported in the supplementary data. For immunofluorescence image, representative example of at least 2 independent experiments are shown. Data were expressed as means ± standard deviation (S.D.) except when indicated. Statistical analyses were performed using Prism 5.0 software (GraphPad). Pairwise statistical significance was evaluated by two-tailed Mann-Whitney u-test or paired Student’s t-test. Mice for treatment and transplantation were randomized, and no blinding protocol was used. No statistical method was used to predetermine sample size. P-values ≤ 0.05 were considered statistically significant.
Data availability
Datasets that support the findings of this study have been deposited online with the GEO accession numbers GSE90799. Source data for all the figures are provided with the paper.
Extended Data
Extended Data Fig. 1. Imaging GMPs in normal and leukemic conditions.
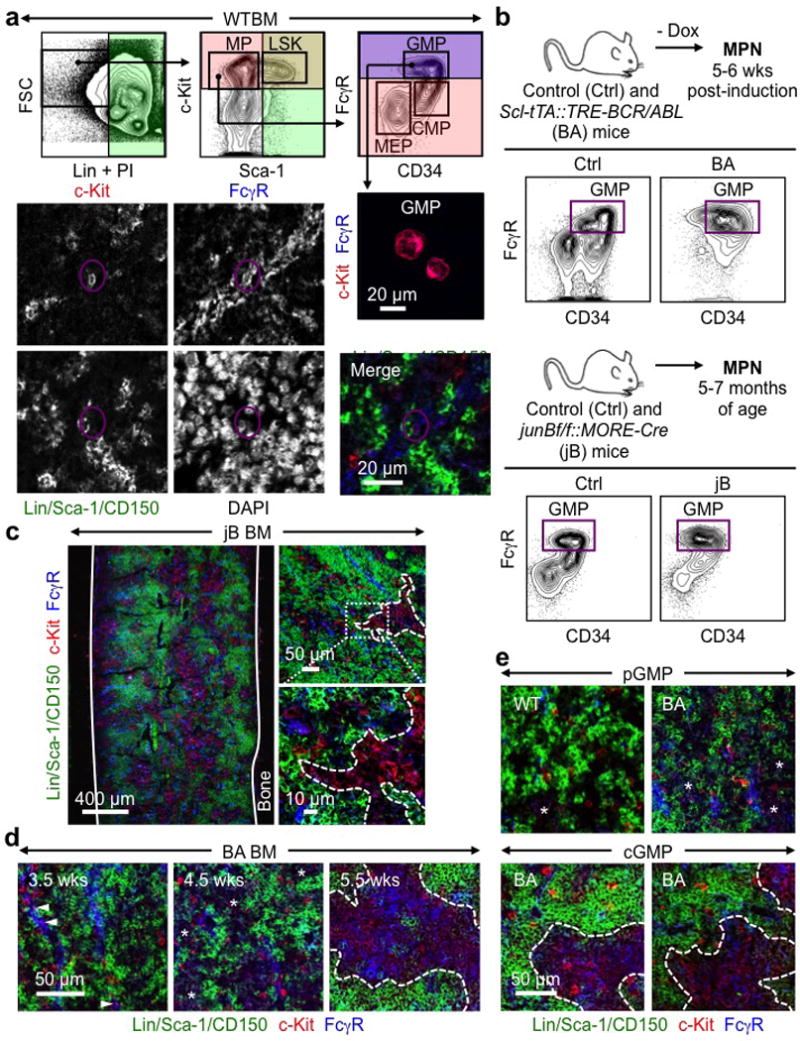
a, Gating strategy used to identify GMPs showing representative FACS plots with purified GMPs (purple) stained with IF markers, and a representative WT GMP (purple circle) on bone section. b, Inducible Scl-tTA::TRE-BCR/ABL (BA) and constitutive junBflox/flox::MORE-Cre (jB) mouse models of human MPN with representative GMP FACS plots. Ctrl: control; Dox: doxycycline. c, Representative IF staining showing GMPs (purple) in the BM of diseased jB mice. d, Progression of cGMP formation with disease development in BA mice at the indicated weeks (wks) post-dox withdrawal. e, Representative examples of loose pGMPs and compact cGMPs in WT and BA mice. Solid lines indicate bone surface, dotted lines cGMPs and stars pGMPs.
Extended Data Fig. 2. GMP cluster features.
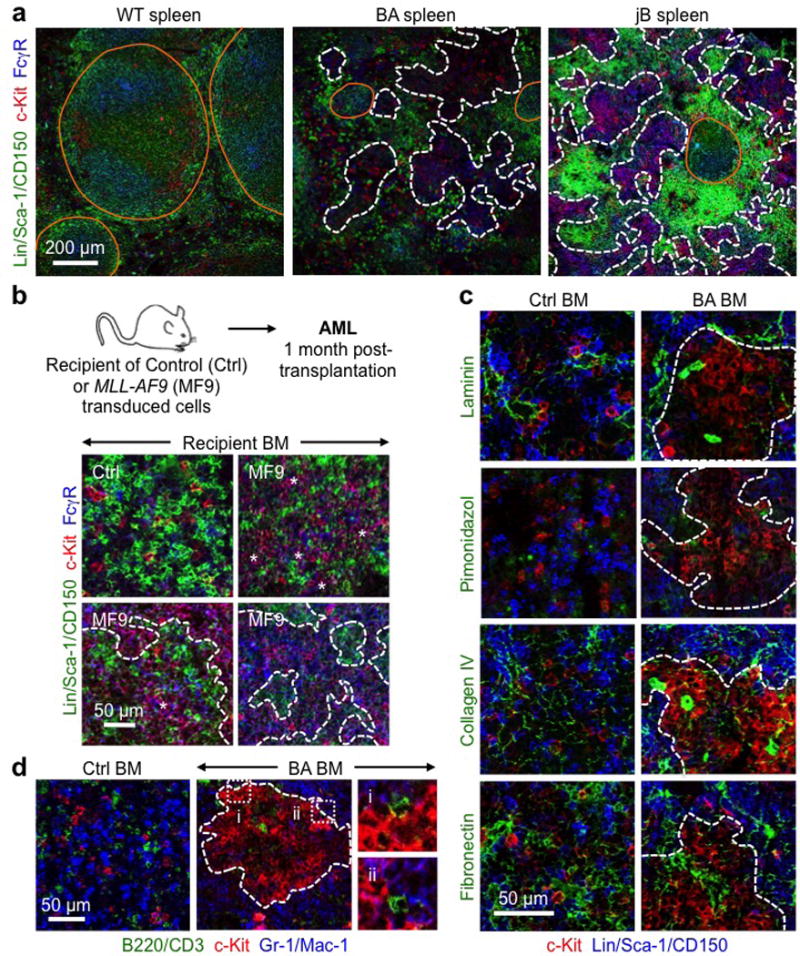
a, Representative IF staining of GMPs (purple) in WT and diseased BA and jB spleens. b, cGMPs in recipient mice developing AML following transplantation of MLL-AF9 (MF9) transduced LSK-derived cells. Experimental scheme and representative IF staining of GMPs (purple) in control (Ctrl) and diseased MF9 recipient BM. Three individual recipient mice are shown for MF9. c, Representative IF staining showing MPs (red) in relation to the indicated stromal features (green) in Ctrl and diseased BA BM. d, Representative IF staining showing MPs (red) in relation to mature lymphoid (green) and myeloid (blue) cells in Ctrl and diseased BA BM. Dotted lines indicate cGMPs; i and ii highlight two magnified areas. Orange lines indicate germinal centers, arrowheads individual GMPs, stars pGMPs and dotted lines cGMPs.
Extended Data Fig. 3. Regenerating BM following 5-FU treatment.
a, Gating strategy used to identify the indicated BM populations by flow cytometry in 5-FU-treated WT mice. Representative FACS plots are shown at the indicated days post-treatment. b, Frequency of BM LSK, HSC, MPP2/3, GMP and Gr at the indicated days post-5-FU treatment. c, Representative IF staining showing GMPs (purple) in 5-FU treated BM at the indicated days post-treatment. Of note, cGMPs were observed in all investigated bones (i.e., femur, tibia, humerus and sternum) at d12 post-5-FU. Solid lines indicate bone surface and dotted lines cGMPs. Results are expressed as mean ± S.D. (grey bars, reference range); *p ≤ 0.05, **p < 0.01, ***p < 0.001.
Extended Data Fig. 4. GMP clusters during myeloid regeneration and expansion.
a, Gr depletion in the BM of Ly-6G-treated mice with experimental scheme and representative FACS plots and IF staining of GMPs (purple) at the indicated days post-treatment. b, Gr expansion in the BM of G-CSF-treated mice with experimental scheme and representative FACS plots and IF staining of GMPs (purple) at the indicated days post-treatment. c, GMP clusters in the BM of HSC-transplanted mice with experimental scheme and representative IF staining of GMPs (purple) at the indicated weeks (wks) post-transplantation. Non-transplanted WT BM is shown for comparison. Dotted lines indicate cGMPs and stars pGMPs.
Extended Data Fig. 5. GMP clusters are clonal.
a–c, Clonality of regenerative GMP clusters: (a) Percent CD45.2+ cells in the peripheral blood (PB) pre- and BM post-5-FU treatment for each of the chimera mice used at the indicated days post-treatment (n = 2–3 mice/group); (b) Representative IF staining showing MPs (red) and CD45.2 (green) expression in 5-FU-treated chimera BM at the indicated days post-treatment; and (c) experimental scheme and representative IF staining showing MPs (red) and CD45.2 (green) expression separately in two independent d12 5-FU-treated chimera BM. Positive (+) clusters have ≥ 75% CD45.2+ cells and negative (−) clusters ≤ 5% CD45.2+ cells. Wks: weeks. d, Clonality of leukemic GMP clusters with experimental scheme and representative IF staining showing MPs (red) and GFP (green) expression from β-actin-Gfp cells in diseased BA chimera BM. Positive (+) clusters have ≥ 75% GFP+ cells and negative (-) clusters ≤ 5% GFP+ cells. Dotted lines indicate cGMPs.
Extended Data Fig. 6. Dynamic proliferation and differentiation in regenerating GMP clusters.
a, Representative FACS plots showing kinetics of BrdU incorporation in LSKs and GMPs from 5-FU-treated WT mice at the indicated days post-treatment. b, Representative IF staining showing MPs (red) in relation to proliferating EdU+ (green, upper row) and dividing pH3+ (green, lower row) cells in 5-FU-treated WT BM at the indicated days post-treatment. c, Representative IF staining showing MPs (red) in relation to mature lymphoid (green) and myeloid (blue) cells in 5-FU-treated WT BM at the indicated days post-treatment.
Extended Data Fig. 7. Molecular reprogramming in regenerating and leukemic GMP clusters.
a, Additional Fluidigm gene expression analyses of regenerating GMPs isolated from 5-FU-treated WT mice at the indicated days post-treatment (n = 2; 10–16 pools of 100 cells/condition). Results are expressed as fold change compared to levels in untreated (D0) GMPs and presented as boxplots (line: median; box: 25th and 75th percentiles; whisker: 90th and 10th percentiles). b, Loading association of principal component (PC) analyses of Fluidigm gene expression data from regenerating GMPs. c, Representative FACS plots of GFP expression in GMPs of 5-FU-treated Csf1r-Gfp reporter mice at the indicated days post-treatment. d, tSNE analyses and loading association of PC analyses of Fluidigm gene expression data from MPN GMPs isolated from diseased BA, jB and respective age-matched Ctrl mice (n = 4; 22–28 pools of 100 cells/condition). e, PC analyses of single cell GMP RNA-Seq data showing the distribution of each 5-FU time points (D0: 89 cells; D8: 187 cells; D10: 89 cells; D12: 75 cells; D14: 36 cells) and individual Ctrl (94 cells) and BA (BA(1): 68 cells; BA(2): 57 cells; BA(3): 87 cells) mice.
Extended Data Fig. 8. Irf8 and β-catenin function in self-renewing GMPs.
a, Representative FACS plots showing GMPs and Grs at steady state in Irf8+/+ and Irf8−/− mice. b, Experimental scheme for Irf8+/+ and Irf8−/− BM chimeric mice. c, Representative IF staining of donor-derived CD45.2+ (green) MP (red) in 5-FU-treated Irf8+/+ and Irf8−/− BM chimeric mice. d, Nuclear β-catenin in HSCs, MPP3 and MPP4 from Irf8+/+ and Irf8−/− mice. Results are expressed as percent positive cells. e, f, Experimental scheme for Ctnnb1 Ctrl and Ctnnb1 (e) loss-of-function (LOF) or (f) gain-of-function (GOF) mice. Stars indicate pGMPs and dotted lines cGMPs. Results are expressed as mean ± S.D.
Extended Data Fig. 9. Mechanisms controlling GMP cluster formation during regeneration.
a, ELISA measurement of cytokine levels in BM fluids of 5-FU-treated WT mice at the indicated days post-treatment. b, Quantification of vascular leakage in 5-FU-treated BM at the indicated days post-treatment. Results are expressed as dragon green (DG) microsphere MFI upon masking of laminin+ blood vessels. c, Representative IF staining showing GMPs (purple) in 5-FU-treated BM with concomitant daily injections of G-CSF (+G) on d8-11. d, Investigation of 5-FU-treated Il1r1+/+ and Il1r1−/− mice at the indicated days post-treatment showing representative IF staining of GMPs (purple), FACS plots of Gr regeneration, and quantification of the indicated BM populations. e, Representative IF staining of CD150+ megakaryocytes (red) in 5-FU- and Ly-6G-treated BM. f, g, Megakaryocyte depletion studies in diphtheria toxin (DT) injected iDtr (Ctrl) and Cxcl4-Cre:iDtr (Cre) mice showing (f) representative IF staining of CD150+ megakaryocytes (red) at the indicated days post-5-FU, and (g) representative Ki67/DAPI staining of HSCs at d12 post-5-FU. Stars indicate pGMPs and dotted lines cGMPs. Results are expressed as mean ± S.D. (grey bars, reference range); *p ≤ 0.05; **p ≤ 0.01, ***p ≤ 0.001.
Extended Data Fig. 10. Deregulated GMP cluster formation in leukemic mice.
a, ELISA measurements of cytokine levels in BM fluids of BA, jB and respective Ctrl mice. b, qRT-PCR measurement of Cxcl4 expression in BM and Meg-enriched BSA gradient of Ctrl and BA mice. c, Quantification of vascular leakage in diseased BA, jB and respective Ctrl BM. Results are quantified as dragon green (DG) microsphere MFI upon masking of laminin+ blood vessels. d, Representative FACS plots showing Gr regeneration in 5-FU-treated Ctrl and BA mice at the indicated days post-treatment. e, Revised model of emergency myelopoiesis. At steady state, blood production reflects the differential generation by HSCs of a small number of myeloid-biased MPP2/3 and a large number of lymphoid-biased MPP4, which both give rise to GMPs and contribute to myeloid output. In contrast, in emergency situations, HSCs are induced to overproduce MPP2/3, and MPP4 are reprogrammed towards almost exclusive myeloid output in large part due to cytokine stimulations and the triggering of specific regulatory pathways. An important consequence of the activation of this myeloid regeneration axis is the generation of localized pGMP/cGMP differentiation foci in the BM cavity, which drive the overproduction of granulocytes. This entire process is tightly regulated by BM niche signals and is transient during emergency myelopoiesis, but is constantly activated in myeloid leukemia. Important emerging questions are what controls the switch from self-renewing (SR) pGMP to differentiating (diff.) cGMP clusters, if expanded MPP2/3 and myeloid-reprogrammed MPP4 also generate pGMP/cGMPs or continue to produce regular GMPs (dotted lines), and whether Grs produced through this regeneration axis functionally differ from steady state Grs (heterogeneity). Results are expressed as mean ± SD; *p ≤ 0.05, ***p ≤ 0.001.
Supplementary Material
Acknowledgments
We thank Dr. A. Leavitt (UCSF) for providing G-CSF; Dr. P. Frenette (Einstein College of Medicine) for advice on imaging approaches and the gift of Clxl4-Cre:iDTR mice; M. Kissner and M. Lee for management of our Flow Cytometry core facility; all members of the Passegué laboratory for critical insights and suggestions. This work was supported by NIH K01DK098315 award to E.M.P.; a Bloodwise and CRUK program grants and Wellcome Trust funding to the Cambridge Stem Cell Institute to B.G.; and NIH R01HL092471, R01HL111266 and P30DK063720 grants, Rita Allen Scholar Award and Leukemia Lymphoma Society Scholar Award to E.P.
Footnotes
Author Contributions. A.H., M.B. and S.L. performed all of the experiments with help from S.Y.Z. for the dragon bead assays, Y-A.K. for the β-catenin studies, E.M.P. for the IL-1 experiments, F.J.C-N., X.W. and B.G. for Fluidigm and single cell RNA-Seq analyses, and H.C. and S.A. for MLL/AF9 experiments. K.B-H. initiated the imaging studies. A.H., M.B. and S.L. designed the experiments and interpreted the results. A.H. and E.P. wrote the manuscript.
Supplementary Information. See accompanying document.
Author Information. The authors declare no competing financial interests.
References
- 1.Sun J, et al. Clonal dynamics of native haematopoiesis. Nature. 2014;514:322–327. doi: 10.1038/nature13824. [DOI] [PMC free article] [PubMed] [Google Scholar]
- 2.Busch K, et al. Fundamental properties of unperturbed haematopoiesis from stem cells in vivo. Nature. 2015;518:542–546. doi: 10.1038/nature14242. [DOI] [PubMed] [Google Scholar]
- 3.Cabezas-Wallscheid N, et al. Identification of regulatory networks in HSC and their immediate progeny via integrated proteome, transcriptome, and DNA methylome analysis. Cell Stem Cell. 2014;15:507–522. doi: 10.1016/j.stem.2014.07.005. [DOI] [PubMed] [Google Scholar]
- 4.Pietras EM, et al. Functionally distinct subsets of lineage-biased multipotent progenitors control blood production in normal and regenerative conditions. Cell Stem Cell. 2015;17:35–46. doi: 10.1016/j.stem.2015.05.003. [DOI] [PMC free article] [PubMed] [Google Scholar]
- 5.Akashi K, Traver D, Miyamoto T, Weissman IL. A clonogenic common myeloid progenitor that gives rise to all myeloid lineages. Nature. 2000;404:193–197. doi: 10.1038/35004599. [DOI] [PubMed] [Google Scholar]
- 6.Wilson NK, et al. Combined single-cell functional and gene expression analysis resolves heterogeneity within stem cell populations. Cell Stem Cell. 2015;16:712–724. doi: 10.1016/j.stem.2015.04.004. [DOI] [PMC free article] [PubMed] [Google Scholar]
- 7.Paul F, et al. Transcriptional heterogeneity and lineage commitment in myeloid progenitors. Cell. 2015;163:1663–1677. doi: 10.1016/j.cell.2015.11.013. [DOI] [PubMed] [Google Scholar]
- 8.Perié L, Duffy KR, Kok L, de Boer RJ, Schumacher TN. The branching point in erythro-myeloid differentiation. Cell. 2015;163:1655–1662. doi: 10.1016/j.cell.2015.11.059. [DOI] [PubMed] [Google Scholar]
- 9.Reynaud D, et al. IL-6 controls leukemic multipotent progenitor cell fate and contributes to chronic myelogenous leukemia development. Cancer Cell. 2011;20:661–673. doi: 10.1016/j.ccr.2011.10.012. [DOI] [PMC free article] [PubMed] [Google Scholar]
- 10.Passegué E, Wagner EF, Weissman IL. JunB deficiency leads to a myeloproliferative disorder arising from hematopoietic stem cells. Cell. 2004;119:431–443. doi: 10.1016/j.cell.2004.10.010. [DOI] [PubMed] [Google Scholar]
- 11.Krivtsov AV, et al. Transformation from committed progenitor to leukaemia stem cell initiated by MLL-AF9. Nature. 2006;442:818–822. doi: 10.1038/nature04980. [DOI] [PubMed] [Google Scholar]
- 12.Schepers K, et al. Myeloproliferative neoplasia remodels the endosteal bone marrow niche into a self-reinforcing leukemic niche. Cell Stem Cell. 2013;13:285–299. doi: 10.1016/j.stem.2013.06.009. [DOI] [PMC free article] [PubMed] [Google Scholar]
- 13.Cain DW, Snowden PB, Sempowski GD, Kelsoe G. Inflammation triggers emergency granulopoiesis through a density-dependent feedback mechanism. PLoS One. 2011;6:e19957. doi: 10.1371/journal.pone.0019957. [DOI] [PMC free article] [PubMed] [Google Scholar]
- 14.Boettcher S, et al. Endothelial cells translate pathogen signals into G-CSF-driven emergency granulopoiesis. Blood. 2014;124:1393–1403. doi: 10.1182/blood-2014-04-570762. [DOI] [PMC free article] [PubMed] [Google Scholar]
- 15.Tamura T, Kurotaki D, Koizumi S. Regulation of myelopoiesis by the transcription factor IRF8. Int J Hematol. 2015;101:342–351. doi: 10.1007/s12185-015-1761-9. [DOI] [PubMed] [Google Scholar]
- 16.Holtschke T, et al. Immunodeficiency and chronic myelogenous leukemia-like syndrome in mice with a targeted mutation of the ICSBP gene. Cell. 1996;87:307–317. doi: 10.1016/s0092-8674(00)81348-3. [DOI] [PubMed] [Google Scholar]
- 17.Scheller M, et al. Altered development and cytokine responses of myeloid progenitors in the absence of transcription factor, interferon consensus sequence binding protein. Blood. 1999;94:3764–3771. [PubMed] [Google Scholar]
- 18.Scheller M, et al. Cross talk between Wnt/β-catenin and Irf8 in leukemia progression and drug resistance. J Exp Med. 2013;210:2239–2256. doi: 10.1084/jem.20130706. [DOI] [PMC free article] [PubMed] [Google Scholar]
- 19.Jamieson CH, et al. Granulocyte-macrophage progenitors as candidate leukemic stem cells in blast-crisis CML. N Engl J Med. 2004;351:657–667. doi: 10.1056/NEJMoa040258. [DOI] [PubMed] [Google Scholar]
- 20.Wang Y, et al. The Wnt/beta-catenin pathway is required for the development of leukemia stem cells in AML. Science. 2010;327:1650–1653. doi: 10.1126/science.1186624. [DOI] [PMC free article] [PubMed] [Google Scholar]
- 21.Schepers K, Campbell TB, Passegué E. Normal and Leukemic Stem Cell Niches: Insights and Therapeutic Opportunities. Cell Stem Cell. 2015;16:254–267. doi: 10.1016/j.stem.2015.02.014. [DOI] [PMC free article] [PubMed] [Google Scholar]
- 22.Zhao M, et al. Megakaryocytes maintain homeostatic quiescence and promote post-injury regeneration of hematopoietic stem cells. Nat Med. 2014;20:1321–1326. doi: 10.1038/nm.3706. [DOI] [PubMed] [Google Scholar]
- 23.Pietras EM, et al. Chronic interleukin-1 drives haematopoietic stem cells towards precocious myeloid differentiation at the expense of self-renewal. Nat Cell Biol. 2016;18:607–618. doi: 10.1038/ncb3346. [DOI] [PMC free article] [PubMed] [Google Scholar]
- 24.Cain DW, Snowden PB, Sempowski GD, Kelsoe G. Inflammation triggers emergency granulopoiesis through a density-dependent feedback mechanism. PLoS One. 2011;6(5):e19957. doi: 10.1371/journal.pone.0019957. [DOI] [PMC free article] [PubMed] [Google Scholar]
- 25.Bruns I, et al. Megakaryocytes regulate hematopoietic stem cell quiescence through CXCL4 secretion. Nat Med. 2014;20:1315–1320. doi: 10.1038/nm.3707. [DOI] [PMC free article] [PubMed] [Google Scholar]
- 26.Nakamura-Ishizu A, Takubo K, Kobayashi H, Suzuki-Inoue K, Suda T. CLEC-2 in megakaryocytes is critical for maintenance of hematopoietic stem cells in the bone marrow. J Exp Med. 2015;212:2133–2146. doi: 10.1084/jem.20150057. [DOI] [PMC free article] [PubMed] [Google Scholar]
- 27.Olsson A, et al. Single-cell analysis of mixed-lineage states leading to a binary cell fate choice. Nature. 2016;537:698–702. doi: 10.1038/nature19348. [DOI] [PMC free article] [PubMed] [Google Scholar]
- 28.Orazi A. Histopathology in the diagnosis and classification of acute myeloid leukemia, myelodysplastic syndromes, and myelodysplastic/myeloproliferative diseases. Pathobiology. 2007;74:97–114. doi: 10.1159/000101709. [DOI] [PubMed] [Google Scholar]
- 29.Raza A, et al. High expression of transforming growth factor-β long cell cycle times and a unique clustering of S-phase cells in patients with acute promyelocytic leukemia. Blood. 1992;79:1037–1048. [PubMed] [Google Scholar]
- 30.Glaccum MB, et al. Phenotypic and functional characterization of mice that lack the type I receptor for IL-1. J Immunol. 1997;159:3364–3371. [PubMed] [Google Scholar]
- 31.Sasmono RT, et al. A macrophage colony-stimulating factor receptor-green fluorescent protein transgene is expressed throughout the mononuclear phagocyte system of the mouse. Blood. 2003;101:1155–1163. doi: 10.1182/blood-2002-02-0569. [DOI] [PubMed] [Google Scholar]
- 32.Wright DE, et al. Cyclophosphamide/granulocyte colony-stimulating factor causes selective mobilization of bone marrow hematopoietic stem cells into the blood after M phase of the cell cycle. Blood. 2001;97:2278–85. doi: 10.1182/blood.v97.8.2278. [DOI] [PubMed] [Google Scholar]
- 33.Brault V, et al. Inactivation of the beta-catenin gene by Wnt1-cre-mediated deletion results in dramatic brain malformation and failure of craniofacial development. Development. 2001;128:1253–1264. doi: 10.1242/dev.128.8.1253. [DOI] [PubMed] [Google Scholar]
- 34.Haradaet N, et al. Intestinal polyposis in mice with a dominant stable mutation of the beta-catenin gene. EMBO J. 1999;18:5931–5942. doi: 10.1093/emboj/18.21.5931. [DOI] [PMC free article] [PubMed] [Google Scholar]
- 35.Kuhn R, Schwenk F, Aguet M, Rajewsky K. Inducible gene targeting in mice. Science. 1995;269:1427–1429. doi: 10.1126/science.7660125. [DOI] [PubMed] [Google Scholar]
- 36.Tiedt R, et al. Pf4-Cre transgenic mice allow the generation of lineage-restricted gene knockouts for studying megakaryocyte and platelet function in vivo. Blood. 2007;109:1503–1506. doi: 10.1182/blood-2006-04-020362. [DOI] [PubMed] [Google Scholar]
- 37.Buch T, et al. A Cre-inducible diphtheria toxin receptor mediates cell lineage ablation after toxin administration. Nat Methods. 2005;2:419–426. doi: 10.1038/nmeth762. [DOI] [PubMed] [Google Scholar]
- 38.Fuxe J, et al. Pericyte requirement for anti-leak action of angiopoietin-1 and vascular remodeling in sustained inflammation. Am J Pathol. 2011;178:2897–2909. doi: 10.1016/j.ajpath.2011.02.008. [DOI] [PMC free article] [PubMed] [Google Scholar]
- 39.Picelli S, et al. Full-length RNA-seq from single cells using Smart-seq2. Nat Protoc. 2014;9:171–181. doi: 10.1038/nprot.2014.006. [DOI] [PubMed] [Google Scholar]
- 40.Anders S, Pyl PT, Huber W. HTSeq–a Python framework to work with high-throughput sequencing data. Bioinformatics. 2015;31:166–169. doi: 10.1093/bioinformatics/btu638. [DOI] [PMC free article] [PubMed] [Google Scholar]
- 41.Brennecke P, et al. Accounting for technical noise in single-cell RNA-seq experiments. Nat Methods. 2013;10:1093–1095. doi: 10.1038/nmeth.2645. [DOI] [PubMed] [Google Scholar]
- 42.Love MI, Huber W, Anders S. Moderated estimation of fold change and dispersion for RNA-seq data with DESeq2. Genome Biol. 2014;15:55. doi: 10.1186/s13059-014-0550-8. [DOI] [PMC free article] [PubMed] [Google Scholar]
Associated Data
This section collects any data citations, data availability statements, or supplementary materials included in this article.
Supplementary Materials
Data Availability Statement
Datasets that support the findings of this study have been deposited online with the GEO accession numbers GSE90799. Source data for all the figures are provided with the paper.