
Extended Data Fig. 1. Imaging GMPs in normal and leukemic conditions.
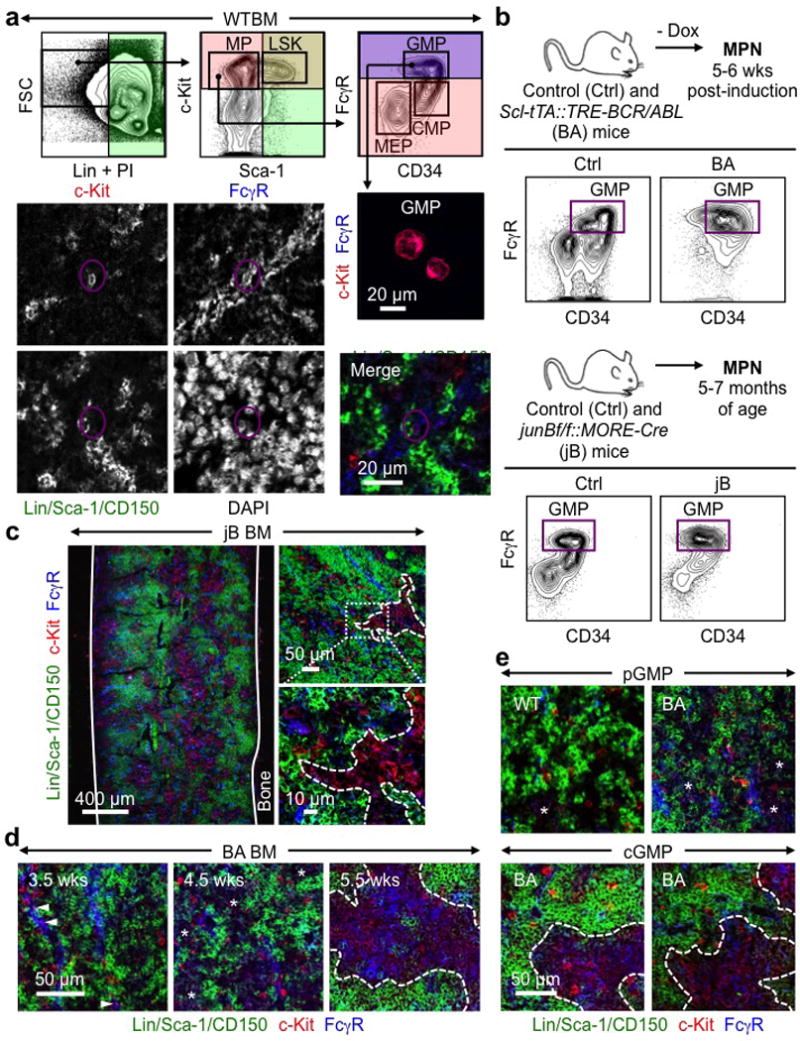
a, Gating strategy used to identify GMPs showing representative FACS plots with purified GMPs (purple) stained with IF markers, and a representative WT GMP (purple circle) on bone section. b, Inducible Scl-tTA::TRE-BCR/ABL (BA) and constitutive junBflox/flox::MORE-Cre (jB) mouse models of human MPN with representative GMP FACS plots. Ctrl: control; Dox: doxycycline. c, Representative IF staining showing GMPs (purple) in the BM of diseased jB mice. d, Progression of cGMP formation with disease development in BA mice at the indicated weeks (wks) post-dox withdrawal. e, Representative examples of loose pGMPs and compact cGMPs in WT and BA mice. Solid lines indicate bone surface, dotted lines cGMPs and stars pGMPs.