

Abstract
In patients with Alzheimer’s disease (AD) and in a triple transgenic (3xTgAD) mouse model of AD low glucose metabolism in the brain precedes loss of memory and cognitive decline. The metabolism of ketones in the brain by-passes glycolysis and therefore may correct several deficiencies that are associated with glucose hypometabolism. A dietary supplement composed of an ester of D-β-hydroxybutyrate and R-1,3 butane diol referred to as ketone ester (KE) was incorporated into a rodent diet and fed to 3xTgAD mice for 8 months. At 16.5 months of age animals were euthanized and brains dissected. Analyses were carried out on the hippocampus and frontal cortex for glycolytic and TCA (Tricarboxylic Acid) cycle intermediates, amino acids, oxidized lipids and proteins, and enzymes. There were higher concentrations of D-β-hydroxybutyrate in the hippocampus of KE-fed mice where there were also higher concentrations of TCA cycle and glycolytic intermediates and the energy-linked biomarker, n-acetyl aspartate compared to controls. In the hippocampi of control-fed animals the free mitochondrial [NAD+]/[NADH] ratio were highly oxidized, whereas, in KE-fed animals the mitochondria were reduced. Also, the levels of oxidized protein and lipids were lower and the energy of ATP hydrolysis was greater compared to controls. 3xTgAD mice maintained on a KE-supplemented diet had higher concentrations of glycolytic and TCA cycle metabolites, a more reduced mitochondrial redox potential, and lower amounts of oxidized lipids and proteins in their hippocampi compared to controls. The KE offers a potential therapy to counter fundamental metabolic deficits common to patients and transgenic models.
Keywords: ketone bodies, hippocampus, cellular energetics, mitochondria, glycolysis
Graphical Abstract
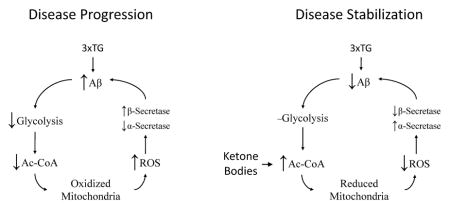
We hypothesized that a dietary ketone supplement (an ester of D-β-hydroxybutyrate and R-1,3 butanediol) would elevate blood ketones, overcome brain glucose hypometabolism, rescue mitochondrial function, and reduce beta-amyloid production in a triple transgenic (3xTG AD) mouse model of Alzheimer’s disease (AD). This study is the first endeavor to comprehensively quantify neurochemical deficits in the 3xTG model and offers a novel approach for treating metabolic deficits in AD.
Introduction
A preponderance of research carried out over the past several decades in both human subjects with Alzheimer’s disease (AD) (Cunnane et al. 2011) and in animal models of AD (Ding et al. 2013a, Yao et al. 2009, Ding et al. 2013b) have demonstrated that well in advance of demonstrable cognitive decline and memory defects brain glucose hypometabolism is often evident. Early reports estimated that glucose utilization decreased between 20–30% based on 18F-fluorodeoxyglucose uptake using PET imagining in patients with “senile dementia of the Alzheimer’s type” (de Leon et al. 1983, Frackowiak et al. 1981). Although low glucose metabolism occurs differentially across the brain, it is primarily associated with regions that affect learning, memory, and behavior. A glucose-replacement therapy utilizing ketone bodies may recover energy deficiencies associated with low glucose metabolism and offers a potential therapeutic advantage for delaying and/or decreasing cognitive decline in pre-symptomatic individuals (Mosconi et al. 2008, Veech et al. 2001, Veech and King, 2016).
A ketone dietary supplement using an ester of β-hydroxybutyrate (KE) was fed to a triple transgenic AD mouse strain (3xTgAD) when animals were 8.5 months of age for an additional 8 months. These animals were subjected to a battery of memory and anxiety-related behavioral paradigms at 12 and 15 months and histological analysis at the termination of the study (Kashiwaya et al. 2013). As reported, KE-fed animals showed improvements in behavior and learning and had significantly lower amounts of amyloid-beta (Aβ) and phosphorylated Tau (p-Tau) proteins in regions of the hippocampus. To assess the effects of the KE dietary intervention on cellular metabolism we now present quantitative determinations of the glycolytic and TCA cycle intermediates and amino acids utilizing stable isotope dilution mass spectrometry and signatures of oxidative stress (protein and lipid oxidation) in the same sets of animals. Since accumulation of Aβ may, in part, be influenced by the cellular redox environment (the free [NAD+]/[NADH] and [NADP+]/[NADPH] ratios) as the reduced forms of these couples restore the reductive capacity of cellular antioxidants (Kwak et al. 2011), we also determined the free [NAD+]/[NADH] and [NADP+]/[NADPH] ratios. The hippocampus and frontal cortex as regions that had relatively high and low accumulation Aβ and p-Tau proteins were chosen for comparison in these analyses (Kashiwaya et al. 2013).
Materials and Methods
Animal procedures, diets, and tissue harvesting
All procedures were approved by the Animal Care and Use Committee of the National Institute on Aging. The initial generation and characterization of 3xTgAD mice have been reported previously Kashiwaya et al. (2013). The mice used in the present study were from a colony that had been backcrossed onto a C57BL/6 genetic background for 8 generations. As reported previously in Kashiwaya et al. (2013), there were between 11 and 15 male 3xTgAD mice housed in groups of 2 to 3 mice per cage under a standard 12-hour light and dark circadian cycle. When they were 8.5 months old a simple randomization procedure was used in assigning mice to each of the two diet groups, whereby animals were randomized so that littermates were distributed equally between the control-fed and ketone ester-fed diet groups (ketone ester, KE; or control, CON) of 15 mice per group. Also, the mean weight of animals from each diet group, KE-fed (37.1 +/− 1.8 g) and CON-fed (37.5 +/− 0.8 g) approximated the mean weight of the total sample (37.3 +/−1.1g). Mice were not pair-fed but received a 4- to 5-g pellet (10.8–13.5 kcal) at approximately 06:00 hours each day. Body weight was measured periodically throughout the study. Mice in both dietary groups were similarly active and as noted in Kashiwaya et al. (2013) KE-fed animals were noticeably more active in the open field test indicating a sufficient calorie intake. The CON and KE diets have been fully described previously (Kashiwaya et al. 2013). Briefly, the CON and KE diets were produced in-house following a customized procedure which included mixing purified dietary macronutrients with additional nutrient and vitamin mixes blended with water to obtain a semi-solid pellet in accord with nutritional guidelines set forth by American Institute of Nutrition for rodent maintenance diets (AIN-93) (Kashiwaya et al., 2013). The caloric content of both CON and KE diets was 2.7 kcal/g. The carbohydrate content of the CON and KE diets was 64.9 and 43.5 percent calories, respectively. The KE diet also included an additional 21.5% of calories in the form of the ketone ester. The control diet contained 137 g corn starch/1000 g diet and 0 g KE. The KE diet contained 85 g starch/1000 g and 125 g KE/1000 g diet. The KE was synthesized from D-β-hydroxybutyrate and R-1,3-butanediol (Kashiwaya et al. 2013). Animals were fed adlibitum either the CON or KE diet beginning at 8.5 mo. of age for an additional 8 mo. Animals fed the KE diet maintained body weight and further details of these determinations have been published (Kashiwaya et al. 2013). (Kashiwaya, et al., 2013). Mice were euthanized at 16.5 months of age and the cortex and hippocampus were removed, half of the tissue was immediately frozen in liquid nitrogen and stored at −80°C until analysis and other half processed for histological analysis as reported brains (Kashiwaya et al. 2013). Rapid freezing of the brain was the method chosen for tissue preservation as microwave fixation has been shown to alter citrate concentrations and effect ATP levels (Srivastava et al. 2012a). The frozen brain tissue was then used for protein and metabolite assays as described below.
Materials
Reagents and instrumentation
Stable isotopically-labeled (13C- and 2H-) organic acid standards and amino acids (lactate, pyruvate, citrate, α-ketoglutarate, succinate, fumarate and malate) were procured from CDN Isotopes (Pointe-Claire Quebec). The 13C-labeled phosphoenol pyruvate was obtained from Cambridge Isotope Labs (Cambridge, MA) (Srivastava et al. 2012a). Labeled 24(S)-hydroxycholesterol (d6) was obtained from Avanti Polar Lipids (Alabaster, AL). Labeled dihydroxyacetone phosphate (DHAP), 3-phosphoglycerate (3PG) and isocitrate were synthesized in house as previously described (Srivastava et al. 2012a). The 13C-acetyl-CoA and 13C-glucose-6-phosphate were obtained from Sigma-Aldrich (St. Louis, MO). Labeled 4-HNE was obtained from Cayman Chemical Company (Ann Arbor, MI). The N-methyl-N-(tert-butylmethylsilyl) trifluoroacetamide (MTBSTFA) with 1% tert-butyldimethylchlorosilane (TBDMCS) reagent and the bis-trimethylfluoro methyl silyl (BSTFA) were purchased from Pierce (Rockford, IL). Samples were analyzed on either an Agilent 5973 quadrupole GC-MS (Agilent, Wilmington, DE) or on an Agilent capillary electrophoresis-ion trap mass spectrometer (Ultra) using an Agilent 1100 series binary pump with electrospray ionization (Agilent, Wilmington, DE) according to previously established procedures (Srivastava et al. 2012a, Kashiwaya et al. 2010).
Blood glucose and ketone analysis
Thawed mouse plasma was analyzed for glucose and β-hydroxybutyrate using glucose and ketone sticks and a Precision-Xtra meter (Abbott Labs, Abbott Park, IL, USA) according to previous methods (Kashiwaya et al. 2013).
Perchloric acid (PCA) extraction
Frozen brain tissue (20–40 mg) was extracted into a 3.6% PCA solution and neutralized with KHCO3 (3 M) according to previously described methods (Kashiwaya et al. 2013). Final volume of the extract was 100 μL.
Gas chromatography-mass spectrometry of organic acids
Twenty microliters of the extract was taken for determination of lactate, pyruvate, citrate, isocitrate, α-ketoglutarate, succinate, fumarate, malate, β-hydroxybutyrate, and acetoacetate and a commensurate amount of the C13- or 2H- labeled internal standards (2 to 3 fold in excess of endogenous metabolite) were added for quantitative analysis by gas chromatography-mass spectrometry. The aqueous solution of the sample specimens was reduced to dryness under a stream of nitrogen (99.99%) and reacted with tertiary butyl dimethyl silyl chloride to form the silyl esters and ethers according to previously described methods (Srivastava et al. 2012a). One microliter of the derivatized sample was injected onto a 30 meter capillary gas chromatograph column and analyzed in the electron impact mode on a quadrupole mass spectrometer. Individual metabolites were quantified using the ratio of the area counts of the most prominent ion fragments of the unlabeled compound referenced to the analogous ion of the labeled internal standards.
Gas chromatography-mass spectrometry of phosphorylated glycolytic intermediates
Twenty microliters of the extract was taken for determination of glucose-6-phosphate (G-6-P), dihydroacetone-phosphate (DHAP), 3-phosphoglycerate (3PG) and phosphoenol pyruvate (PEP). The phosphorylated compounds were analyzed as their tri-methylsilyl ether derivatives (TMS) using GC–MS in the electron impact mode and quantified using the 13C-labeled internal standards for each analyte according to previously published procedures (Srivastava et al. 2012a).
Gas chromatography-mass spectrometry of glutamate, aspartate, N-acetylaspartate, γ–aminobutyric acid and 4-hydroxynoneal (4-HNE)
Perchloric acid extracts of frozen brain were used to measure glutamate, aspartate, N-acetylaspartate, γ-aminobutyric acid (GABA) and 4-HNE. They were analyzed as the silyl ether derivatives, quantified using 13C-labeled standards for each analyte using gas chromatography-mass spectrometry as previously described (Pawlosky et al. 2010).
Capillary electrophoresis-mass spectrometry of acetyl-CoA
Determination of Acyl-CoA Compounds the brain tissue samples were extracted using a modified chloroform-methanol extraction procedure and analyzed by CE-MS according to the previously described method (Kashiwaya et al. 2010) with the addition of 13C-labeled acetyl CoA internal standards for quantification as described previously (Pawlosky et al. 2010).
Gas chromatography-mass spectrometry of 24(S)-hydroxycholesterol
For determining the concentration of 24(S)-hydroxycholesterol, to 200 μl of thawed plasma was added to 6 μl of 24(S)-hydroxycholesterol (d6) (52 ng/μL) and extracted with a 3:4:2 water:chloroform:methanol solution. Samples were vortexed for 2 min and centrifuged at 4°C to allow the chloroform and water layers to separate. The chloroform layer was removed and 20 μl of the solution was taken and evaporated under a stream of nitrogen for GC–MS analysis according to previously published procedures (Kemper et al. 2015) and quantified directly by comparing the peak area ratio of the pseudo-molecular ion of the labeled internal standard to that of the native compound.
Protein and western analysis
Whole cell lysate was prepared by adding 5μL/mg tissue of ice cold lysis buffer (20mM HEPES, 1% Triton x-100, 1% sodium deoxycolate, 1mM DTT, 1% SDS, 1X protease inhibitors (Thermo Scientific Pierce Protein Biology), 1 mM NaF, 5 mM EDTA, 10 mM β-glycerophosphate and 250 μM Na3VO4) and sonicated 3 times for 5 seconds on ice, clarified by centrifugation at 15,000 × g for 12 minutes at 4°C and stored at −80°C until use. Protein concentration was measured using detergent compatible protein quantification kit (Biorad) and final loading samples were prepared at 4μg/μL protein in LDS Sample Buffer (Life Technologies) with 50 mM DTT (Life Technologies). Sixty μg of whole cell lysate were loaded into each well of a NuPAGE NOVEX 4–12% Bis-Tris gel with MES running buffer, transferred onto Immobilon-FL PVDF (Millipore). A solution of 5% milk in TBS + 0.1% Tween 20 was used to block and dilute primary and secondary antibodies (1:5000, LiCor Biosciences, Rabbit antibody conjugated with IRdye 800, mouse antibody conjugated with IRdye 680), scans and quantifications were used using a LiCor Odyssey scanner. The primary antibodies included: ADAM10 (Rb 1:1000, Abcam ab1997), GFAP (Rb 1:50,000, Abcam ab7260), Actin (Ms 1:2000, Abcam ab3280), BACE1 (Rb 1:1000, Abcam ab2077).
Quantification of protein oxidation products
Oxyblot Protein Oxidation Detection Kit (Millipore, USA) was used according to manufacturer’s instructions. Fifteen μg of tissue lysate were used in each sample, half of the resulting derivitized/neutralized solution was used for downstream blotting. Briefly, NuPAGE Bis-Tris 4–12% Gels (Life Technologies) were run using MES running buffer (Life technologies), transferred onto Immobilon-FL PVDF (Millipore), incubated with fluorescent secondary antibody (Rabbit, LiCor Biosciences, 1:5000 in 1% BSA/PBST); blots were scanned using a LiCor Odyssey bed scanner (for additional details see Kemper et al. (2013). As a control for auto-fluorescence of the derivatized protein, blots were first scanned without secondary antibody, no signal was observed in any of the blots without secondary antibody. Non-derivatized control had extremely low signal, which was used as background for quantification purposes.
Calculations of the concentration of oxaloacetate, the ΔG of ATP hydrolysis, the free [NAD+]/[NADH] ratio, and the free [NADP+]/[NADPH] ratio (Sato et al. 1995, Bergman et al. 2010).
Oxaloacetate by Malate Dehydrogenase (Guynn et al. 1973)
Where pH = 7.2, [H+] = 6.31×10⁻⁸M
ΔG of ATP hydrolysis (Bergman et al. 2010, Williamson et al. 1967)
Where kBHBDH = 4.93×10⁻⁹M, kSDH = 171.84, pH = 7.2, [H+] = 6.31×10⁻⁸M, ΔG° = −81.05kJ/mol
Free [NADP+]/[NADPH] (Londesborough & Dalziel 1968)
Thus
Where [CO2] = [HCO3−] × [H+]/(10−6.1) = 1.986mM at pH 7.2 with [HCO3−] = 25mM via Henderson Hasselbach
Free [NAD+]/[NADH]-cytosolic (Williamson et al. 1967)
Rearranged
Free [NAD+]/[NADH]-mitochondrial (Williamson et al. 1967)
Statistics
All data values are given as mean ± SEM. Statistical differences were determined by Student’s t test in GraphPad Prism 6. In all cases, statistical significance was set at P ≤ 0.05.
Results
Affect of diet on animal body weight
Animal body weights fluctuated during the study but appeared to reach a plateau for both dietary groups at about 12 months (Kashiwaya et al., 2013). KE-fed animals maintained weight throughout the study but weighed less than CON-fed mice. Mean body weights at 14 months of age were 40.3 +/− 2.1 and 37.0 +/− 1.2 g for the CON-fed and KE-fed mice, respectively. At the time of diet initiation the mean body weight for all animals was 37.3 +/− 1.1. At 16.5 months, mean body weight of mice in the KE-fed group was between 9–10% lower than that of controls (41.5 +/− 2.5 vs 37.1 +/− 0.5) (Kashiwaya et al., 2013).”
Tissue analysis, blood glucose and ketone levels and 24-s-cholesterol
Altogether, 24 hippocampal and cortical tissue samples were available and evaluated in these analyses (KE diet = 12) (CON diet n=12). Because perchloric acid extraction destroys protein the samples were apportioned into groups, one for protein analysis (n = 5 or 6 for treatment and control subjects) and for analysis of glycolytic phosphorylated intermediates, TCA cycle acids, amino acids, acetyl-coA and 4-hydroxynonenal (4-HNE) (n = 5 or 6, in each treatment an control group).
Blood glucose, β-hydroxybutyrate (β-HB), and 24-S-hydroxycholesterol concentrations
There was no difference in the blood glucose concentrations between groups (CON: 155 ± 8.5 and KE: 152 ± 9.0 mg/dl). Blood β-HB concentrations were significantly greater in the KE-fed group (CON: 0.14 mM ± 0.01 vs KE: 0.72 ± 0.13 mM; p<0.05). The Glucose Ketone Index (GKI) as described in Meidenbauer et al. is the ratio of the concentrations of blood glucose to that of blood β-hydroxybutyrate. The GKI for the CON-fed group was 72.0 +/− 25.1 and for the KE-fed group was 19.4 +/− 14.4, p < 0.001 and suggests that KE-fed mice are in a state of therapeutic ketosis (Meidenbauer et al. 2015). The plasma concentration of 24-S-hydroxycholesterol, a biomarker of brain cholesterol turnover and modulator of long term potentiation, was greater in the KE-fed mice, (CON: 0.135 ± 0.016 vs KE: 0.212 ± 0.018 nmol/mL; n = 8, p<0.05). The concentrations of 24-S-hydroxycholesterol from the combined brain regions (hippocampus and cortex) from KE-fed and CON-fed mice were analyzed. The concentrations of this metabolite in KE-fed mice compared with CON-fed animals were CON: 33.0 +/− 3.7 vs KE: 40.9 +/− 5.0 pMol/mg tissue, n=10, p <.06
Glycolytic intermediates
In the cortex of the KE-fed mice the concentration of G-6-P was marginally lower (−10%) compared to that in controls (CON: 0.064 ± 0.002 vs KE: 0.058 ± 0.002 μmol/g; p < 0.05) whereas the concentration of DHAP was notably lower (CON: 0.080 ± 0.012 vs KE: 0.052 ± 0.005 μmol/g; p < 0.05) (Figure 1A). There were no differences in the concentrations of the other glycolytic intermediates, 3PG, PEP or pyruvate between the two groups (Figure 1A). Interestingly, the ratio of lactate to pyruvate was lower (p < 0.05) in the cortex of KE-fed mice (16.2 ± 3.0) compared with mice maintained on the CON diet (25.7 ± 3.2) and this appeared to be the result of the higher concentration of pyruvate in the KE-fed group compared to controls (CON: 0.057 ± 0.014 vs KE: 0.087± 0.015 μmol/g) rather than lactate (CON: 1.35 ± 0.20 vs KE: 1.31± 0.10 μmol/g) (see Table 1). In the hippocampi of control mice there were substantially lower concentrations of G-6-P, DHAP, 3PG and PEP compared to the concentrations of these metabolites in the cortex. In KE-fed mice the concentrations of these intermediates were similar in both the cortex and hippocampus (Figure 1A and B). Further, in the hippocampus of mice maintained on the CON versus KE diet the concentrations of the glycolytic intermediates were significantly lower G-6-P (−39%), DHAP (−29%), 3PG (−34%), PEP (−34%) and pyruvate (−34%) in mice maintained on the CON diet.
Figure 1.

Effect of KE diet on the concentrations of glycolytic and TCA cycle intermediates. These metabolites were measured in the cortex (A, C) and hippocampus (B, D) of 3XTgAD mice fed ketone ester (KE) or control (CON) diets using isotope dilution mass-spectrometry. Oxaloacetate (OAA) which was calculated as shown in the Methods section. Values plotted are average± SEM, n=5–6, * indicates significant at p < 0.05 in Students t-test.
Table 1.
Effect of KE diet on the cytosolic and mitochondrial redox potentials and the concentrations of metabolites used to determine them. The metabolites lactate, pyruvate, β-hydroxybutyrate, acetoacetate, isocitrate and α-ketoglutarate were used for these determinations in the cortex and hippocampus of mice fed either a control diet (CON) or a diet containing and ester of β-hydroxybutyrate (KE). Quantities in μmol/g tissue are listed as average ± SEM, n=5–6, * indicates significant at p < 0.05 in Students t-test.
| Cortex | Hippocampus | |||
|---|---|---|---|---|
| CON | KE | CON | KE | |
| Lactate (μMol/g) | 1.31 ± 0.144 | 1.35 ± 0.07 | 1.80 ± 0.21 | 1.58 ± 0.07 |
| Pyruvate (μMol/g) | 0.057 ± 0.097 | 0.087 ± 0.011 | 0.076 ± 0.007 | 0.116 ± 0.016* |
| cyto NAD/NADH | 230 ± 21 | 388 ± 58* | 250 ± 23 | 411 ± 48* |
| β-hydroxybutyrate (μMol/g) | 0.112 ± 0.008 | 0.103 ± 0.001 | 0.116 ± 0.027 | 0.182 ± 0.011* |
| Acetoacetate (μMol/g) | 0.034 ± 0.003 | 0.038 ± 0.005 | 0.084 ± 0.008 | 0.048 ± 0.008* |
| mito NAD/NADH | 3.97 ± 0.48 | 4.74 ± 0.60 | 9.27 ± 0.84 | 3.44 ± 0.64* |
| iso-citrate (μMol/g) | 0.0045 ± 0.0009 | 0.0072 ± 0.0011* | 0.0087 ± 0.0039 | 0.0139 ± 0.0020* |
| α-ketoglutarate (μMol/g) | 0.073 ± 0.013 | 0.052 ± 0.004 | 0.132 ± 0.022 | 0.280 ± 0.040* |
| NADP+/NADPH | 0.034 ± 0.008 | 0.014 ± 0.003* | 0.032 ± 0.008 | 0.039 ± 0.008 |
| ΔGATP Hydrolysis (kJ/mol) | −62.3 ± 0.5 | −61.6 ± 0.2 | −59.3 ± 0.4 | −64.3 ± 0.5* |
TCA cycle intermediates
In the cortex of KE-fed mice only citrate was significantly higher (CON: 0.089 ± 0.010 vs KE: 1.14 ± 0.008 μmol/g; p < 0.05). The other TCA cycle intermediates, isocitrate, α-ketoglutarate, succinate, fumarate and malate were not different (Figure 1C). Notably, in the hippocampus of KE-fed mice the concentrations of citrate (+100%), isocitrate (+60%), α-ketoglutarate (+112%), succinate (+80%), fumarate (+127%) and acetyl CoA (+103%) were all greater compared to animals on the CON diet (Figure 1D).
Amino acids
In the cortex of mice maintained on either diet, the concentrations of the amino acids, glutamate (CON: 7.0 ± 0.6 vs KE: 6.4 ± 0.3 μmol/g), aspartate (CON: 3.9 ± 0.2 vs KE: 4.1 ± 0.8 μmol/g) n-acetyl aspartate (CON: 6.5 ± 0.8 vs KE: 5.9 ± 0.5 μmol/g), GABA (CON: 0.19 ± 0.03 vs KE: 0.24 ± 0.41 μmol/g) were similar (Figure 2A). Conversely, in the hippocampus of mice fed the KE diet there were significantly higher concentrations of both aspartate (+63%, CON: 2.13 ± 0.22 vs KE: 3.48 ± 0.52 μmol/g; p < 0.05) and n-acetyl aspartate (+59%, CON: 8.42 ± 0.44 vs KE: 13.01 ± 1.08 μmol/g; p < 0.05) (Figure 2B). Low levels of n-acetyl-aspartate in the hippocampus have been linked to higher anxiety levels and depression in humans (Matthew S. J. et al., 2008). Therefore, we utilized previously determined data from the same 3xTgAD mice obtained from the anxiolytic paradigm phase I trial using the elevated platform plus sign-shaped maze described in Kashiwaya et al., 2013 and correlated the percent of time spent by individual mice in each of the two dietary groups from those outcomes to the concentrations hippocampal n-acetyl-aspartate (Figure 3). Animals that remained for a greater percentage of time in the open arm portions of the maze compared to the closed arm or center are presumed to exhibit lower general anxiety. The KE-fed mice spent significantly more time in the open arm portions of the maze compared with control diet-fed mice as reported (Kashiwaya et al., 2013). We now report strong positive correlations in the amount of hippocampal n-acetyl-aspartate to the percentage of time that individual animals remained in the open arm portion of the maze from KE-Fed (R = 0.862) and control-fed (R = 0.789) mice and conversely negative correlations in hippocampal n-acetyl-aspartate to the percent of time that mice remained in the closed arm and center portions of the maze (KE-fed, R = −0.769) (control-fed, R = −0.805). The ketone ester diet significantly increased the concentration of n-acetyl-aspartate in the hippocampus and KE-fed animals were much more likely to remain in the open arm portion of the maze (figure 3). The concentration of glutamate was similar in the hippocampi of mice maintained on either diet (CON: 9.2 ± 1.1 vs KE: 10.5 ± 0.9 μmol/g). Interestingly, hippocampal GABA was lower in the animals fed the KE diet compared to controls (CON: 0.32 ± 0.05 vs KE: 0.17 ± 0.03 μmol/g; p < 0.05). Recent work has shown that an aberrant increase in GABA levels in AD-affected brain regions is associated with Aβ activation of astrocytes and other glial cells (Jo et al. 2014). In conjunction with the lower GABA levels observed in KE-fed mice we observed that the amount of the activated astrocyte marker glial fibrial acid protein (GFAP) was significantly lower in hippocampal lysates (−27%, N=5–6, p < 0.05) from KE-fed animals compared to mice fed the CON mice (Figure 2C).
Figure 2.

Effect of KE diet on the concentrations of amino acids; glutamate, aspartate, n-acetyl aspartate, and γ-amino butyric acid (GABA). These amino acids were quantified in cortex (A) and hippocampus (B) from 3XTgAD mice fed KE or CON diets using isotope dilution mass-spectrometry. GFAP, a marker for activated astrocytes, was determined in the hippocampus (C) using western blotting, quantifications were made as a fluorescence intensity ratio between the GFAP and actin bands. Values plotted are average± SEM, n=5–6, * indicates significant at p < 0.05 in Students t-test.
Figure 3.

Linear correlation diagrams that depict a relationship between hippocampal n-acetyl aspartate (NAA) from 3xTgAD mice that were maintained on either a ketone ester diet (n=7) or control diet (n=7) versus the percent time spent that each animal remained in either the closed arm and center (A) or the open arm (B) areas of an elevated (60 cm from floor) plus sign-shaped platform maze from phase I trials (Kashiwaya et al., 2013). There were strong correlations between the concentrations of hippocampal NAA and the percent time that animals spent in either areas of the maze. Control diet-fed mice had lower concentrations of hippocampal NAA and remained for a greater percentage of time in the closed arms whereas mice fed the ketone-ester diet preferred the open area portions of the maze.
Cytosolic and mitochondrial redox states, nicotinamide adenine dinucleotide pools, and the ΔG of ATP hydrolysis
The cytosolic free [NAD+]/[NADH] ratio was determined from the ratio of the concentration of the glycolytic intermediates, lactate to that of pyruvate. Further details of these calculations are outlined in previous reports (Sato et al. 1995, Bergman et al. 2010, Kashiwaya et al. 2010). The concentrations of these intermediates in both the cortex and hippocampus were comparable to freeze-blown brain tissue which indicated tissue handling procedures preserved the sample integrity (Sato et al. 1995, Bergman et al. 2010, Kashiwaya et al. 2010). In the cortex and hippocampi of KE-fed mice the cytoplasm was significantly more oxidized (an approximate increase of 65% in free [NAD+]/[NADH]) compared to controls and the shift toward oxidation was primarily due to an increase in the concentration of pyruvate (Table 1). Notably, the cytosol redox potential in both the hippocampus and cortex was similar within each dietary group.
The mitochondrial free [NAD+]/[NADH] ratios were determined using the ratio of the concentrations of β-hydroxybutyrate (βHB) to acetoacetate (AcAc), a near equilibrium reaction catalyzed by β-HB dehydrogenase (Bergman et al. 2010, Williamson et al. 1967). In the cortex of mice maintained on either diet the mitochondrial free [NAD+]/[NADH] ratios were similar (Table 1). Moreover, KE-fed mice had similar redox states in the hippocampus and cortex. Notably, the mitochondrial [NAD+]/[NADH] redox state in the hippocampus of mice fed the CON diet was highly oxidized (+127%) compared to KE-fed mice (Table 1).
The free [NADP+]/[NADPH] ratio was determined using the ratio of the concentrations of isocitrate to α-ketoglutarate (αKG) a reaction catalyzed by isocitrate dehydrogenase (Bergman et al. 2010, Veech et al. 1969). In the cortex of KE-fed mice, the free [NADP+]/[NADPH] ratio was significantly reduced, signifying an increase in availability of NADPH (Table 1). Although, the hippocampal concentrations of isocitrate and αKG were significantly greater in KE-fed mice, the free [NADP+]/[NADPH] redox states were no different.
The energy associated with the ΔG of ATP hydrolysis is the energy released through the cleavage of the terminal phosphate bond of ATP. This value, in kJ/mol, was determined using the difference in energy states between the mitochondrial free [NAD+]/[NADH] ratio and the Q/QH2 redox state (Bergman et al. 2010, Sato et al. 1995). The Q/QH2 redox state was determined from the ratio of concentration of succinate to that of fumarate, a reaction catalyzed by succinate dehydrogenase (Bergman et al. 2010). Diet had no effect on the ΔG of ATP hydrolysis in the cortex (CON: −62.3 ± 0.5 vs KE: −61.6 ± 0.2 kJ/mol) similar to observations in healthy brain tissue (Kashiwaya et al. 2010). In the hippocampus, the ΔG of ATP hydrolysis in KE-fed mice was substantially more energetic compared to control-fed mice (CON: −59.3 ± 0.4 vs KE: −64.3 ± 0.5 kJ/mol; p < 0.05). This notable increase in the energy of ATP hydrolysis associated with ketone metabolism in the compromised brain region is vital to restoring cellular work functions. This increase in the energy of hydrolysis was similar in magnitude to another instance where ketone body metabolism resulted in a more energetic ΔG of ATP hydrolysis and restored work output in a model of the failing heart (Sato et al. 1995).
Effects of ketone metabolism on lipid and protein oxidation
One consequence of the metabolism of ketones is the reduction of the redox potential of the NADP system (Veech et al. 1969) which controls the reduction of glutathione, which has been shown to be oxidized in this mouse strain (Ghosh et al. 2014, Veech 2004). We observed lower amounts of protein carbonylation (−19%, p < 0.05) as determined by di-nitrophenyl-hydrazine (DNP) reactivity and 4-HNE (3 fold decrease, p < 0.05) in the hippocampus of mice fed the KE diet compared to CON-fed mice (Figure 4). Protein carbonylation and lipid peroxidation result from the attack of hydroxyl radicals on proteins or membrane unsaturated fatty acids, respectively. Interestingly, mice maintained on either diet had similar levels of protein carbonylation and 4-HNE formation in the cortex which were also comparable to amounts observed in the hippocampus of KE-fed mice suggesting that ketone metabolism was highly effective in reducing free radical damage in regions prone to ROS injury.
Figure 4.

Effect of KE diet on protein carbonylation and 4-hydroxynonenal (4-HNE) concentrations in cortex and the hippocampus from 3XTgAD mice fed KE or CON diets. DNP derivatization of protein carbonyl groups were detected using western blotting. (A) The representative blot of the diet effect on DNP staining in the hippocampus includes an underivatized lane for background quantification. (B) shows the quantification of these blots relative to control levels. (C) 4-HNE was quantified in the cortex and hippocampus using isotope dilution mass-spectrometry. Values plotted are average± SEM, n=5–6, * indicates significant at p < 0.05 in Students t-test.
Effect of ketone metabolism on secretase protein levels
Hippocampal regions from these KE-fed mice were previously shown to have lower levels of Aβ plaques (Kashiwaya et al. 2013). The lower amount of amyloid accumulation may, in part, be due to changes in the metabolism of the amyloid precursor protein (APP) through an alteration of the activity or amount of secretase enzymes, ADAM10 (α-secretase) or BACE1 (β-secretase). Protein levels of these enzymes were determined using western blot of hippocampal lysates and found to be significantly altered, where ADAM10 was 21% higher (p < 0.05), BACE1 was 23% lower (p < 0.05) in KE-fed animals compared to controls. No significant changes were observed in cortex samples where the level of Aβ plaque accumulation was no different (Kashiwaya et al., 2013).
Discussion
PET studies using a radio-labeled glucose analogue (e.g. fDG) have consistently demonstrated a low rate of glucose metabolism (between 20–30% lower) in brain regions involved in processing memory (e.g. the hippocampus, posterior cingulate, temporal, and parietal lobes) in humans with AD (Kapogiannis & Mattson 2011, Cunnane et al. 2011). In a transgenic mouse model of AD (3xTgAD) Ding and coworkers observed a lower uptake of fDG and an elevation of the neuronal monocarboxylate transporter, MCT 2, in the aged hippocampus (Ding et al. 2013b). Further, Yao and coworkers found an increase in ketone metabolizing enzymes; succinyl-CoA:3-ketoacid CoA transferase (SCOT) and acetyl-CoA acetyltransferase 1 (ACAT1) expression in transgenic mice maintained on a diet intended to induce mild ketosis (Yao et al. 2009). Interestingly, using isotopically labeled β-hydroxybutyrate hibernating rodents have been shown to increase their brain utilization of ketones as a preferred energy substrate through an upregulation of MCT 1 which continues into the awakened state (Andrews et al. 2009). Insulin resistance, decreased cerebral blood flow, inhibition of GLUT transporters, inhibition of glycolytic enzymes and amyloid-stimulated PDH phosphorylation all contribute to decreased glucose metabolism in clinical AD and transgenic models (Prins 2008, Frackowiak et al. 1981, Cunnane et al. 2011, Kapogiannis & Mattson 2011). Since, our study did not include a wild type control group the concentrations of brain metabolites pertain only to the aged transgenic mouse model used here. Furthermore, the cytosolic and mitochondrial redox potentials derived from these concentrations may not pertain to other mouse strains.
Low glucose metabolism results in the oxidation of NAD and NADP redox pools (Ghosh et al. 2012), and ultimately a decreased ability to perform essential functions while limiting the buildup of damaged biomolecules and organelles. To our knowledge this is the first study to examine the effects of a specific and direct elevation of circulating β-hydroxybutyrate on a range of neurochemicals in a mouse model of AD and the first fully detailed report to encompass a wide range of metabolites from both the glycolytic and TCA cycle pathways, some of which are used to determine the cellular energetic and redox potentials, and also derived neurotransmitters and amino acids, as well as measurements of correlative protein and lipid damage through their ROS products, from the hippocampus, a region, highly affected by accumulation of Aβ and p-Tau as compared to the cortex using a KE diet which sustained high blood ketone levels. Here we report that a dietary KE corrects several key markers of an energy deficit, such as, reducing the mitochondrial free [NAD+]/[NADH] pool and increasing the ΔG of ATP hydrolysis (Table 1) predominantly in the hippocampus. Many of the positive outcomes presented here have been associated with ketone metabolism in the hippocampus, where it was previously reported that hippocampal regions from the same KE-fed mice had lower numbers of immuno-reactive amyloid cells compared to control-fed animals (Kashiwaya et al., 2013) Also, hippocampal regions from these same animals contained far greater numbers of immuno-reactive p-Tau cells compared to the cortex from mice on either diet (Kashiwaya et al., 2013). The incorporation of a stable isotopically labeled ketone ester into a study design using this animal model of Alzheimer’s disease would help clarify to what extent different affected brain regions utilize ketones to meet their energy demands and for synthetic purposes, such as the synthesis of amino acids and lipids. The tissue used in these analyses were taken from euthanized mice and was rapidly frozen diminishing the effects of anoxia as observed in the lactate to pyruvate ratio which accorded with freeze blown brain tissue, a procedure which preserves the in vivo state (Kashiwaya et al. 2010).
Although a number of studies have shown decreased uptake of fDG in AD patients or in animals models of AD there were no substantial differences in the concentration of G-6-P in the cortex in mice on either diet (CON: 0.064 or KE: 0.058 μMol/g tissue; Figure 1A). This concurs with a previous dietary intervention study in healthy rats where a KE-supplemented diet had no effect on the concentration of G-6-P in whole brains (Kashiwaya et al. 2010). In contrast, we show that higher concentrations of β-HB were observed in the hippocampus of KE-fed 3xTgAD mice (Table 1), there were also elevations in several glycolytic intermediates including G-6-P, DHAP, 3PG, PEP, pyruvate and calculated oxaloacetate (Figure 1B, D). The higher levels of β-HB in this region may be due to increased transport via the MCT2, which has been shown to increase in the hippocampus of older 3XTgAD mice (Ding et al. 2013a) and the elevated blood ketones in mice on the KE diet. There were also significantly elevated concentrations of the TCA cycle metabolites, citrate, isocitrate, α-ketoglutarate, succinate and fumarate and acetyl-coA in the hippocampus of KE-fed mice (Figure 1D). The increase concentrations of TCA cycle intermediates observed in the hippocampus of KE-fed mice may be due to an increase in mitochondrial function or possibly to an increase in mitochondrial biogenesis. Previously, we observed that after 30 days pair-feeding a liquid KE-diet to C57BL/6J mice that animals had increased numbers of mitochondria and higher levels of mitochondrial biogenesis-regulating proteins in the interscapular brown adipose tissue compared with controls (Srivastava, S.et al., FASB J. 2012). Elevations in the concentrations of hippocampal glycolytic intermediates may have resulted from either a dis-inhibition of glycolysis or potentially through an increased flow of carbon substrates and reducing equivalents from the mitochondrial metabolism of ketones into the cytosol via malate or citrate transport toward anapleuritic pathways. This latter suggestion is supported by the observation of the relative oxidation of the cytosolic free [NAD+]/[NADH] pool in KE-fed mice (Table 1), indicating a reversal of NAD-linked cytosolic enzymes such as Glyceraldehyde-3-phosphate dehydrogenase (GAPDH). Additionally, the increase in the apparent concentration of cytosolic oxaloacetate in the hippocampus of KE-fed mice (+53%) is consistent with the hypothesis that citrate and malate are being metabolized in the cytosol thereby increasing the levels of oxaloacetate, a product of both ATP-citrate lyase and malate dehydrogenase. Oxaloacetate is then utilized by phospho-enol-pyruvate carboxykinase (PEPCK) to produce phosphoenol-pyruvate (PEP) which was 50% greater in KE-fed mice followed by increases in 3PG, DHAP and G-6-P (Figure 1B). These cytosolic metabolites play key roles in maintaining cellular homeostasis in the hippocampus of KE-fed mice, including signaling cascades, generating cytosolic NADPH and synthesis of nucleotides.
We’ve shown that in KE-fed mice the mitochondrial free [NAD+]/[NADH] redox state becomes more reduced, favoring NADH (Table 1). A broader examination of these results in light of those of Ghosh et al. (2012) demonstrate that the metabolism of ketones are in essence rescuing a highly oxidized mitochondrial redox state. Through the rescue of the redox potential the cell is more able to prevent and/or repair oxidative damage leading to decreases in both lipid and protein oxidation products observed notably in hippocampal tissue compared to cortex from KE-fed mice (Figure 4). The free [NADP+]/[NADPH] redox couple has the single largest electrochemical potential in the cell at −0.42V. This in turn drives the reduction of glutathione and the ascorbate and tocopherol couples toward their respective reduced states. While the [NADP+]/]NADPH] ratio in the hippocampus was not significantly altered by ketone metabolism (Table 1) we observed decreased oxidative damage (Figure 4A–C) suggesting NADPH utilization as well as a demonstrated decrease in amyloid plaques (Kashiwaya et al. 2013). Further, changes in NAD and Q redox states favoring a reduction in NAD and oxidation of Q observed here suggest that ketone metabolism also decreased damaging ROS production by lowering the amount of the semi-oxidized Q-semiquinone species, a major source of mitochondrial superoxide (Chance et al. 1979).
Changes in cellular redox states and increases in oxidative damage can stimulate the pathological amyloid precursor protein (APP) metabolism toward Aβ through induction of BACE1/β-secretase (Kwak et al. 2011). The 3xTgAD mouse produces high levels of APP and its metabolism depends on a family of proteases referred to as α, β and γ secretases. The two major breakdown pathways are through either α-secretase or β/γ secretases. The latter pathway is associated with toxic Aβ aggregation and disease progression, whereas the former is associated with neuronal protection and APP disposal (Mattson 2004). Here, we have shown that mice maintained on the KE diet had increased α-but lower β-secretase in the hippocampus (Figure 5), which concurs with previous findings in the same animals of lower Aβ accumulation (Kashiwaya et al., 2013) and with previous work in female 3xTgAD mice maintained on a 2-deoxyglucose diet intended to increase blood ketones (Yao et al. 2011).
Figure 5.

Effect of KE diet on the amyloid metabolizing enzymes ADAM10 (α-secretase) and BACE1 (β-secretase protein levels. Levels of ADAM10 (A) and BACE1 (B) were measured using Western Blot in hippocampus from 3XTgAD mice fed KE or CON diets, using fluorescence intensity ratios between the target band and actin. Representative blots are shown. Values plotted are average ± SEM, n=4–6, * indicates significant P<0.05 in Students t-test.
Membrane cholesterol homeostasis is maintained in the brain by in-situ biosynthesis utilizing NADPH with its removal as 24-S-hydroxycholesterol through an oxidation by CYP36A1. Among several brain diseases and pathologies, human subjects with AD and transgenic animals engineered to accumulate phosphorylated-Tau, brain membrane disequilibrium results in lower plasma concentrations of 24-S-hydroxycholesterol compared to normal controls and to wild type mice, respectively (Bretillon et al. 2000, Burlot et al. 2015). Here, we demonstrate that mice maintained on the KE diet had nearly a 2-fold higher concentration of 24-S-hydroxycholesterol in the blood. The concentrations of 24-S-hydroxycholesterol from the combined brain regions (hippocampus and cortex) from KE-fed and CON-fed mice were also analyzed. The concentrations of this metabolite appeared to be somewhat elevated in KE-fed animals (CON: 33.0 +/− 3.7 vs KE; 40.9 +/− 5.0 pMol/mg tissue, n=10, p <.06); however, this did not reach the level of significance and therefore leaves open the question whether the brain metabolism of ketones is capable of sustaining membrane homeostasis through its more reduced cellular redox potential (Table 1) as well as supplying the activated carbon substrates (Figure 1D) required for lipid biosynthesis. In a separate analysis for CYP36A1 we found no differences in the level of the enzyme in the hippocampus between groups (data not shown).
Feeding the KE diet to 3xTgAD mice did not have any significant effect on amino acid concentrations in the cortex (Figure 2A). Previously, we’ve shown that maintaining rats on a KE-supplemented or high fat diet for 14 days resulted in a decrease in the concentrations of whole brain glutamate and GABA compared to control-fed animals (Kashiwaya et al. 2010). However, in the hippocampus of KE-fed 3xTgAD mice there were significantly lower levels of GABA, the major inhibitory neurotransmitter which corresponded to lower levels of the astrocytic glial fibrillary acidic protein (GFAP). Lower levels of astrocytic-released GABA has been associated with improved long-term potentiation in the hippocampus and better memory outcome in an AD mouse model (Jo et al. 2014). Lower GABA levels in the hippocampi of KE-fed mice here may account, in part, for improved memory and greater exploratory behavior outcome compared to controls as reported previously (Kashiwaya et al., 2013). Whether the KE diet would enhance cognitive performance in non-transgenic mice strains is unknown. However, rats maintained on a KE-diet showed improve cognitive function in tests using an eight arm radial maze compared to animals on other diets (Murray et al. 2016). Also, in the hippocampus there were higher concentrations of both aspartate and n-acetyl aspartate in KE-fed mice. The higher concentrations of the energy-linked n-acetyl aspartate in the hippocampus which follow from the increased availability of the TCA cycle derived acetyl-coA (Figure 1) and carbon units derived from aspartate via oxaloacetate (Figure 2) may also shed light on the potent anxiolytic effect that the KE diet had reducing anxiety in mice which stayed in the open arm portions of the elevated plus maze for notably longer periods of time (figure 3).
Due to potential increases in the uptake of ketones in the hippocampus of aging 3xTgAD mice (Ding et al. 2013b, Yao et al. 2009), attempts have been made to treat AD using ketogenic diets that are non-specific in that they elevate a range of lipids and other nutrients in the fat consumed in humans (Krikorian et al. 2012) and in animal models (Brownlow et al. 2013, Beckett et al. 2013). Due to variability in diet formulation, age of animals, and genetic strain the results have been somewhat mixed. Two studies in mice independent of genotype demonstrated the significance of ketogenic diets in producing increased grip strength but no apparent change in aberrant protein accumulation nor memory effect. However, we noted previously moderate positive changes in memory, substantial reduction in anxiety, and increased exploratory behavior in older 3xTgAD mice maintained on the KE diet (Kashiwaya et al. 2013). Additionally, these changes concur with improved hippocampal cellular energetics, a more favorable redox potential, decreased ROS damage, and lower GABA levels reported here. In order to produce comparable blood ketone concentrations, Brownlow and co-workers virtually eliminated dietary carbohydrate which elicited a decrease in blood glucose in two alternative mouse models of AD. Unlike either of those models the 3xTgAD murine strain has been shown to have increased capacity for ketone metabolism (Yao et al. 2011, Ding et al. 2013a) and responded to ketone utilization with improved amyloid processing (Yao et al. 2011). The ketone ester has had notable success in an APOe4-positive Alzheimer’s patient (Newport et al. 2015). There is no apparent toxicity of the KE even when elevating blood ketones to 5–6 mM with a single dose or in repeated dosing over 5 days (Clarke et al. 2012). Here, we’ve shown that KE supplementation in 3xTgAD mice increased plasma β-HB by 5-fold and corrected energy deficiencies in the hippocampus which was substantiated by improved biomarkers and reduced oxidative damage. KE supplementation offers a potential therapeutic treatment of the clinical disease as it addresses the fundamental metabolic deficits in both humans and transgenic animals.
Acknowledgments
This work was funded by the Intramural Research Programs of the National Institute on Alcohol Abuse and Alcoholism and the National Institute on Aging (NIA). R.L. Veech may receive royalties from patents owned by The National Institutes of Health, Oxford University and TdeltaS Ltd., a University of Oxford company, established to commercialize the ketone ester. We gratefully acknowledge the technical assistance of Ruiqian Wan, National Institute on Aging.
List of Abbreviations
- 3PG
3-Phospho-glycerate
- 4-HNE
4-hydroxynonenal
- Aβ
Beta-amyloid
- AD
Alzheimer’s disease
- ADAM10
A disintegrin and metalloproteinase domain-containing protein 10
- BACE1
Beta secretase 1
- β-HB
Beta-hydroxybutyrate
- DHAP
Dihydroxyacetone phosphate
- fDG
Fluorodeoxyglucose
- GFAP
Glial fibriallary acid protein
- G-6-P
Glucose 6-phosphate
- KE
Ketone ester or (R)-((R)-3-hydroxybutyl) 3-hydroxybutanoate
- PCA
Perchloric acid
- PEP
Phosphoenolpyruvate
- Q
Coenzyme Q or Ubiquinon
- TCA
Tricarboxylic Acid
Footnotes
human subjects: No
If yes: Informed consent & ethics approval achieved:
=> if yes, please ensure that the info “Informed consent was achieved for all subjects, and the experiments were approved by the local ethics committee.” is included in the Methods.
ARRIVE guidelines have been followed:
Yes
=> if No, skip complete sentence
=> if Yes, insert “All experiments were conducted in compliance with the ARRIVE guidelines.”
Conflicts of interest: RL Veech may receive royalties from potential commercialization of the ester => if ‘none’, insert “The authors have no conflict of interest to declare.”
=> otherwise insert info unless it is already included
References
- Andrews MT, Russeth KP, Drewes LR, Henry PG. Adaptive mechanisms regulate preferred utilization of ketones in the heart and brain of a hibernating mammal during arousal from torpor. American journal of physiology. Regulatory, integrative and comparative physiology. 2009;296:R383–393. doi: 10.1152/ajpregu.90795.2008. [DOI] [PMC free article] [PubMed] [Google Scholar]
- Beckett TL, Studzinski CM, Keller JN, Paul Murphy M, Niedowicz DM. A ketogenic diet improves motor performance but does not affect beta-amyloid levels in a mouse model of Alzheimer’s disease. Brain research. 2013;1505:61–67. doi: 10.1016/j.brainres.2013.01.046. [DOI] [PMC free article] [PubMed] [Google Scholar]
- Bergman C, Kashiwaya Y, Veech RL. The effect of pH and free Mg2+ on ATP linked enzymes and the calculation of Gibbs free energy of ATP hydrolysis. The journal of physical chemistry. B. 2010;114:16137–16146. doi: 10.1021/jp105723r. [DOI] [PubMed] [Google Scholar]
- Bretillon L, Siden A, Wahlund LO, et al. Plasma levels of 24S-hydroxycholesterol in patients with neurological diseases. Neuroscience letters. 2000;293:87–90. doi: 10.1016/s0304-3940(00)01466-x. [DOI] [PubMed] [Google Scholar]
- Brownlow ML, Benner L, D’Agostino D, Gordon MN, Morgan D. Ketogenic diet improves motor performance but not cognition in two mouse models of Alzheimer’s pathology. PloS one. 2013;8:e75713. doi: 10.1371/journal.pone.0075713. [DOI] [PMC free article] [PubMed] [Google Scholar]
- Burlot MA, Braudeau J, Michaelsen-Preusse K, et al. Cholesterol 24-hydroxylase defect is implicated in memory impairments associated with Alzheimer-like Tau pathology. Human molecular genetics. 2015;24:5965–5976. doi: 10.1093/hmg/ddv268. [DOI] [PubMed] [Google Scholar]
- Chance B, Sies H, Boveris A. Hydroperoxide metabolism in mammalian organs. Physiological reviews. 1979;59:527–605. doi: 10.1152/physrev.1979.59.3.527. [DOI] [PubMed] [Google Scholar]
- Clarke K, Tchabanenko K, Pawlosky R, et al. Kinetics, safety and tolerability of (R)-3-hydroxybutyl (R)-3-hydroxybutyrate in healthy adult subjects. Regulatory toxicology and pharmacology: RTP. 2012;63:401–408. doi: 10.1016/j.yrtph.2012.04.008. [DOI] [PMC free article] [PubMed] [Google Scholar]
- Cunnane S, Nugent S, Roy M, et al. Brain fuel metabolism, aging, and Alzheimer’s disease. Nutrition. 2011;27:3–20. doi: 10.1016/j.nut.2010.07.021. [DOI] [PMC free article] [PubMed] [Google Scholar]
- de Leon MJ, Ferris SH, George AE, et al. Positron emission tomographic studies of aging and Alzheimer disease. AJNR. American journal of neuroradiology. 1983;4:568–571. [PMC free article] [PubMed] [Google Scholar]
- Ding F, Yao J, Rettberg JR, Chen S, Brinton RD. Early decline in glucose transport and metabolism precedes shift to ketogenic system in female aging and Alzheimer’s mouse brain: implication for bioenergetic intervention. PloS one. 2013a;8:e79977. doi: 10.1371/journal.pone.0079977. [DOI] [PMC free article] [PubMed] [Google Scholar]
- Ding F, Yao J, Zhao L, Mao Z, Chen S, Brinton RD. Ovariectomy induces a shift in fuel availability and metabolism in the hippocampus of the female transgenic model of familial Alzheimer’s. PloS one. 2013b;8:e59825. doi: 10.1371/journal.pone.0059825. [DOI] [PMC free article] [PubMed] [Google Scholar]
- Frackowiak RS, Pozzilli C, Legg NJ, Du Boulay GH, Marshall J, Lenzi GL, Jones T. Regional cerebral oxygen supply and utilization in dementia. A clinical and physiological study with oxygen-15 and positron tomography. Brain: a journal of neurology. 1981;104:753–778. doi: 10.1093/brain/104.4.753. [DOI] [PubMed] [Google Scholar]
- Ghosh D, LeVault KR, Barnett AJ, Brewer GJ. A reversible early oxidized redox state that precedes macromolecular ROS damage in aging nontransgenic and 3xTg-AD mouse neurons. The Journal of neuroscience: the official journal of the Society for Neuroscience. 2012;32:5821–5832. doi: 10.1523/JNEUROSCI.6192-11.2012. [DOI] [PMC free article] [PubMed] [Google Scholar]
- Ghosh D, Levault KR, Brewer GJ. Relative importance of redox buffers GSH and NAD(P)H in age-related neurodegeneration and Alzheimer disease-like mouse neurons. Aging Cell. 2014;13:631–640. doi: 10.1111/acel.12216. [DOI] [PMC free article] [PubMed] [Google Scholar]
- Guynn RW, Gelberg HJ, Veech RL. Equilibrium constants of the malate dehydrogenase, citrate synthase, citrate lyase, and acetyl coenzyme A hydrolysis reactions under physiological conditions. The Journal of biological chemistry. 1973;248:6957–6965. [PubMed] [Google Scholar]
- Jo S, Yarishkin O, Hwang YJ, et al. GABA from reactive astrocytes impairs memory in mouse models of Alzheimer’s disease. Nature medicine. 2014;20:886–896. doi: 10.1038/nm.3639. [DOI] [PMC free article] [PubMed] [Google Scholar]
- Kapogiannis D, Mattson MP. Disrupted energy metabolism and neuronal circuit dysfunction in cognitive impairment and Alzheimer’s disease. The Lancet Neurology. 2011;10:187–198. doi: 10.1016/S1474-4422(10)70277-5. [DOI] [PMC free article] [PubMed] [Google Scholar]
- Kashiwaya Y, Bergman C, Lee JH, et al. A ketone ester diet exhibits anxiolytic and cognition-sparing properties, and lessens amyloid and tau pathologies in a mouse model of Alzheimer’s disease. Neurobiology of aging. 2013;34:1530–1539. doi: 10.1016/j.neurobiolaging.2012.11.023. [DOI] [PMC free article] [PubMed] [Google Scholar]
- Kashiwaya Y, Pawlosky R, Markis W, King MT, Bergman C, Srivastava S, Murray A, Clarke K, Veech RL. A ketone ester diet increases brain malonyl-CoA and Uncoupling proteins 4 and 5 while decreasing food intake in the normal Wistar Rat. The Journal of biological chemistry. 2010;285:25950–25956. doi: 10.1074/jbc.M110.138198. [DOI] [PMC free article] [PubMed] [Google Scholar]
- Kemper MF, Srivastava S, Todd King M, Clarke K, Veech RL, Pawlosky RJ. An Ester of beta-Hydroxybutyrate Regulates Cholesterol Biosynthesis in Rats and a Cholesterol Biomarker in Humans. Lipids. 2015;50:1185–1193. doi: 10.1007/s11745-015-4085-x. [DOI] [PubMed] [Google Scholar]
- Kemper MF, Zhao YZ, Duckles SP, Krause DN. Endogenous ovarian hormones affect mitochondrial efficiency in cerebral endothelium via distinct regulation of PGC-1 isoforms. Journal of cerebral blood flow and metabolism: official journal of the International Society of Cerebral Blood Flow and Metabolism. 2013;33:122–128. doi: 10.1038/jcbfm.2012.159. [DOI] [PMC free article] [PubMed] [Google Scholar]
- Krikorian R, Shidler MD, Dangelo K, Couch SC, Benoit SC, Clegg DJ. Dietary ketosis enhances memory in mild cognitive impairment. Neurobiology of aging. 2012;33:425e419–427. doi: 10.1016/j.neurobiolaging.2010.10.006. [DOI] [PMC free article] [PubMed] [Google Scholar]
- Kwak YD, Wang R, Li JJ, Zhang YW, Xu H, Liao FF. Differential regulation of BACE1 expression by oxidative and nitrosative signals. Molecular neurodegeneration. 2011;6:17. doi: 10.1186/1750-1326-6-17. [DOI] [PMC free article] [PubMed] [Google Scholar]
- Londesborough JC, Dalziel K. The equilibrium constant of the isocitrate dehydrogenase reaction. The Biochemical journal. 1968;110:217–222. doi: 10.1042/bj1100217. [DOI] [PMC free article] [PubMed] [Google Scholar]
- Mattson MP. Pathways towards and away from Alzheimer’s disease. Nature. 2004;430:631–639. doi: 10.1038/nature02621. [DOI] [PMC free article] [PubMed] [Google Scholar]
- Mathew SJ, Price RB, Mao X, Smith ELP, Coplan JD, Charney DS, Shungu DC. Hippocampal n-acetylaspartate concentration and response to Riluzole in generalized anxiety disorder. Biol Psychiatry. 2008;63:891–898. doi: 10.1016/j.biopsych.2007.09.012. [DOI] [PMC free article] [PubMed] [Google Scholar]
- Meidenbauer JJ, Mukherjee P, Seyfried TN. The glucose ketone index calculator: a simple tool to monitor therapeutic efficacy for metabolic management of brain cancer. Nutrition & metabolism. 2015;12:12. doi: 10.1186/s12986-015-0009-2. [DOI] [PMC free article] [PubMed] [Google Scholar]
- Mosconi L, Pupi A, De Leon MJ. Brain glucose hypometabolism and oxidative stress in preclinical Alzheimer’s disease. Annals of the New York Academy of Sciences. 2008;1147:180–195. doi: 10.1196/annals.1427.007. [DOI] [PMC free article] [PubMed] [Google Scholar]
- Murray AJ, Knight NS, Cole MA, et al. Novel ketone diet enhances physical and cognitive performance. FASEB journal: official publication of the Federation of American Societies for Experimental Biology. 2016 doi: 10.1096/fj.201600773R. [DOI] [PMC free article] [PubMed] [Google Scholar]
- Newport MT, VanItallie TB, Kashiwaya Y, King MT, Veech RL. A new way to produce hyperketonemia: use of ketone ester in a case of Alzheimer’s disease. Alzheimer’s & dementia: the journal of the Alzheimer’s Association. 2015;11:99–103. doi: 10.1016/j.jalz.2014.01.006. [DOI] [PMC free article] [PubMed] [Google Scholar]
- Pawlosky RJ, Kashiwaya Y, Srivastava S, King MT, Crutchfield C, Volkow N, Kunos G, Li TK, Veech RL. Alterations in brain glucose utilization accompanying elevations in blood ethanol and acetate concentrations in the rat. Alcoholism, clinical and experimental research. 2010;34:375–381. doi: 10.1111/j.1530-0277.2009.01099.x. [DOI] [PMC free article] [PubMed] [Google Scholar]
- Prins ML. Cerebral metabolic adaptation and ketone metabolism after brain injury. Journal of cerebral blood flow and metabolism: official journal of the International Society of Cerebral Blood Flow and Metabolism. 2008;28:1–16. doi: 10.1038/sj.jcbfm.9600543. [DOI] [PMC free article] [PubMed] [Google Scholar]
- Sato K, Kashiwaya Y, Keon CA, Tsuchiya N, King MT, Radda GK, Chance B, Clarke K, Veech RL. Insulin, ketone bodies, and mitochondrial energy transduction. FASEB journal: official publication of the Federation of American Societies for Experimental Biology. 1995;9:651–658. doi: 10.1096/fasebj.9.8.7768357. [DOI] [PubMed] [Google Scholar]
- Srivastava S, Kashiwaya Y, Chen X, Geiger JD, Pawlosky R, Veech RL. Microwave irradiation decreases ATP, increases free [Mg(2)(+)], and alters in vivo intracellular reactions in rat brain. Journal of neurochemistry. 2012a;123:668–675. doi: 10.1111/jnc.12026. [DOI] [PMC free article] [PubMed] [Google Scholar]
- Srivastava S, Kashiwaya Y, King MT, Baxa U, Tam J, Niu G, Chen X, Clarke K, Veech RL. Mitochondrial biogenesis and increased uncoupling protein 1 in brown adipose tissue of mice fed a ketone ester diet. FASEB journal: official publication of the Federation of American Societies for Experimental Biology. 2012b;26:2351–2362. doi: 10.1096/fj.11-200410. [DOI] [PMC free article] [PubMed] [Google Scholar]
- Veech RL, King MT. Alzheimer’s Disease Causes and Treatment. In: Masino S, editor. Ketogenic Diet and Metabolic therapies. Oxford University Press; USA: 2016. pp. 241–253. [Google Scholar]
- Veech RL. The therapeutic implications of ketone bodies: the effects of ketone bodies in pathological conditions: ketosis, ketogenic diet, redox states, insulin resistance, and mitochondrial metabolism. Prostaglandins, leukotrienes, and essential fatty acids. 2004;70:309–319. doi: 10.1016/j.plefa.2003.09.007. [DOI] [PubMed] [Google Scholar]
- Veech RL, Chance B, Kashiwaya Y, Lardy HA, Cahill GF., Jr Ketone bodies, potential therapeutic uses. IUBMB life. 2001;51:241–247. doi: 10.1080/152165401753311780. [DOI] [PubMed] [Google Scholar]
- Veech RL, Eggleston LV, Krebs HA. The redox state of free nicotinamide-adenine dinucleotide phosphate in the cytoplasm of rat liver. The Biochemical journal. 1969;115:609–619. doi: 10.1042/bj1150609a. [DOI] [PMC free article] [PubMed] [Google Scholar]
- Williamson DH, Lund P, Krebs HA. The redox state of free nicotinamide-adenine dinucleotide in the cytoplasm and mitochondria of rat liver. The Biochemical journal. 1967;103:514–527. doi: 10.1042/bj1030514. [DOI] [PMC free article] [PubMed] [Google Scholar]
- Yao J, Chen S, Mao Z, Cadenas E, Brinton RD. 2-Deoxy-D-glucose treatment induces ketogenesis, sustains mitochondrial function, and reduces pathology in female mouse model of Alzheimer’s disease. PloS one. 2011;6:e21788. doi: 10.1371/journal.pone.0021788. [DOI] [PMC free article] [PubMed] [Google Scholar]
- Yao J, Irwin RW, Zhao L, Nilsen J, Hamilton RT, Brinton RD. Mitochondrial bioenergetic deficit precedes Alzheimer’s pathology in female mouse model of Alzheimer’s disease. Proc Natl Acad Sci U S A. 2009;106:14670–14675. doi: 10.1073/pnas.0903563106. [DOI] [PMC free article] [PubMed] [Google Scholar]