

Abstract
The liver continuously receives antigens from circulation and the gastrointestinal tract. A complex immune regulatory system has evolved in order to both limit inflammation and promote tolerance in the liver. Although in situ immune tolerance mechanisms enable successful gene therapy and liver transplantation, at the same time they facilitate chronic infections by pathogens such as hepatitis viruses. It is, however, poorly understood why hepatocytes infected with hepatitis viruses or transduced with adeno-associated virus (AAV)-based vectors may be rejected by CD8+ T cells several months later. We found that hepatic transfer of limited doses of an AAV-ovalbumin vector rapidly induced antigen-specific CD8+ T cells that only became functionally competent after >2 months. At this time, CD8+ T cells had downregulated negative checkpoint markers, e.g., the programmed death 1 [PD-1] receptor, and upregulated expression of relevant cytokines. At further reduced vector dose, only intrahepatic rather than systemic CD8+ T cell responses occurred, showing identical delay in antigen clearance. In contrast, PD-1-deficient mice rapidly cleared ovalbumin. Interestingly, higher vector dose directed sustained transgene expression without CD8+ T cell responses. Regulatory T cells, IL-10 expression, and Fas-L contributed to high-dose tolerance. Thus, viral vector doses profoundly impact CD8+ T cell responses.
Keywords: CD8+ T cell, liver, hepatitis, gene therapy, adeno-associated virus, tolerance
Graphical Abstract
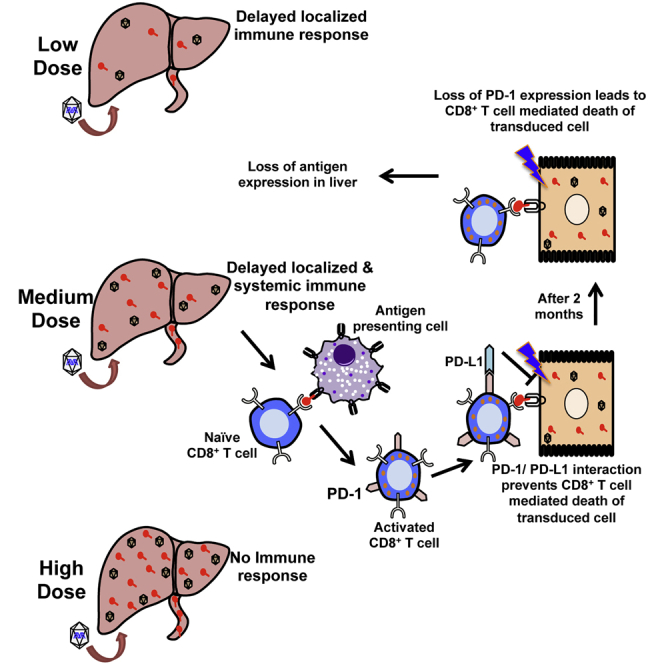
Viral infections of the liver can result in delayed CD8+ T cell responses. This article documents that hepatic gene transfer with adeno-associated viral (AAV) vector at low doses may induce functionally impaired CD8+ T cell responses to the transgene product that acquire functional competence months later upon downregulation of negative checkpoint receptors. In contrast, high vector doses result in tolerance.
Introduction
The liver, the largest internal organ of the body, performs a variety of functions including metabolism, protein synthesis, and detoxification. It is also a critical component of the immune system. Located at the intersection of the portal and systemic circulation, it continuously receives both arterial and portal venous blood and is therefore regularly exposed to a variety of self- and non-self-antigens. The unique repertoire of conventional and non-conventional antigen-presenting cells (APCs) in the liver enables it to simultaneously control immune responses to pathogenic/non-self-antigens and have tolerance to self-antigens or non-pathogenic exogenous food-derived molecules.1, 2, 3 Previously, our lab and others have shown that the liver provides an immune-tolerant environment,4, 5, 6, 7, 8 and therefore could be exploited as the target organ in gene therapy for inherited protein deficiencies, in which the therapeutic protein may represent a neo-antigen such as in hemophilia, metabolic disorders, or lysosomal storage disorders, among others.9 Although a variety of viral and non-viral vectors have been employed for liver-directed gene transfer, recombinant adeno-associated virus (AAV) has emerged as one of the most attractive vectors for this task. Success of these vectors by and large is due to their low immunogenicity, mostly non-integrating genome, high efficiency of in vivo gene transfer, large repertoire of viral capsids with different cell tropism, and ability to transduce non-dividing cells.9 Indeed, results from preclinical and clinical studies of hemophilia emphasize that therapeutic success can be achieved with liver-directed AAV gene transfer.10, 11 Pre-clinical studies show that tolerance induction to an antigen expressed in hepatocytes from an AAV vector relies on programmed cell death of effector cells and induction of CD4+CD25+FoxP3+ regulatory T cells (Tregs), with higher levels of transgene expression inducing more Tregs.4, 6, 12, 13 Intrahepatic IL-10 expression further enforces suppression of CD8+ T cells.14, 15
Although the tolerogenic environment of the liver is favorable in the setting of gene therapy or organ transplantation, it may also provide an opportunity for hepatotropic pathogens such as malaria, hepatitis B virus (HBV), and hepatitis C virus (HCV) to establish a chronic infection. Chronic infections with HBV and HCV result into liver cirrhosis or hepatocellular carcinoma and are the leading cause of liver-related morbidity and mortality.16 In chronic HBV and HCV infections, antigen-specific immune response are often impaired, although the exact mechanisms allowing for persistent infection are unclear.17, 18, 19 Studies have shown that intrahepatic activation of CD8+ T cells by hepatocytes leads to surface expression of inhibitory molecule programmed death 1 (PD-1) on antigen-specific CD8+ T cells, thereby rendering them ineffective.20, 21, 22, 23 Moreover, poor activation of CD4+ T cell help has also been shown to influence the outcome of such infections.19, 23 In addition, the size of the inoculum has been shown to fine-tune the balance between the course of infection and immune response in an adult immune-competent chimpanzee model of HBV, thereby playing an important role in the ultimate outcome of infection.24 At lower inoculum, a CD8+ T cell response may abruptly occur after 2 months and clear the viral infection of the liver. At high inoculum, the immune response is more attenuated, allowing the entire liver to become infected.
Despite the ability to induce tolerance to the transgene product, CD8+ T cell responses against the viral input capsid have been observed in patients after hepatic gene transfer with AAV vectors.25, 26, 27 These responses, occurring 1–3 months after infusion of the vector, are capable of eliminating virally transduced hepatocytes. Possible explanations for the slow onset of these responses, which are typically monitored by interferon (IFN)-γ enzyme-linked immunospot (ELISpot) assay on peripheral blood cells, include slow activation of memory cells and the non-replicating nature of the gene therapy vector coupled with lack of capsid expression from the recombinant vector genome. Hence, delayed T cell responses against virally infected hepatocytes may occur in quite diverse circumstances such as hepatitis caused by RNA viruses and therapeutic gene transfer with a DNA virus.
In the present study, we use AAV gene transfer as a model to demonstrate that delayed CD8+ T cell responses to a virally encoded antigen in the liver depend on viral doses. CD8+ T cells induced at intermediate vector dose cleared the antigen with ∼2 months delay after their initial induction, which correlated with late downregulation of negative regulators of T cell function and upregulation of cytokine expression. Initial lack of T cell functionality depended on intact PD-1/programmed death ligand 1 (PD-L1) pathway. At the lowest vector dose tested, such CD8+ T cell responses occurred only locally in the liver but were not detected in systemic circulation. At high doses, expression was sustained and no response occurred. Thus, the viral dose substantially affects CD8+ T cell responses, which can acquire functionality months after infection of the liver.
Results
Induction of CD8+ T Cell Responses in the Liver Is Determined by the Initial Dose of the AAV Serotype 8 Expressing Full-Length Ovalbumin Vector
In order to study activation of CD8+ T cells specific to an antigen introduced to the liver by viral infection, we utilized AAV serotype 8 (AAV8), which has very strong tropism to murine liver, to deliver an ovalbumin (OVA) transgene. To understand the kinetics of both OVA expression and OVA-specific CD8+ T cell response, we injected wild-type (WT) C57BL/6 male mice with three doses (low: 1 × 10⁸ vg, medium: 1 × 10⁹ vg, and high: 1 × 10¹⁰ vg) of AAV8 expressing full-length OVA (AAV8-OVA) via the tail vein. Peripheral blood mononuclear cells (PBMCs) from these animals were tested for OVA-specific CD8+ T cells, and systemic levels of OVA were determined as a function of time. At the low and high doses, no immune response to OVA was observed. However, at the mid dose, tetramer+ CD8+ T cells were detected (Figures 1A and 1B). Thirty percent to 50% of the mice in this dose group had circulating OVA-specific CD8+ T cells with highest frequency of ∼15% at 4 weeks post injection (PI). Although a slight decline in frequency was observed at 6 and 8 weeks PI, nearly constant levels of these CD8+ T cells persisted throughout the course of this study. Using additional animals injected with this vector dose, we confirmed by qPCR that liver was the only detectable source of OVA expression (Figure S1). OVA-specific antibodies were also detected in the mid dose group as early as 4 weeks PI (Figure 1C). Levels of OVA-specific IgG peaked at 8 weeks PI, while persisting throughout the observation period.
Figure 1.

CD8+ T Cell Response to the Transgene Product as a Function of Vector Dose
C57BL/6 WT mice were injected with different doses of AAV8-OVA, and mice were bled at indicated time points. Peripheral blood was analyzed for OVA-specific CD8+ T cell response using MHC-I H2-Kb-SIINFEKL tetramer. (A) Representative plots showing OVA-specific CD8+ T cell frequencies in mice receiving medium or high vector doses. (B) CD8+ T cell dose response to OVA after AAV8-OVA administration via tail vein. (C) Antibody response to vector-derived OVA. (D) Circulating levels of OVA in mouse plasma following tail vein injection. (E) OVA levels in liver lysates from mice injected with 1 × 10⁹ vg at 4 and 12 weeks PI. Data points are presented as average ± SEM (n = 3–5/group). Statistical significance was determined using Student’s t test. *p ≤ 0.05; ***p ≤ 0.001.
Initially, all doses of vector resulted in systemic OVA expression, which was dose dependent (Figure 1D). A high level of systemic OVA was sustained in the high-dose group throughout the duration of the study, correlating with the lack of OVA-specific CD8+ T cells in these animals. At the mid dose, although OVA-specific CD8+ T cells and antibodies were detected at 4 weeks PI, systemic OVA expression persisted for 8 weeks. However, the expression was abruptly lost by 12 weeks PI in all animals. At low dose, despite absence of a detectable immune response, similar kinetics was observed with loss of expression by 12 weeks PI in all animals. Thus, the vector dose determines whether systemic CD8+ and antibody responses are induced and whether transgene expression is lost or sustained. Loss of systemic OVA correlated with loss of OVA antigen in the liver (Figure 1E).
OVA-Specific CD8+ T Cells Express Key Checkpoint Regulators
The surprising results obtained with the mid-dose group, in which stable OVA expression was maintained approximately 8 weeks post gene transfer, even in the presence of circulating OVA-specific CD8+ T cells, prompted us to further describe these CD8+ T cells. First, we sought to determine whether these CD8+ T cells were functionally impaired, because they failed to clear OVA expression. Surface expression of various inhibitory molecules (PD-1, 2B4, CD160, LAG3, and TIM3) was evaluated by flow cytometry. Strikingly, up to 90% of tetramer+ CD8+ T cells were positive for the expression of PD-1 up to 8 weeks PI (Figures 2A and S2). This level was reduced to 50% by 12 weeks, correlating with the loss of OVA expression. Surface expression of another inhibitory molecule 2B4 was observed on 30%–60% of tetramer+ CD8+ T cells throughout the course of the study, with a modest decline from 6 to 12 weeks PI (Figure 2A). Both these molecules were co-expressed in 20%–50% of tetramer+ CD8+ T cells, during 4–8 weeks of study, which corresponded with the peak of transgene protein expression. Co-expression dropped to ∼10% at 12 weeks PI, when OVA expression was undetectable. No significant change in the other inhibitory markers LAG3, TIM3, and CD160 was observed; these markers were expressed at low frequencies (Figure 2B).
Figure 2.

OVA-Specific CD8+ T Cells Initially Express Multiple Markers of Exhaustion and Acquire Memory Phenotype over Time
C57BL/6 WT mice were injected with 1 × 10⁹ vg of AAV8-OVA via tail vein. Mice were bled at indicated time points, and OVA-specific CD8+ T cells were characterized for the expression of various surface markers using flow cytometry. (A and B) Surface expression of different markers of exhaustion on OVA-specific H2-Kb-SIINFEKL tetramer+ CD8+ T cells. (C) Expression pattern of transcription factors T-bet and Eomes on OVA-specific CD8+ T cells. Data points are presented as average ± SEM (n = 5/group).
T-box transcription factors, T-box expressed in T cells (T-bet) and Eomesodermin (Eomes), are major regulators of T cell immunity, and their differential expression can tip the balance of antigen-specific CD8+ T cells to either effector or exhausted phenotype.28, 29, 30 To further assess the phenotype of OVA-specific CD8+ T cells, we followed the course of T-bet and Eomes expression in these CD8+ T cells. We did not observe any significant reduction in the number of T-bet+ cells (Figures 2C and S2). Similar to surface expression of PD-1, ∼100% of OVA-specific CD8+ T cells were T-bet+ at 4 and 8 weeks PI. A small decrease in T-bet+ cells was observed at 12 weeks PI, when their numbers reduced to ∼75%. Similarly, >80% of OVA-specific CD8+ T cells were Eomes+ at 4 and 8 weeks PI. However, their number declined to ∼25% at 12 weeks PI (Figure 2C). Co-expression of these transcription factors was consistent (∼80% of OVA-specific CD8+ T cells) for up to 8 weeks PI, which reduced to ∼25% at 12 weeks PI. Thus, the reduced expression of several known negative regulators in the tetramer-specific CD8+ cells correlates with the loss of transgene expression. These data suggest that downregulation of negative regulators resulted in acquisition of functionality by CD8+ T cells.
OVA-Specific CD8+ T Cells Initially Fail to Produce Cytokines but Exhibit Cytolytic Function and Acquire Memory Phenotype over Time
The ability of CD8+ T cells to produce cytokines (such as IFN-γ and tumor necrosis factor alpha [TNF-α]) upon antigen encounter is critical for antigen clearance. Therefore, we examined cytokine expression in CD8+ T cells from mice with tetramer+ CD8+ T cells. Total splenocytes from mice with or without OVA-specific CD8+ T cells were in vitro-stimulated overnight with SIINFEKL peptide and were analyzed for cytokine production by intracellular flow cytometry. We did not observe any cytokine production in CD8+ T cells from mice that lacked OVA-specific CD8+ T cells (Figure 3A). Only low frequencies of CD8+ T cells from mice with OVA-specific CD8+ T cells were observed to produce IFN-γ and TNF-α at 4 weeks PI (Figure 3B, top panels). However, frequencies of CD8+ T cells producing IFN-γ and TNF-α were significantly increased by 8 weeks PI and maintained at similar levels by 12 weeks PI. Thus, increased cytokine production correlated well with downregulation of negative regulators of T cell function and the subsequent loss of OVA expression, indicating a delayed acquisition of functionality in OVA-specific CD8+ T cells.
Figure 3.

OVA-Specific CD8+ T Cells Show Delayed Production of IFN-γ and TNF-α
(A) Representative plots showing ex vivo production of IFN-γ and TNF-α by CD8+ T cells from mice that develop an immune response to OVA. (B) Percentages of CD8+ (upper panels) and CD4+ (lower panels) T cells producing IFN-γ, TNF-α, and IFN-γ plus TNF-α following ex vivo re-stimulation with MHC class I- (SIINFEKL) and class II-specific (323–339) OVA peptide, respectively, at indicated time points. (C) Representative histograms from in vivo CD8+ T cell killing assay. A total of 2 million differentially CTV-labeled splenocytes (PBS- or SIINFEKL peptide-pulsed cells) were tail vein injected into either tetramer+ or naive mice. After 12 hr, mice were euthanized and splenocytes were analyzed for CTV-labeled cells. Numbers represent the percentage of adoptively transferred PBS- (brown) or SIINFEKL peptide (black)-pulsed CTV-labeled cells in tetramer+ or tetramer− mice, respectively. (D) Kinetics of memory phenotype on tetramer+ CD8+ T cells following tail vein injection of AAV8-OVA. Memory cells were characterized on the basis of surface expression of CD62L, CD44, and CCR7. Data points are presented as average ± SEM (n = 3–5/group). Statistical significance between different time points was determined using Student’s t test. *p ≤ 0.05; **p ≤ 0.01.
Because PD-1 expression on CD8+ T cells has been linked to their poor cytotoxicity, we further confirmed whether delayed elimination of OVA expression was due to low cytotoxicity of OVA-specific CD8+ T cells. In an in vivo killing assay, an equal number of PBS- and SIINFEKL peptide-pulsed, differentially labeled splenocytes from naive mice were adoptively transferred into either naive mice or mice with OVA-specific CD8+ T cells. Frequencies of labeled cells were determined by flow cytometry after 12 hr. PBS and SIINFEKL peptide-pulsed splenocytes were readily detected in naive mice. In tetramer+ mice, only PBS-pulsed splenocytes were detected (Figure 3C), indicating that OVA-specific CD8+ T cells were able to eliminate SIINFEKL peptide-loaded target cells and were indeed cytolytic. Identical results were obtained at 4 and 12 weeks PI (Figures 3C and S3). Therefore, failure to eliminate OVA expression at early time points cannot be explained by a general inability of the activated CD8+ T cells to kill target cells. Furthermore, T help in the form of OVA-specific IFN-γ-producing CD4+ T cells was present at early time points as well (Figure 3B, lower panels).
We next investigated the kinetics of OVA-specific CD8+ T cells to acquire a memory phenotype. OVA-specific CD8+ T cells were categorized into effector, effector memory (TEM), and central memory (TCM) phenotype on the basis of surface expression of CD62L, C-C chemokine receptor type 7 (CCR7/CD197), and CD44 (Figure S4). At 4 weeks PI, OVA-specific CD8+ T cells were either of the effector (60%) or TEM (∼40%) phenotype (Figure 3D). However, at later time points, an increase in percent of TEM and TCM and a decrease in percent of effector CD8+ T cells were observed, indicating conversion of effectors into memory phenotype.
To summarize, delayed acquisition of functional competence of OVA-specific CD8+ T cells (i.e., ability to clear the hepatic-expressed antigen) correlated with upregulation of cytokines (e.g., IFN-γ) expression, but not with cytotoxic ability or changes in CD4+ T cell responses.
CD8+ T Cell Infiltration of the Liver Occurs at Lower Vector Doses
Seeking for evidence for an immune response in the liver tissue itself, we stained for infiltrating CD8+ T cells using immunohistochemistry. Livers from mice with OVA-specific CD8+ T cells (mid-dose group) showed the highest numbers of infiltrating CD8+ T cells, followed by low- and high-dose groups (Figure 4). Only low- and mid-dose groups reached statistical significance when compared with naive mouse liver. In summary, the vector dose that had produced circulating OVA-specific CD8+ T cells (i.e., the mid dose) also showed the strongest response at the tissue level. Although no circulating tetramer+ CD8+ T cells were detected in the low dose, there was a significant CD8+ T cell response locally in the liver, which likely explains the loss of OVA expression. Finally, persistent OVA expression in the absence of circulating tetramer+ CD8+ T cells in the high-dose group correlated with minimal CD8+ T cell infiltration of the liver.
Figure 4.

Infiltration of CD8+ T Cells in the Livers of Mice as a Function of AAV8-OVA Vector Dose
OCT frozen liver tissues were sectioned and stained for CD8+ T cells. (A) Quantification of infiltrating CD8+ T cells in livers harvested at 4 weeks PI. (B) Quantification of infiltrating CD8+ T cells in livers harvested at 12 weeks PI. (C) Representative immuno-stained images of liver sections from mice injected either with PBS (naive) or with different doses of AAV8-OVA (green fluorescence shows CD8+ T cells; original magnification ×10). Five different focal areas per mouse were captured, and CD8+ T cells were manually counted. Statistical significance (comparison with naive mice) was determined using Student’s t test. **p ≤ 0.01; ***p ≤ 0.001.
Loss of systemic and hepatic OVA expression in the mid dose correlated with gain of functionality of OVA-specific CD8+ T cells (increased cytokine expression, downregulation of PD-1). In addition, IgG titers against OVA also increased (Figure 1C). In conclusion, lower vector doses, regardless of the presence of a systemic CD8+ T cell response to OVA, result in enhanced CD8+ T cell infiltration of the liver by 12 weeks, which correlates with the loss of OVA expression.
Delay in Loss of OVA Antigen Requires an Intact PD-1/PD-L1 Pathway
The PD-1/PD-L1 pathway has been implemented in limiting CD8+ T cell responses in the liver31, 32, 33 and could therefore be responsible for the initial failure of CD8+ T cells, induced by doses ≤1 × 10⁹ vg, to eliminate OVA antigen. To test this hypothesis, we injected C57BL/6 WT or PD-1−/− mice with the mid dose (1 × 10⁹ vg). PBMCs were assayed for OVA-specific CD8+ T cells, and systemic levels of OVA were determined as a function of time. Out of six PD-1−/− mice injected with AAV8-OVA, three (i.e., 50%) had circulating OVA-specific CD8+ T cells, exactly as in WT animals. In these mice, average frequency of OVA-specific CD8+ T cells at 2 weeks PI was ∼2.3% (range 0.15%–5.95%), which increased to ∼10% (range 2.6%−16.3%) at 4 weeks PI (Figure 5A). These frequencies were on average somewhat lower than, but not significantly different from, those seen in the WT mice. OVA-specific antibodies were detected by 4 weeks only in mice that had circulating tetramer+ CD8+ T cells (Figure 5C). These responses were somewhat higher than for WT mice injected in parallel, but similar to those observed in the earlier experiment in WT treated with the same vector dose. Consistent with results from Figure 1, all WT mice showed systemic OVA expression (Figure 5B). In sharp contrast, none of the PD-1−/− mice had systemic OVA expression (Figure 5B). This was the case even for the earliest time point tested (week 2, i.e., before antibody formation occurred). When examined 4 weeks after gene transfer, livers of PD-1−/− mice contained CD8+ T cell infiltrates regardless of whether the animals had been tetramer+ or tetramer− (Figures 5D and 5E). These results are reminiscent of those for the later time points in WT mice transduced with this vector dose (Figure 4), albeit we likely missed the peak of this accelerated response in the liver.
Figure 5.

Lack of PD-1 Pathway Results in Elimination of OVA Expression without Delay
Either C57BL/6 WT or PD-1−/− mice were intravenously injected with 1 × 10⁹ vg of AAV8-OVA, and mice were bled at indicated time points. Peripheral blood and plasma were analyzed for OVA-specific CD8+ T cells and circulating OVA levels, respectively. (A) Frequency of OVA-specific CD8+ T cells in C57BL/6 WT and PD-1−/− mice. (B) Circulating OVA levels in plasma samples of C57BL/6 WT and PD-1−/− mice following intravenous injection of AAV8-OVA. (C) OVA-specific antibodies in plasma samples of C57BL/6 WT and PD-1−/− mice. (D) Quantification of infiltrating CD8+ T cells in liver sections of tetramer+ and tetramer− PD-1−/− mice harvested at 4 weeks PI. (E) Representative immuno-staining images showing infiltration of CD8+ T cells in liver sections of tetramer+ and tetramer− PD-1−/− mice harvested at 4 weeks PI. Data points are presented as average ± SEM (n = 3–6/group). Statistical significance was determined using Student’s t test. ***p ≤ 0.001.
Lack of CD8+ T Cell Response at High Dose: A Multifactorial Phenomenon
Previously, independent studies have shown that Tregs, Fas-L-mediated activation-dependent apoptosis, and the cytokine IL-10 play definitive roles in induction of immunological tolerance.4, 14, 34, 35, 36, 37 To understand whether any of these molecules play a role in tolerance induction in our high-dose group, we injected Foxp3DTR, Fas-L−/−, and IL-10−/− mice with 1 × 10¹⁰ vg of AAV8-OVA and measured OVA-specific CD8+ T cells in PBMCs of these mice at 2 and 4 weeks PI (Figure 6A). Foxp3+ Tregs were transiently depleted in Foxp3DTR mice by intra-peritoneal administration of 1.0 μg of diphtheria toxin at days 7, 10, and 14 PI. In comparison with WT C57BL/6 mice, transient depletion of Foxp3+ Tregs in Foxp3DTR mice led to low but significant increase in OVA-specific CD8+ T cells at 2 weeks PI (Figure 6B). Similarly, significantly higher numbers of OVA-specific CD8+ T cells were also observed in Fas-L−/− and IL-10−/− mice at 2 weeks PI. OVA-specific CD8+ T cells declined in all strains by 4 weeks PI but were still significantly above WT mice in IL-10−/− mice (Figure 6C). In aggregate, the data show that multiple immune-suppressive pathways contribute to CD8+ T cell tolerance at high antigen dose. These may work in concert and in part may also have redundant function, so that elimination of a single pathway does not result in a major induction of CD8+ T cells. Consequently, these low-frequency CD8+ T cell responses did not negatively impact OVA expression (Figure S5).
Figure 6.

Multiple Factors Contribute to a Lack of CD8+ T Cell Response to the Transgene Product at High Vector Dose
C57BL/6 WT, C57BL/6 FoxP3DTR, Fas-L−/−, and IL-10−/− mice were injected with 1 × 10¹⁰ vg of AAV8-OVA via tail vein. C57BL/6 FoxP3DTR received 1 μg of diphtheria toxin via intra-peritoneal route on days 7, 10, and 14 PI. Mice were bled at 2 and 4 weeks PI, and peripheral blood was analyzed for OVA-specific CD8+ T cells using MHC class I H2-Kb-SIINFEKL tetramer. (A) Representative plots showing OVA-specific CD8+ T cell in FoxP3DTR, Fas-L−/−, and IL-10−/− mice at 2 weeks PI. (B and C) Frequency of OVA-specific CD8+ T cells at 2 and 4 weeks PI, respectively. Data points are presented as average ± SEM (n = 3–5/group). Statistical significance was determined by Student’s t test. *p ≤ 0.05.
Discussion
The hepatic environment limits T cell activation and function, which has profound consequences for CD8+ T cell responses to antigens encoded by viruses and viral gene transfer vectors. These may be delayed or entirely suppressed. In this study we utilize AAV8-OVA as a model to understand the impact of viral dose on establishing an immune response or peripheral tolerance to a virally encoded hepatocellular antigen expressed in the liver. Viral vector dose-dependent systemic expression of OVA was observed, with high systemic levels of OVA being maintained in the high-dose group throughout the course of study. Relatively lower levels of systemic OVA were detected in medium- and low-dose groups, with expression lasting only up to ∼10 weeks. However, only animals in the medium-dose group were able to mount a systemic immune response to OVA. Once OVA-specific CD8+ T cells acquired functionality, expression was lost. This delay in elimination of the hepatic-expressed antigen depended on the negative immune checkpoint receptor PD-1. Loss of expression combined with CD8+ T cell infiltration of the liver in the low-dose group and in tetramer− mice of the mid-dose group indicated that a localized immune response had taken place despite the lack of a detectable systemic immune response to OVA.
Delayed Functional CD8+ T Cell Responses to Antigens Introduced to the Liver: Possible Implications for Viral Infections and for Gene Therapy
In the initial clinical trial on hepatic AAV2 gene transfer for hemophilia, a CD8+ T cell response against the viral capsid was identified as the cause for loss of hepatocytes expressing the therapeutic transgene.25, 26 This response occurred approximately 1 month after gene transfer in those patients receiving the highest vector doses. In a more recent trial using AAV8, similar responses took place at high doses but were further delayed to ∼2 months, likely because of different kinetics of capsid antigen presentation.27, 38, 39 The late onset of these responses seemed puzzling, and thus has been much debated. However, experiments with HBV and HCV inoculation of non-human primates show that CD8+ T cell responses may not occur until 2 months after natural viral infection of the liver.24 Both this primate and our mouse study showed a functional CD8+ T cell response 2 months (or later) after infecting the liver with low doses of virus. Because the response to AAV capsid requires cross-presentation, because the antigen is not expressed from the viral genome, high-dose gene transfer may actually reflect a similar situation of low major histocompatibility complex (MHC) class I antigen presentation. Interestingly, loss of transgene expression without detectable T cell response to capsid or to the transgene product (and without antibodies against the transgene product) was observed in some patients enrolled in a more recent clinical trial on hepatic AAV gene transfer, although one should caution that these data still await peer review.40 Although we do not know whether our findings reflect these clinical outcomes, our study shows that a local immune response in the liver can occur in the absence of a systemic response. Although the factors responsible for this discrimination of localized and circulatory immune response to OVA remain unclear, these results suggest that in liver, a certain vector dose, which determines antigen levels and distribution, is required to generate a systemic immune response. While data for MHC class I presentation are not yet available, we recently showed that MHC class II presentation to OVA-specific CD4+ T cells upon AAV8 gene transfer to the liver primarily occurs in the liver draining celiac and portal nodes.41 Elevated antigen levels may lead to immune tolerance, whereas low antigen levels may be (at least apparently) immunologically ignored.6, 42 However, a lack of circulating antigen-specific CD8+ T cells and antibodies, suggesting immunological ignorance to the expressed antigen, may be deceiving, because a local immune response in the liver can still occur, leading to loss of systemic expression.
In the mid-dose group, CD8+ T cells against OVA were induced within 1 month of gene transfer and circulated at high frequency, but failed to clear the antigen during the first 2 months. Because T cell responses in patient studies are typically measured by cytokine-based assays, circulating non-responsive cells would be missed. Therefore, late detection of CD8+ T cells to virally delivered antigens may not necessarily reflect an initial lack of a CD8+ T cell response, but rather delayed onset of cytokine expression. In our model, loss of OVA expression correlated with a downregulation of PD-1, 2B4, and the transcription factor EOMES in CD8+ T cells, preceded by upregulation of IFN-γ and TNF-α expression. During the first 2 months, when PD-1 expression was high, OVA-specific CD8+ T cells still showed cytolytic in vivo activity but did not clear expression, suggesting that they were not fully functional in the hepatic environment, which is characterized by high expression of PD-L1 (the ligand for PD-1) and other immune-suppressive molecules.20, 23 We would like to caution that our model does not explain all delayed anti-viral T cell responses in the liver. For example, delayed induction of CD8+ T cells, rather than change in functionality, was responsible for the late responses in the HCV/chimpanzee model.43 Nonetheless, our results show that, depending on antigen doses, functionally downregulated CD8+ T cells to viral antigens may be induced that acquire functionality at later time points.
Role of Checkpoint Regulators in Initial Functional Impairment of CD8+ T Cells
It has been suggested that in chronic infections of the liver, direct priming of CD8+ T cells without CD4+ T cell help by non-hematopoietic cells could lead to suboptimal activation of and the generation of functionally impaired CD8+ T cells that express PD-1.19, 23 However, these results were obtained in a situation of antigen levels below those in our study. Insufficient T help initially after viral inoculation was also suspected to have contributed to the delay in the CD8+ T cell response to HBV in the primate study.24 In contrast, we found Th1 cell activation and also antibody formation to the transgene product (which are known to be CD4+ T cell dependent in AAV gene transfer). Therefore, our results are unlikely to be explained by lack of T help.
Expression of PD-1 has been associated with the exhaustion of antigen-specific CD8+ T cells in various models.44, 45, 46, 47 Upon further characterization of OVA-specific CD8+ T cells, we observed surface expression of inhibitory molecules PD-1 and 2B4, suggesting that these cells could be functionally impaired, as has been observed in chronic HBV and HCV infections in liver.48, 49, 50 Prior studies have shown that under persistent antigen exposure (such as during chronic viral infections and cancer), PD-1 plays an important role in preventing optimal function of antigen-specific CD8+ T cells, and blockage of PD-1/PD-L1 pathway may restore their effector function.51, 52 Consistent with these observations, we find that the initial inability of induced CD8+ T cells to clear the antigen from the liver (despite cytolytic activity in the in vivo killing assay) depends on an intact PD-1/PD-L1 pathway. Because PD-1−/− mice did not show increased CD8+ T cell induction, we propose that the PD-1/PD-L1 pathway acts in the liver microenvironment as a checkpoint to limit CD8+ T cell-mediated immunopathology. This interpretation is further supported by the literature.31, 32, 53, 54 However, it remains elusive why the T cell response abruptly downregulated PD-1 and became functional during the third month after liver gene transfer. Recent studies have shown that prolonged expression of immune checkpoints (such as PD-1) on CD8+ T cells leads to activation of exhaustion-specific transcriptional networks and therefore cannot be rewired to an effector phenotype.55, 56, 57 Either this acquisition of a permanent unresponsiveness did not occur in our model, or a functional subset lacking PD-1 expression began to dominate the OVA-specific CD8+ T cell population during the third month.
The T-box transcription factors T-bet and EOMES are the key regulators of CD8+ T cell differentiation and function,58 and express reciprocally during chronic infection.59 In an acute infection, CD8+ T cells have high levels of T-bet, which decline as the cells progress into a memory phenotype,60 whereas during chronic infection T-bet expression is downregulated.61 During the course of our study, high levels of T-bet and EOMES were observed on OVA-specific CD8+ T cells during the early phase of infection. Expression of these transcription factors declined with the loss of OVA expression, indicating that these cells were progressing toward a memory phenotype. Characterization of OVA-specific CD8+ T cells on the basis of memory markers confirmed these findings. It remains elusive why the T cell response abruptly became functional during the third month after liver gene transfer. Previous studies have shown that single-stranded AAV vectors, such as the one used here, often elicit non-functional CD8+ T cell responses after intramuscular gene transfer, again characterized by upregulation of PD-1.62 Therefore, such vectors may not be suitable as vaccine carriers, especially because it was not possible to boost the response. However, no spontaneous change to a functional phenotype was reported as in the case here for liver gene transfer.
High Antigen Doses Generate CD8+ T Cell Tolerance in the Liver
In our high-dose group, despite the presence of high levels of OVA throughout the course of the study, we did not observe immune responses, suggesting induction of dose-dependent peripheral immune tolerance. These observations are consistent with our earlier reports on induction of B cell tolerance to the transgene product when high levels of antigen expression in the liver are achieved, whereas lower levels may not protect from antibody formation.6 Several liver-resident APCs (including liver sinusoidal endothelial cell and Kupffer cells) have been implemented in establishing peripheral immune tolerance,63, 64 and various cytokines and signaling pathways have also been proposed to mediate liver tolerance.4, 14, 34, 35 Again, inhibitory signals provided by PD-1 and its ligand PD-L1 regulate both central and peripheral immune tolerance.65 Induction of B cell tolerance depends on induction of FoxP3+ Tregs, and Fas/Fas-L-mediated activation induced cell death.4, 6, 13 IL-10 production by Kupffer cells and Tregs in the liver has been implicated as one of the key mechanisms in suppression of CD8+ T cells.14 We find that FoxP3+ Tregs, IL-10, and Fas-L all contribute to the lack of CD8+ T cell activation at the highest vector dose. However, each of these has only a minor effect, suggesting that multiple pathways work in concert, perhaps in part with redundant immune regulatory function, to establish liver tolerance. In contrast, abolishing the PD-1 and PD-L1 interaction, using a well-established antibody-mediated method,33, 46, 66, 67 was not able to break tolerance in our high-dose group (data not shown). This result again suggests that the PD-1/PD-L1 pathway did not control activation of T cells, but rather impacted their functionality once they were induced at lower vector doses. Further studies are needed to determine potential effects of Fas-L, IL-10, and Treg on the functionality of the responses to low vector doses. However, earlier data by others suggested that T cell exhaustion induced by AAV transgene expression occurs independently of Tregs.62
In conclusion, our results have implications in liver gene therapy and in chronic viral infections of liver. The viral dose is a critical parameter that determines whether CD8+ T cells are activated and whether they are found in circulation. Furthermore, a functionally impaired CD8+ T cell response to limited viral doses can spontaneously acquire functionality and clear the virally encoded antigen several months after infection. In the absence of the negative checkpoint regulators PD-1/PD-L1, a rapid response may occur.
Materials and Methods
Viral Vectors
AAV8-OVA under the control of the human elongation factor-1α (EF1α) promoter was constructed and packaged by triple transfection of HEK293 cells as previously described.12 Viral particles were purified and were quantified as reported previously.68
Mouse Strains
Six- to 8-week-old male WT, Fas-L−/− (B6Smn.C3-Faslgld/J), IL-10−/− (B6.129P2-Il10tm1Cgn/J), and PD-1−/− (Pdcd1tm1.1Shr/J) mice on the C57BL/6 background were purchased from Jackson Laboratories. Foxp3DTR mice on C57BL/6 background were as published previously.13, 69 All mice were housed in specific pathogen-free conditions in the animal facility at the University of Florida, and all procedures were performed as per the guidelines of Institutional Animal Care and Use Committee.
Flow Cytometry
To detect OVA-specific CD8+ T cells, we treated peripheral blood cells with purified rat anti-mouse CD16/CD32 (Fc receptor [FcR] block; BD Biosciences) followed by staining with antibodies to CD8 (53-6.7) and iTAg MHC Tetramer (H2-Kb-SIINFEKL; MBL). Phenotyping of OVA-specific CD8+ T cells was performed by staining peripheral blood cells with antibodies to PD-1 (29F.1A12), LAG-3 (eBioC9B7W), CD-160 (7H1), 2B4 (eBio244F4), TIM-3 (B8.2C12), CD44 (clone IM7), CD62L (MEL-14), and CCR7 (4B12) antibodies. T-box transcription factors, T-bet and Eomes, were detected by permeabilization using the FoxP3 transcription factor buffer kit (eBioscience) and staining with T-bet (4B10) and EOMES (Dan11mag) antibodies. Flow cytometry data were collected on an LSR-II flow cytometer (BD Biosciences) and analyzed in FCS Express (De Novo Software).
Intracellular Cytokine Staining
For intracellular cytokine staining (ICS), 2 million splenocytes were stimulated with media alone, SIINFEKL peptide (2 μg/mL), or concanavalin A (Con A; 4 μg/mL) for 12 hr in the presence of brefeldin A (3 μg/mL). Cells were first surface stained with CD8 (53-6.7) antibody and were permeabilized with Cytofix/Cytoperm kit (BD Biosciences). This was followed by detection with IFN-γ (XMG1.2) and TNF-α (MP6-XT22) antibodies. For CD4+ T cell assay, OVA (323–339) peptide (10 μg/mL) was used.
ELISA
Levels of OVA in mouse plasma were quantified using an in-house OVA-specific ELISA as previously published.70 In brief, affinity-purified rabbit OVA antibody (1:2,000 dilution; Chemicon) was coated on a microtiter plate; mouse plasma samples were applied at 1:40 dilution. Horseradish peroxidase (HRP)-conjugated rabbit OVA antibody was used (1:10,000 dilution; Rockland Immunochemicals). Serial dilutions of endotoxin-free OVA protein from InvivoGen were used to generate a standard curve. Anti-OVA antibodies were detected using mouse anti-OVA IgG antibody assay kit (Chondrex) as per manufacturer’s instructions.
In Vivo Killing Assay
Cytolytic ability of OVA-specific CD8+ T cells was determined using in vivo killing assay as described previously.71 In brief, splenocytes from naive C57BL/6 mice were either pulsed with SIINFEKL peptide (2 μg/mL) or with PBS for 1 hr at 37°C. Peptide- and PBS-pulsed splenocytes were then differentially labeled with 0.05 and 0.005 μM concentrations, respectively, of CellTrace Violet (CTV; Molecular Probes). Two million labeled splenocytes were pooled and injected intravenously to either naive mice or tetramer+ mice. Recipient mice were euthanized 12 hr PI, and percentages of CTVhigh (peptide-pulsed) and CTVlow (PBS-pulsed) adoptively transferred splenocytes were determined by flow cytometry. Percent killing was calculated as: 100 − [(%CTVhigh cells in tetramer+ mice/% CTVlow cells in tetramer+ mice)/(%CTVhigh cells in naive mice/% CTVlow cells in naive mice)] × 100.
Immunohistochemistry
Liver tissues were snap-frozen in liquid nitrogen in Optimal Cutting Temperature (OCT) embedding media (Fisher). Frozen liver tissues were sectioned (∼10 μm), mounted on poly-lysine-coated slides, and immunohistochemistry performed as previously described.72 In brief, cryosections were fixed in acetone at room temperature, blocked with 5% donkey serum (Sigma), and stained with rat anti-CD8α (eBioscience). Secondary antibody donkey anti-rat Alexa Fluor 488 (Life Technologies) was used for detection. Sections were mounted with ProLong Diamond Antifade Mountant (Life Technologies) containing 2-(4-amidinophenyl)-1H -indole-6-carboxamidine (DAPI). Fluorescence microscopy was performed on a Nikon E800 microscope (Nikon).
qPCR
C57BL/6 male mice were injected with either PBS or AAV8-OVA. At 4 weeks PI, different organs (heart, lungs, liver, spleen, kidneys, and muscle) were harvested. Twenty to 25 μg of each tissue was homogenized and processed for total RNA extraction using RNeasy kit (QIAGEN) as per manufacturer’s instruction. Fifty nanograms of total RNA was reverse transcribed with iScript reverse transcription supermix (Bio-Rad). The qPCR was performed using SsoAdvanced universal SYBR green supermix (Bio-Rad), OVA/glyceraldehyde 3-phosphate dehydrogenase (GAPDH)-specific primers, and 1 μL of cDNA (in 20 μL reaction) in a CFX connect real-time PCR detection system (Bio-Rad). Standard curve was generated using serial 10-fold dilutions of AAV8-OVA plasmid. Quantification cycle (Cq) values were converted to copy number of OVA mRNA using standard curve.
Statistical Analysis
Statistical significance of data was determined using either Student’s t test or two-way ANOVA with GraphPad Prism 5 software (GraphPad). The p values <0.05 were deemed significant and indicated as follows: *p < 0.05, **p < 0.01, and ***p < 0.001.
Author Contributions
S.R.P.K. and B.E.H. performed experiments. All authors designed experiments and analyzed and interpreted data. S.R.P.K., C.T., Y.P.d.J., and R.W.H. wrote the manuscript. R.W.H. supervised the study.
Conflicts of Interest
R.W.H. received royalty payments from Spark Therapeutics for license of gene transfer technology and serves on an advisory board for Applied Genetic Technologies Corporations (AGTC).
Acknowledgments
This work was supported by NIH grants R01 AI51390 (to R.W.H.), R01 HL097088 (to R.W.H.), and R01 HL131093 (to R.W.H., C.T., and Y.P.d.J.).
Footnotes
Supplemental Information includes five figures and can be found with this article online at http://dx.doi.org/10.1016/j.ymthe.2017.02.014.
Supplemental Information
References
- 1.Thomson A.W., Knolle P.A. Antigen-presenting cell function in the tolerogenic liver environment. Nat. Rev. Immunol. 2010;10:753–766. doi: 10.1038/nri2858. [DOI] [PubMed] [Google Scholar]
- 2.Gao B., Jeong W.I., Tian Z. Liver: an organ with predominant innate immunity. Hepatology. 2008;47:729–736. doi: 10.1002/hep.22034. [DOI] [PubMed] [Google Scholar]
- 3.Crispe I.N. Immune tolerance in liver disease. Hepatology. 2014;60:2109–2117. doi: 10.1002/hep.27254. [DOI] [PMC free article] [PubMed] [Google Scholar]
- 4.Cao O., Dobrzynski E., Wang L., Nayak S., Mingle B., Terhorst C., Herzog R.W. Induction and role of regulatory CD4+CD25+ T cells in tolerance to the transgene product following hepatic in vivo gene transfer. Blood. 2007;110:1132–1140. doi: 10.1182/blood-2007-02-073304. [DOI] [PMC free article] [PubMed] [Google Scholar]
- 5.Bowen D.G., Zen M., Holz L., Davis T., McCaughan G.W., Bertolino P. The site of primary T cell activation is a determinant of the balance between intrahepatic tolerance and immunity. J. Clin. Invest. 2004;114:701–712. doi: 10.1172/JCI21593. [DOI] [PMC free article] [PubMed] [Google Scholar]
- 6.Mingozzi F., Liu Y.L., Dobrzynski E., Kaufhold A., Liu J.H., Wang Y., Arruda V.R., High K.A., Herzog R.W. Induction of immune tolerance to coagulation factor IX antigen by in vivo hepatic gene transfer. J. Clin. Invest. 2003;111:1347–1356. doi: 10.1172/JCI16887. [DOI] [PMC free article] [PubMed] [Google Scholar]
- 7.Ziegler R.J., Lonning S.M., Armentano D., Li C., Souza D.W., Cherry M., Ford C., Barbon C.M., Desnick R.J., Gao G. AAV2 vector harboring a liver-restricted promoter facilitates sustained expression of therapeutic levels of alpha-galactosidase A and the induction of immune tolerance in Fabry mice. Mol. Ther. 2004;9:231–240. doi: 10.1016/j.ymthe.2003.11.015. [DOI] [PubMed] [Google Scholar]
- 8.Lüth S., Huber S., Schramm C., Buch T., Zander S., Stadelmann C., Brück W., Wraith D.C., Herkel J., Lohse A.W. Ectopic expression of neural autoantigen in mouse liver suppresses experimental autoimmune neuroinflammation by inducing antigen-specific Tregs. J. Clin. Invest. 2008;118:3403–3410. doi: 10.1172/JCI32132. [DOI] [PMC free article] [PubMed] [Google Scholar]
- 9.Sack B.K., Herzog R.W., Terhorst C., Markusic D.M. Development of gene transfer for induction of antigen-specific tolerance. Mol. Ther. Methods Clin. Dev. 2014;1:14013. doi: 10.1038/mtm.2014.13. [DOI] [PMC free article] [PubMed] [Google Scholar]
- 10.Nathwani A.C., Gray J.T., McIntosh J., Ng C.Y.C., Zhou J., Spence Y., Cochrane M., Gray E., Tuddenham E.G., Davidoff A.M. Safe and efficient transduction of the liver after peripheral vein infusion of self-complementary AAV vector results in stable therapeutic expression of human FIX in nonhuman primates. Blood. 2007;109:1414–1421. doi: 10.1182/blood-2006-03-010181. [DOI] [PMC free article] [PubMed] [Google Scholar]
- 11.Nathwani A.C., Reiss U.M., Tuddenham E.G.D., Rosales C., Chowdary P., McIntosh J., Della Peruta M., Lheriteau E., Patel N., Raj D. Long-term safety and efficacy of factor IX gene therapy in hemophilia B. N. Engl. J. Med. 2014;371:1994–2004. doi: 10.1056/NEJMoa1407309. [DOI] [PMC free article] [PubMed] [Google Scholar]
- 12.Cooper M., Nayak S., Hoffman B.E., Terhorst C., Cao O., Herzog R.W. Improved induction of immune tolerance to factor IX by hepatic AAV-8 gene transfer. Hum. Gene Ther. 2009;20:767–776. doi: 10.1089/hum.2008.161. [DOI] [PMC free article] [PubMed] [Google Scholar]
- 13.Markusic D.M., Hoffman B.E., Perrin G.Q., Nayak S., Wang X., LoDuca P.A., High K.A., Herzog R.W. Effective gene therapy for haemophilic mice with pathogenic factor IX antibodies. EMBO Mol. Med. 2013;5:1698–1709. doi: 10.1002/emmm.201302859. [DOI] [PMC free article] [PubMed] [Google Scholar]
- 14.Hoffman B.E., Martino A.T., Sack B.K., Cao O., Liao G., Terhorst C., Herzog R.W. Nonredundant roles of IL-10 and TGF-β in suppression of immune responses to hepatic AAV-factor IX gene transfer. Mol. Ther. 2011;19:1263–1272. doi: 10.1038/mt.2011.33. [DOI] [PMC free article] [PubMed] [Google Scholar]
- 15.Breous E., Thimme R. Potential of immunotherapy for hepatocellular carcinoma. J. Hepatol. 2011;54:830–834. doi: 10.1016/j.jhep.2010.10.013. [DOI] [PubMed] [Google Scholar]
- 16.Yoshio S., Kanto T. Host-virus interactions in hepatitis B and hepatitis C infection. J. Gastroenterol. 2016;51:409–420. doi: 10.1007/s00535-016-1183-3. [DOI] [PubMed] [Google Scholar]
- 17.Rehermann B., Chang K.M., McHutchinson J., Kokka R., Houghton M., Rice C.M., Chisari F.V. Differential cytotoxic T-lymphocyte responsiveness to the hepatitis B and C viruses in chronically infected patients. J. Virol. 1996;70:7092–7102. doi: 10.1128/jvi.70.10.7092-7102.1996. [DOI] [PMC free article] [PubMed] [Google Scholar]
- 18.Protzer U., Maini M.K., Knolle P.A. Living in the liver: hepatic infections. Nat. Rev. Immunol. 2012;12:201–213. doi: 10.1038/nri3169. [DOI] [PubMed] [Google Scholar]
- 19.Thimme R., Oldach D., Chang K.M., Steiger C., Ray S.C., Chisari F.V. Determinants of viral clearance and persistence during acute hepatitis C virus infection. J. Exp. Med. 2001;194:1395–1406. doi: 10.1084/jem.194.10.1395. [DOI] [PMC free article] [PubMed] [Google Scholar]
- 20.Radziewicz H., Ibegbu C.C., Fernandez M.L., Workowski K.A., Obideen K., Wehbi M., Hanson H.L., Steinberg J.P., Masopust D., Wherry E.J. Liver-infiltrating lymphocytes in chronic human hepatitis C virus infection display an exhausted phenotype with high levels of PD-1 and low levels of CD127 expression. J. Virol. 2007;81:2545–2553. doi: 10.1128/JVI.02021-06. [DOI] [PMC free article] [PubMed] [Google Scholar]
- 21.Golden-Mason L., Palmer B., Klarquist J., Mengshol J.A., Castelblanco N., Rosen H.R. Upregulation of PD-1 expression on circulating and intrahepatic hepatitis C virus-specific CD8+ T cells associated with reversible immune dysfunction. J. Virol. 2007;81:9249–9258. doi: 10.1128/JVI.00409-07. [DOI] [PMC free article] [PubMed] [Google Scholar]
- 22.Zhang Z., Zhang J.Y., Wherry E.J., Jin B., Xu B., Zou Z.S., Zhang S.Y., Li B.S., Wang H.F., Wu H. Dynamic programmed death 1 expression by virus-specific CD8 T cells correlates with the outcome of acute hepatitis B. Gastroenterology. 2008;134:1938–1949. doi: 10.1053/j.gastro.2008.03.037. 1949.e1–3. [DOI] [PubMed] [Google Scholar]
- 23.Wuensch S.A., Spahn J., Crispe I.N. Direct, help-independent priming of CD8+ T cells by adeno-associated virus-transduced hepatocytes. Hepatology. 2010;52:1068–1077. doi: 10.1002/hep.23745. [DOI] [PMC free article] [PubMed] [Google Scholar]
- 24.Asabe S., Wieland S.F., Chattopadhyay P.K., Roederer M., Engle R.E., Purcell R.H., Chisari F.V. The size of the viral inoculum contributes to the outcome of hepatitis B virus infection. J. Virol. 2009;83:9652–9662. doi: 10.1128/JVI.00867-09. [DOI] [PMC free article] [PubMed] [Google Scholar]
- 25.Manno C.S., Pierce G.F., Arruda V.R., Glader B., Ragni M., Rasko J.J., Ozelo M.C., Hoots K., Blatt P., Konkle B. Successful transduction of liver in hemophilia by AAV-Factor IX and limitations imposed by the host immune response. Nat. Med. 2006;12:342–347. doi: 10.1038/nm1358. [DOI] [PubMed] [Google Scholar]
- 26.Mingozzi F., Maus M.V., Hui D.J., Sabatino D.E., Murphy S.L., Rasko J.E., Ragni M.V., Manno C.S., Sommer J., Jiang H. CD8(+) T-cell responses to adeno-associated virus capsid in humans. Nat. Med. 2007;13:419–422. doi: 10.1038/nm1549. [DOI] [PubMed] [Google Scholar]
- 27.Nathwani A.C., Tuddenham E.G., Rangarajan S., Rosales C., McIntosh J., Linch D.C., Chowdary P., Riddell A., Pie A.J., Harrington C. Adenovirus-associated virus vector-mediated gene transfer in hemophilia B. N. Engl. J. Med. 2011;365:2357–2365. doi: 10.1056/NEJMoa1108046. [DOI] [PMC free article] [PubMed] [Google Scholar]
- 28.Buggert M., Tauriainen J., Yamamoto T., Frederiksen J., Ivarsson M.A., Michaëlsson J., Lund O., Hejdeman B., Jansson M., Sönnerborg A. T-bet and Eomes are differentially linked to the exhausted phenotype of CD8+ T cells in HIV infection. PLoS Pathog. 2014;10:e1004251. doi: 10.1371/journal.ppat.1004251. [DOI] [PMC free article] [PubMed] [Google Scholar]
- 29.McLane L.M., Banerjee P.P., Cosma G.L., Makedonas G., Wherry E.J., Orange J.S., Betts M.R. Differential localization of T-bet and Eomes in CD8 T cell memory populations. J. Immunol. 2013;190:3207–3215. doi: 10.4049/jimmunol.1201556. [DOI] [PMC free article] [PubMed] [Google Scholar]
- 30.Popescu I., Pipeling M.R., Shah P.D., Orens J.B., McDyer J.F. T-bet:Eomes balance, effector function, and proliferation of cytomegalovirus-specific CD8+ T cells during primary infection differentiates the capacity for durable immune control. J. Immunol. 2014;193:5709–5722. doi: 10.4049/jimmunol.1401436. [DOI] [PMC free article] [PubMed] [Google Scholar]
- 31.Iwai Y., Terawaki S., Ikegawa M., Okazaki T., Honjo T. PD-1 inhibits antiviral immunity at the effector phase in the liver. J. Exp. Med. 2003;198:39–50. doi: 10.1084/jem.20022235. [DOI] [PMC free article] [PubMed] [Google Scholar]
- 32.Dong H., Zhu G., Tamada K., Flies D.B., van Deursen J.M., Chen L. B7-H1 determines accumulation and deletion of intrahepatic CD8(+) T lymphocytes. Immunity. 2004;20:327–336. doi: 10.1016/s1074-7613(04)00050-0. [DOI] [PubMed] [Google Scholar]
- 33.Lukens J.R., Cruise M.W., Lassen M.G., Hahn Y.S. Blockade of PD-1/B7-H1 interaction restores effector CD8+ T cell responses in a hepatitis C virus core murine model. J. Immunol. 2008;180:4875–4884. doi: 10.4049/jimmunol.180.7.4875. [DOI] [PMC free article] [PubMed] [Google Scholar]
- 34.Griffith T.S., Brunner T., Fletcher S.M., Green D.R., Ferguson T.A. Fas ligand-induced apoptosis as a mechanism of immune privilege. Science. 1995;270:1189–1192. doi: 10.1126/science.270.5239.1189. [DOI] [PubMed] [Google Scholar]
- 35.Pender M.P. Activation-induced apoptosis of autoreactive and alloreactive T lymphocytes in the target organ as a major mechanism of tolerance. Immunol. Cell Biol. 1999;77:216–223. doi: 10.1046/j.1440-1711.1999.00818.x. [DOI] [PubMed] [Google Scholar]
- 36.Di Marco R., Xiang M., Zaccone P., Leonardi C., Franco S., Meroni P., Nicoletti F. Concanavalin A-induced hepatitis in mice is prevented by interleukin (IL)-10 and exacerbated by endogenous IL-10 deficiency. Autoimmunity. 1999;31:75–83. doi: 10.3109/08916939908994050. [DOI] [PubMed] [Google Scholar]
- 37.Erhardt A., Biburger M., Papadopoulos T., Tiegs G. IL-10, regulatory T cells, and Kupffer cells mediate tolerance in concanavalin A-induced liver injury in mice. Hepatology. 2007;45:475–485. doi: 10.1002/hep.21498. [DOI] [PubMed] [Google Scholar]
- 38.Ertl H. The RAC: double, double, toil, and trouble? Mol. Ther. 2009;17:397–399. doi: 10.1038/mt.2009.19. [DOI] [PMC free article] [PubMed] [Google Scholar]
- 39.Martino A.T., Basner-Tschakarjan E., Markusic D.M., Finn J.D., Hinderer C., Zhou S., Ostrov D.A., Srivastava A., Ertl H.C., Terhorst C. Engineered AAV vector minimizes in vivo targeting of transduced hepatocytes by capsid-specific CD8+ T cells. Blood. 2013;121:2224–2233. doi: 10.1182/blood-2012-10-460733. [DOI] [PMC free article] [PubMed] [Google Scholar]
- 40.Herzog R.W. Hemophilia gene therapy: caught between a cure and an immune response. Mol. Ther. 2015;23:1411–1412. doi: 10.1038/mt.2015.135. [DOI] [PMC free article] [PubMed] [Google Scholar]
- 41.Perrin G.Q., Zolotukhin I., Sherman A., Biswas M., de Jong Y.P., Terhorst C., Davidoff A.M., Herzog R.W. Dynamics of antigen presentation to transgene product-specific CD4(+) T cells and of Treg induction upon hepatic AAV gene transfer. Mol. Ther. Methods Clin. Dev. 2016;3:16083. doi: 10.1038/mtm.2016.83. [DOI] [PMC free article] [PubMed] [Google Scholar]
- 42.Ziegler R.J., Cherry M., Barbon C.M., Li C., Bercury S.D., Armentano D., Desnick R.J., Cheng S.H. Correction of the biochemical and functional deficits in fabry mice following AAV8-mediated hepatic expression of alpha-galactosidase A. Mol. Ther. 2007;15:492–500. doi: 10.1038/sj.mt.6300066. [DOI] [PubMed] [Google Scholar]
- 43.Shin E.C., Park S.H., Demino M., Nascimbeni M., Mihalik K., Major M., Veerapu N.S., Heller T., Feinstone S.M., Rice C.M., Rehermann B. Delayed induction, not impaired recruitment, of specific CD8+ T cells causes the late onset of acute hepatitis C. Gastroenterology. 2011;141:686–695. doi: 10.1053/j.gastro.2011.05.006. 695.e1. [DOI] [PMC free article] [PubMed] [Google Scholar]
- 44.Trautmann L., Janbazian L., Chomont N., Said E.A., Gimmig S., Bessette B., Boulassel M.R., Delwart E., Sepulveda H., Balderas R.S. Upregulation of PD-1 expression on HIV-specific CD8+ T cells leads to reversible immune dysfunction. Nat. Med. 2006;12:1198–1202. doi: 10.1038/nm1482. [DOI] [PubMed] [Google Scholar]
- 45.Boettler T., Panther E., Bengsch B., Nazarova N., Spangenberg H.C., Blum H.E., Thimme R. Expression of the interleukin-7 receptor alpha chain (CD127) on virus-specific CD8+ T cells identifies functionally and phenotypically defined memory T cells during acute resolving hepatitis B virus infection. J. Virol. 2006;80:3532–3540. doi: 10.1128/JVI.80.7.3532-3540.2006. [DOI] [PMC free article] [PubMed] [Google Scholar]
- 46.Urbani S., Amadei B., Tola D., Pedrazzi G., Sacchelli L., Cavallo M.C., Orlandini A., Missale G., Ferrari C. Restoration of HCV-specific T cell functions by PD-1/PD-L1 blockade in HCV infection: effect of viremia levels and antiviral treatment. J. Hepatol. 2008;48:548–558. doi: 10.1016/j.jhep.2007.12.014. [DOI] [PubMed] [Google Scholar]
- 47.Yamamoto T., Price D.A., Casazza J.P., Ferrari G., Nason M., Chattopadhyay P.K., Roederer M., Gostick E., Katsikis P.D., Douek D.C. Surface expression patterns of negative regulatory molecules identify determinants of virus-specific CD8+ T-cell exhaustion in HIV infection. Blood. 2011;117:4805–4815. doi: 10.1182/blood-2010-11-317297. [DOI] [PMC free article] [PubMed] [Google Scholar]
- 48.Blackburn S.D., Shin H., Haining W.N., Zou T., Workman C.J., Polley A., Betts M.R., Freeman G.J., Vignali D.A., Wherry E.J. Coregulation of CD8+ T cell exhaustion by multiple inhibitory receptors during chronic viral infection. Nat. Immunol. 2009;10:29–37. doi: 10.1038/ni.1679. [DOI] [PMC free article] [PubMed] [Google Scholar]
- 49.Bengsch B., Seigel B., Ruhl M., Timm J., Kuntz M., Blum H.E., Pircher H., Thimme R. Coexpression of PD-1, 2B4, CD160 and KLRG1 on exhausted HCV-specific CD8+ T cells is linked to antigen recognition and T cell differentiation. PLoS Pathog. 2010;6:e1000947. doi: 10.1371/journal.ppat.1000947. [DOI] [PMC free article] [PubMed] [Google Scholar]
- 50.Ye B., Liu X., Li X., Kong H., Tian L., Chen Y. T-cell exhaustion in chronic hepatitis B infection: current knowledge and clinical significance. Cell Death Dis. 2015;6:e1694. doi: 10.1038/cddis.2015.42. [DOI] [PMC free article] [PubMed] [Google Scholar]
- 51.Barber D.L., Wherry E.J., Masopust D., Zhu B., Allison J.P., Sharpe A.H., Freeman G.J., Ahmed R. Restoring function in exhausted CD8 T cells during chronic viral infection. Nature. 2006;439:682–687. doi: 10.1038/nature04444. [DOI] [PubMed] [Google Scholar]
- 52.Hamid O., Robert C., Daud A., Hodi F.S., Hwu W.J., Kefford R., Wolchok J.D., Hersey P., Joseph R.W., Weber J.S. Safety and tumor responses with lambrolizumab (anti-PD-1) in melanoma. N. Engl. J. Med. 2013;369:134–144. doi: 10.1056/NEJMoa1305133. [DOI] [PMC free article] [PubMed] [Google Scholar]
- 53.Mühlbauer M., Fleck M., Schütz C., Weiss T., Froh M., Blank C., Schölmerich J., Hellerbrand C. PD-L1 is induced in hepatocytes by viral infection and by interferon-alpha and -gamma and mediates T cell apoptosis. J. Hepatol. 2006;45:520–528. doi: 10.1016/j.jhep.2006.05.007. [DOI] [PubMed] [Google Scholar]
- 54.Grakoui A., John Wherry E., Hanson H.L., Walker C., Ahmed R. Turning on the off switch: regulation of anti-viral T cell responses in the liver by the PD-1/PD-L1 pathway. J. Hepatol. 2006;45:468–472. doi: 10.1016/j.jhep.2006.07.009. [DOI] [PubMed] [Google Scholar]
- 55.Sen D.R., Kaminski J., Barnitz R.A., Kurachi M., Gerdemann U., Yates K.B., Tsao H.W., Godec J., LaFleur M.W., Brown F.D. The epigenetic landscape of T cell exhaustion. Science. 2016;354:1165–1169. doi: 10.1126/science.aae0491. [DOI] [PMC free article] [PubMed] [Google Scholar]
- 56.Pauken K.E., Sammons M.A., Odorizzi P.M., Manne S., Godec J., Khan O., Drake A.M., Chen Z., Sen D.R., Kurachi M. Epigenetic stability of exhausted T cells limits durability of reinvigoration by PD-1 blockade. Science. 2016;354:1160–1165. doi: 10.1126/science.aaf2807. [DOI] [PMC free article] [PubMed] [Google Scholar]
- 57.Turner S.J., Russ B.E. Can T cells be too exhausted to fight back? Science. 2016;354:1104–1105. doi: 10.1126/science.aal3204. [DOI] [PubMed] [Google Scholar]
- 58.Intlekofer A.M., Takemoto N., Wherry E.J., Longworth S.A., Northrup J.T., Palanivel V.R., Mullen A.C., Gasink C.R., Kaech S.M., Miller J.D. Effector and memory CD8+ T cell fate coupled by T-bet and eomesodermin. Nat. Immunol. 2005;6:1236–1244. doi: 10.1038/ni1268. [DOI] [PubMed] [Google Scholar]
- 59.Paley M.A., Kroy D.C., Odorizzi P.M., Johnnidis J.B., Dolfi D.V., Barnett B.E., Bikoff E.K., Robertson E.J., Lauer G.M., Reiner S.L., Wherry E.J. Progenitor and terminal subsets of CD8+ T cells cooperate to contain chronic viral infection. Science. 2012;338:1220–1225. doi: 10.1126/science.1229620. [DOI] [PMC free article] [PubMed] [Google Scholar]
- 60.Joshi N.S., Cui W., Dominguez C.X., Chen J.H., Hand T.W., Kaech S.M. Increased numbers of preexisting memory CD8 T cells and decreased T-bet expression can restrain terminal differentiation of secondary effector and memory CD8 T cells. J. Immunol. 2011;187:4068–4076. doi: 10.4049/jimmunol.1002145. [DOI] [PMC free article] [PubMed] [Google Scholar]
- 61.Kao C., Oestreich K.J., Paley M.A., Crawford A., Angelosanto J.M., Ali M.A., Intlekofer A.M., Boss J.M., Reiner S.L., Weinmann A.S., Wherry E.J. Transcription factor T-bet represses expression of the inhibitory receptor PD-1 and sustains virus-specific CD8+ T cell responses during chronic infection. Nat. Immunol. 2011;12:663–671. doi: 10.1038/ni.2046. [DOI] [PMC free article] [PubMed] [Google Scholar]
- 62.Lin S.W., Hensley S.E., Tatsis N., Lasaro M.O., Ertl H.C. Recombinant adeno-associated virus vectors induce functionally impaired transgene product-specific CD8+ T cells in mice. J. Clin. Invest. 2007;117:3958–3970. doi: 10.1172/JCI33138. [DOI] [PMC free article] [PubMed] [Google Scholar]
- 63.Limmer A., Ohl J., Kurts C., Ljunggren H.G., Reiss Y., Groettrup M., Momburg F., Arnold B., Knolle P.A. Efficient presentation of exogenous antigen by liver endothelial cells to CD8+ T cells results in antigen-specific T-cell tolerance. Nat. Med. 2000;6:1348–1354. doi: 10.1038/82161. [DOI] [PubMed] [Google Scholar]
- 64.Horst A.K., Neumann K., Diehl L., Tiegs G. Modulation of liver tolerance by conventional and nonconventional antigen-presenting cells and regulatory immune cells. Cell. Mol. Immunol. 2016;13:277–292. doi: 10.1038/cmi.2015.112. [DOI] [PMC free article] [PubMed] [Google Scholar]
- 65.Keir M.E., Butte M.J., Freeman G.J., Sharpe A.H. PD-1 and its ligands in tolerance and immunity. Annu. Rev. Immunol. 2008;26:677–704. doi: 10.1146/annurev.immunol.26.021607.090331. [DOI] [PMC free article] [PubMed] [Google Scholar]
- 66.Nakamoto N., Kaplan D.E., Coleclough J., Li Y., Valiga M.E., Kaminski M., Shaked A., Olthoff K., Gostick E., Price D.A. Functional restoration of HCV-specific CD8 T cells by PD-1 blockade is defined by PD-1 expression and compartmentalization. Gastroenterology. 2008;134:1927–1937. doi: 10.1053/j.gastro.2008.02.033. 1937.e1–2. [DOI] [PMC free article] [PubMed] [Google Scholar]
- 67.Seifert A.M., Zeng S., Zhang J.Q., Kim T.S., Cohen N.A., Beckman M.J., Medina B.D., Maltbaek J.H., Loo J.K., Crawley M.H. PD-1/PD-L1 blockade enhances T-cell activity and antitumor efficacy of imatinib in gastrointestinal stromal tumors. Clin. Cancer Res. 2017;23:454–465. doi: 10.1158/1078-0432.CCR-16-1163. [DOI] [PMC free article] [PubMed] [Google Scholar]
- 68.Liu Y.L., Wagner K., Robinson N., Sabatino D., Margaritis P., Xiao W., Herzog R.W. Optimized production of high-titer recombinant adeno-associated virus in roller bottles. Biotechniques. 2003;34:184–189. doi: 10.2144/03341dd07. [DOI] [PubMed] [Google Scholar]
- 69.Kim J.M., Rasmussen J.P., Rudensky A.Y. Regulatory T cells prevent catastrophic autoimmunity throughout the lifespan of mice. Nat. Immunol. 2007;8:191–197. doi: 10.1038/ni1428. [DOI] [PubMed] [Google Scholar]
- 70.Dobrzynski E., Mingozzi F., Liu Y.L., Bendo E., Cao O., Wang L., Herzog R.W. Induction of antigen-specific CD4+ T-cell anergy and deletion by in vivo viral gene transfer. Blood. 2004;104:969–977. doi: 10.1182/blood-2004-03-0847. [DOI] [PubMed] [Google Scholar]
- 71.Jellison E.R., Kim S.K., Welsh R.M. Cutting edge: MHC class II-restricted killing in vivo during viral infection. J. Immunol. 2005;174:614–618. doi: 10.4049/jimmunol.174.2.614. [DOI] [PubMed] [Google Scholar]
- 72.Rogers G.L., Hoffman B.E. Optimal immunofluorescent staining for human factor IX and infiltrating T cells following gene therapy for hemophilia B. J. Genet. Syndr. Gene Ther. 2012;(Suppl 1):012. doi: 10.4172/2157-7412.s1-012. [DOI] [PMC free article] [PubMed] [Google Scholar]
Associated Data
This section collects any data citations, data availability statements, or supplementary materials included in this article.