Abstract
The extreme stress tolerance and high nutritional value of sand rice (Agriophyllum squarrosum) make it attractive for use as an alternative crop in response to concerns about ongoing climate change and future food security. However, a lack of genetic information hinders understanding of the mechanisms underpinning the morphological and physiological adaptations of sand rice. In the present study, we sequenced and analyzed the transcriptomes of two individuals representing semi-arid [Naiman (NM)] and arid [Shapotou (SPT)] sand rice genotypes. A total of 105,868 pairwise single nucleotide polymorphisms (SNPs) distributed in 24,712 Unigenes were identified among SPT and NM samples; the average SNP frequency was 0.3% (one SNP per 333 base pair). Characterization of gene annotation demonstrated that variations in genes involved in DNA recombination were associated with the survival of the NM population in the semi-arid environment. A set of genes predicted to be relevant to heat stress response and agronomic traits was functionally annotated using the accumulated knowledge from Arabidopsis and several crop plants, including rice, barley, maize, and sorghum. Four candidate genes related to heat tolerance (heat-shock transcription factor, HsfA1d), seed size (DA1-Related, DAR1), and flowering (early flowering 3, ELF3 and late elongated hypocotyl, LHY) were subjected to analysis of the genetic diversity in 10 natural populations, representing the core germplasm resource across the area of sand rice distribution in China. Only one SNP was detected in each of HsfA1d and DAR1, among 60 genotypes, with two in ELF3 and four in LHY. Nucleotide diversity ranged from 0.00032 to 0.00118. Haplotype analysis indicated that the NM population carried a specific allele for all four genes, suggesting that divergence has occurred between NM and other populations. These four genes could be further analyzed to determine whether they are associated with phenotype variation and identify alleles favorable for sand rice breeding.
Keywords: sand rice, physiological adaptation, climate change, single nucleotide polymorphism, allele diversity, natural variation, candidate genes
Introduction
Ongoing climate change and the increasing global population are continuous threats to global food security (Tester and Langridge, 2010; Lobell et al., 2011; Lobell and Gourdji, 2012; McCouch et al., 2013; Wheeler and von Braun, 2013). The negative influence of climate change on crop production has motivated scientists improve staple crops by exploitation of the genetic resource available in their wild relatives (Tester and Langridge, 2010; McCouch et al., 2013); however, the simultaneous development of new crops among the neglected and underutilized species will also crucial for sustainable and intensified food production (Mayes et al., 2012; Chen et al., 2014; Zhao et al., 2014). The Amaranthaceae species, sand rice (Agriophyllum squarrosum), has been among crops used for army provisions since the Tang Dynasty (AD 618–907) and is still an important component of local food for people inhabiting the Hexi Corridor along the ancient Silk Road in the northwest of China (Gao, 2002; Chen et al., 2014). Due to its high nutritional value and extreme stress tolerance, sand rice represents a suitable alternative food crop, resilient to climate change (Chen et al., 2014; Zhao et al., 2014).
Sand rice originates from the Gurbantunggut desert and is widely distributed on the mobile and semi-mobile sand dunes across the arid regions of northern China (Zhao et al., 2014; Qian et al., 2016). To thrive in a desert environment, sand rice has evolved many morphological traits and adaptation strategies to mitigate the risk of extinction due to climate variability, such as extreme temperatures, unpredictable precipitation, strong solar radiation, and other environmental stresses (Chen et al., 2014; Zhao et al., 2014). Comparative transcriptome analysis has been used to identify candidate genes related to abiotic stress tolerance and unique traits of this species (Zhao et al., 2014, 2016). Some core genetic elements involved in environmental responses are conserved among plant species; however, the genetic mechanisms underpinning the morphological and physiological adaptations of sand rice remain poorly understood.
Natural variation is the genetic basis for species adaptation to different environments and the identification of genomic polymorphisms, for example single nucleotide polymorphisms (SNPs), is essential for in-depth analysis of genes and alleles involved in plant evolution and environmental adaptation (Mitchell-Olds and Schmitt, 2006; Alonso-Blanco et al., 2009; Lasky et al., 2012). Extensive whole genome SNP analysis of several model and crop plants, such as Arabidopsis thaliana, rice, and maize, has been performed during past decades for a variety of purposes, including studies of genetic diversity, genome evolution, association mapping, and domestication (McNally et al., 2009; Huang et al., 2010; Lai et al., 2010; Hancock et al., 2011; Kump et al., 2011; van Heerwaarden et al., 2011; Horton et al., 2012).
The climate varies considerably across the geographic range of sand rice, and precipitation and mean temperature of the coldest quarter strongly influence its distribution (Qian et al., 2016). Furthermore, phenology variation has been observed among natural populations of sand rice (Zhao et al., 2014; Yin et al., 2016); for example, the seed size from semi-arid region (Naiman, NM) is larger than that from arid region [Shapotou (SPT); Figure 1]. Moreover, the flowering of NM sand rice occurs earlier than that of SPT at the common garden; SPT individuals are more tolerant to heat stress. Large scale analyses of genetic variation will be crucial for understanding the genetic mechanisms underlying adaptation of sand rice to climate features or local environmental conditions, and provide a foundation for the discovery and isolation of markers useful for its subsequent domestication.
FIGURE 1.
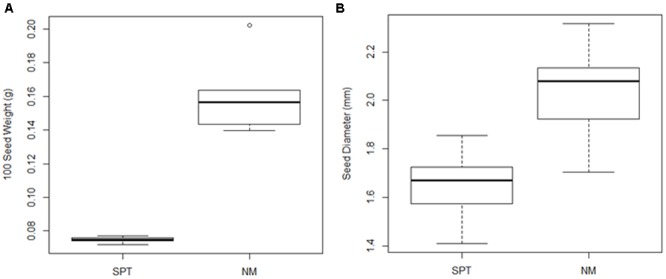
Boxplots of seed weight and seed diameter of sand rice plants from two natural populations (SPT and NM). (A) Seed weight was calculated using 100 seeds from each of five independent plants from each population; (B) Diameters of 10 seeds per plant from five independent plants were measured from both populations.
Previous studies in Arabidopsis have elucidated complex pathways regulating heat stress response, seed size, and flowering time (Fornara et al., 2010; Bokszczanin et al., 2013; Verhage et al., 2014; Li and Li, 2016). For example, the heat-shock transcription factor HsfA1d is one of master regulators with a critical role in evoking the transcription cascade to confer heat stress response (Ohama et al., 2016). The ubiquitin receptors, DA1 and DA1-related protein (DAR1), are core genetic elements controlling cell proliferation in the integument via the ubiquitin-proteasome pathway (Li and Li, 2016). Moreover, late elongated hypocotyl (LHY) and early flowering 3 (ELF3) are morning- and evening-phased components involved in circadian rhythm regulation in Arabidopsis (Hicks et al., 1996; Nusinow et al., 2011; Hsu and Harmer, 2014).
With the advancement of sequencing technologies, genome scale analyses of sequence polymorphism has become feasible and cost effective for non-model plants (Silva-Junior et al., 2011; Zou et al., 2014; Pavy et al., 2016). Analysis of the genomes of populations from different environments could identify genes and alleles favored in specific local climates (Henry, 2014). In this study, two representative sand rice plants from arid and semi-arid regions (SPT and NM) were sequenced using the RNA-seq method to generate a genome wide dataset of SNP polymorphisms. Four candidate genes, HsfA1d, DAR1, LHY, and ELF3, were selected for further assessment of allelic diversity in 10 natural populations, which represent the core germplasm resources of sand rice, according to the results of phylogeographic analysis (Qian et al., 2016).
Materials and Methods
Ethics Statement
Shapotou and NM seeds were collected from SPT Desert Research and Experimental Station and NM Desertification Research Station, Northwest Institute of Eco-Environment and Resources, Chinese Academy of Sciences. Specific permits were not required to sample the seeds for this study.
Seed Size
Seeds were sampled from five independent plants at each of the NM and SPT stations. For each plant, 100 seeds were used to calculate the average seed weight and 10 seeds were used to determine the average diameter.
Plant Materials, RNA Extraction, Transcriptome Sequencing, and Unigene Annotation
Naiman seeds were germinated in a growth chamber and then transferred into pots filled with nutritional soil in the base with an upper layer of sand in a green house. The shoot and root of a 3-month-old seedling (Supplementary Figure 1) were collected separately and total RNA was extracted using a Plant total RNA Kit (TIANGEN, Beijing, China). Equal amounts of RNA from shoot and root were mixed together for cDNA library construction. Library was prepared as described by Zhao et al. (2014) and transcriptome sequencing was performed on the Illumina HiSeqTM 2500 platform using 125 bp paired-end reads at Biomarker Technologies (Beijing, China). A total of 16.40 million reads were obtained with 93.01% achieving quality scores above Q30. Raw data were deposited in the NCBI Short Read Archive with the accession number SRR5271162.
Reads from a previous transcriptome analysis of plant from the SPT region were downloaded from the NCBI Sequence Read Archive (SRR1559276, Zhao et al., 2014). After filtering, high quality reads from the two samples were assembled together by Trinity program with default settings (Grabherr et al., 2011). Contigs were clustered based on sequence similarity and paired-end information and then assembled into transcripts. Finally, singletons and the longest transcripts in each cluster were selected as a total reference Unigene set for sand rice. Histograms of Unigene length and GC content data were generated using an R script (R Development Core Team, 2008). Whole Unigenes were blasted against public protein databases, including the NCBI non-redundant protein (Nr) database, the Swiss-Prot protein database, Clusters of Orthologous Groups of proteins (COG), Gene Ontology (GO), Kyoto Encyclopedia of Genes and Genomes (KEGG), and Eukaryotic Orthologous Groups (KOG), using a threshold less than 1E-5. The predicted ORFs for each Unigene were aligned against the Pfam database using the program HMMER (Eddy, 1998) to increase the number of annotated Unigenes.
SNP Calling and Statistical Analyses
Clean reads from each sample were re-mapped to reference Unigenes using the STAR program (Dobin et al., 2013) and SNP calling was conducted using GATK with the standard filter method (McKenna et al., 2010). Two main parameters were used to filter SNPs: (1) more than three mismatches in the adjacent 35 bp and (2) SNP quality score less than 2.0 after normalization for sequencing depth. This study mainly focused on pairwise SNPs, amongst which three types were classified based on their homozygous and heterozygous status in each sample. Confidently called SNPs were extracted from each Unigene and SNP frequencies were calculated by dividing the Unigene length by its number of SNPs. Histograms of SNP numbers and frequencies per Unigene, in addition to boxplots and ANOVA analysis of SNP frequency for each category, were performed using an R script (R Development Core Team, 2008).
For the GO enrichment analysis, a hypergeometric test with Bonferroni adjustment was used to identify enriched GO terms for Unigenes containing the pairwise SNPs, where the reference Unigene set served as the background. Terms were defined as enriched when adjusted p-values were less than 0.01.
SNP Validation
Primers were designed to amplify fragments spanning one or two SNPs in 50 randomly selected Unigenes identified as containing pairwise SNPs by RNA-seq. Two DNA samples from individual SPT and NM plants served as templates for validation the predicted SNPs. ExTaq (TaKaRa, Dalian, China) was used to amplify the fragments with 1.5 μl template DNA in 20 μl reaction volume. The PCR reaction was performed in a C1000 TOUCH thermal cycler and the amplified products were sequenced using an ABI Prism 3730xl sequencer at Majorbio (Shanghai, China).
Population Samples, Candidate Gene Sequencing, and Genetic Diversity Analyses
A total of 60 individuals from 10 natural populations (FK, DH, QHH, YJ, M4, MQ, SPT, JB, DLSH, NM) as described in Qian et al. (2016) were used to determine the genetic diversity of the three candidate genes (HsfA1d, DAR1, LHY, and ELF3). Samples from two individual plants from the SPT and NM populations were first amplified and sequenced in both directions to confirm the suitability of primers for population sequencing. PCR and sequencing were performed as described above. Population sequencing results for each candidate gene were aligned using BioEdit version 7.2.5 (Hall, 1999). After removing poor quality nucleotide sequence at the 5′ and 3′ termini, alignment files were subjected to further analysis of diversity indices using DnaSP version 5.10.01 (Librado and Rozas, 2009).
Results
Transcriptome Assembly and Annotation
An NM sand rice transcriptome library was constructed by mixing shoot and root RNA in a 1:1 ratio and pair-ended sequencing yielded 16.4 million clean reads. These reads were assembled, together with those from an individual sand rice plant from the SPT region (SRR1559276, Zhao et al., 2014) and a total of 91,884 Unigene were finally obtained with an average length of 725.98 bp and an N50 length of 1220 bp (Figure 2A). The average GC content was 39.14, and 69.36% of the total Unigenes had GC contents more than 35% (Figure 2B). All Unigenes were then blasted against six public protein databases, including the Nr, Swissprot, COG, GO, KOG, and KEGG, with a threshold of less than 1E-5. To increase the number of annotated Unigenes, predicted proteins were also aligned with the Pfam database. As shown in Table 1, 34,939 Unigenes (38.02%) could be matched to protein sequences or domains available in these databases.
FIGURE 2.
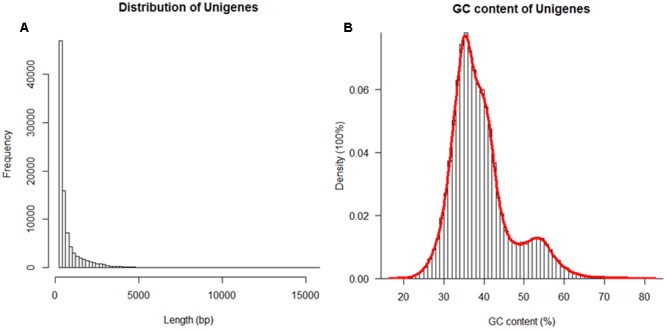
Histograms of the length (A) and the GC content of total assembled sand rice Unigenes. The red line in (B) indicates the density distribution.
Table 1.
Summary of Unigenes annotation.
| Annotation database | Annotated number | Length ≥ 300 bp | Length ≥ 1000 bp |
|---|---|---|---|
| COG | 11,985 | 9,939 | 6,009 |
| GO | 18,973 | 15,037 | 8,244 |
| KEGG | 7,148 | 5,851 | 3,431 |
| KOG | 18,988 | 15,620 | 8,815 |
| Pfam | 21,641 | 18,910 | 12,138 |
| SWISS | 20,343 | 17,670 | 10,851 |
| Nr | 34,526 | 27,639 | 14,381 |
| Total | 34,939 | 27,841 | 14,403 |
Pairwise SNP Detection, Statistical Analyses, and GO Annotation
The clean reads from NM and SPT samples were re-mapped to the assembled reference Unigene set and SNPs were detected using GATK with default settings (McKenna et al., 2010). After quality filtering, a total of 111,971 and 119,702 SNPs were identified in NM and SPT individuals, respectively (Supplementary Table 1). The pairwised SNPs between NM and SPT were then isolated and classified into three types (Figure 3): 81,980 were inter-individual, which were homozygous in both samples; 3,499 were specific to NM, 20,389 to SPT, these were heterozygous in one individual but homozygous in the other. Fifty Unigenes were randomly selected for validation the predicted SNPs, of which 30 were successfully amplified and sequenced. The failed amplication might be from amplicons spanned a large intron or primers located at the exon/intron boundaries. Finally, 38 out of 50 SNPs were validated in these 30 Unigenes and another six were confirmed as homozygous SNPs. The predicting accuracy of our SNP dataset reached 76% (Supplementary Figure 2).
FIGURE 3.
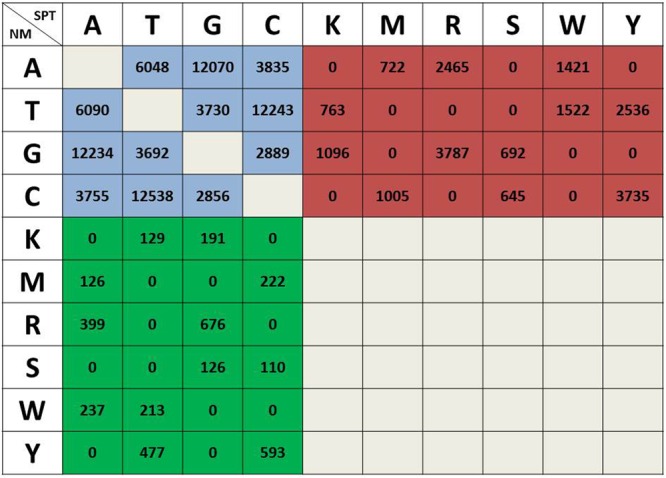
Classification and statistical analysis of pairwise SNPs between sand rice individuals from the NM and SPT regions. The three different background colors represent three types of pairwise SNPs between the two individuals and the number of each type of SNP is presented in each cell. Blue, inter-individual SNPs; green, NM specific SNPs; red, SPT specific SNPs. K, T/G; M, A/C; R, A/G; S, G/C; W, A/T; Y, T/C.
Single nucleotide polymorphism distribution and frequency are important indices for genome wide SNP development. In this study, all pairwise SNPs were distributed in 24,712 of 91,884 reference Unigenes, with approximately 57% (14,130) containing fewer than three SNPs (Figure 4A). A histogram of SNP frequency revealed a peak at 0.2 and 61.24% Unigenes were under the average SNP frequency of 0.3% (Figure 4B). Among the 24,712 Unigenes, 22,538 contained inter-individual SNPs, and 1,534 and 9,278 contained NM- and SPT-specific SNPs, respectively (Figure 4C). There were 16,756 Unigenes containing only one type of SNP, while 682 had all three types. Categories were named according to the gene number in each set in the Venn diagram (Figure 5). The mean SNP frequency values for all categories were lower than 0.45%; however, the four categories (SR_682, SR_6614, SR_465, and SR_195) including two or three types of SNP, exhibited higher frequencies than the other categories (p < 0.01; Figure 5). Detailed histograms illustrating SNP numbers and frequencies for each category are presented in Supplementary Figure 3.
FIGURE 4.
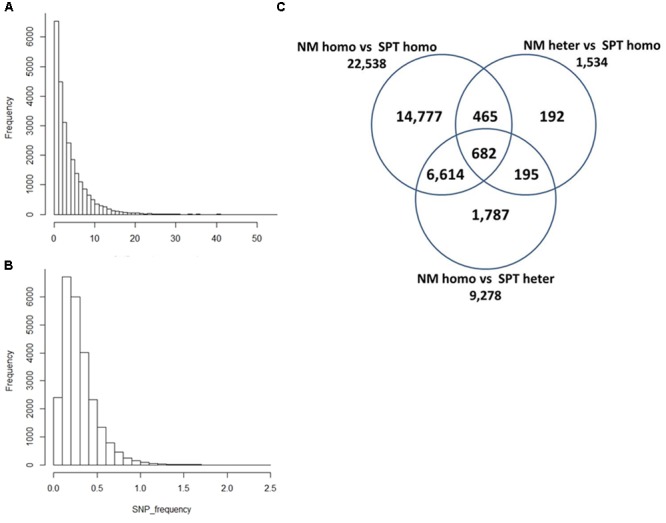
Histograms of pairwise SNP number and frequency in sand rice transcriptomes and a Venn diagram of Unigenes containing different types of pairwise SNPs. The SNP number (A) and frequency (B) per Unigene are presented. SNP frequency = Number of SNPs in each Unigene/corresponding Unigene length × 100%; (C) 24,712 Unigenes were classified into seven categories based on types of SNP in each Unigene. For example, 14,777 Unigenes contained only inter-individual SNPs and 682 Unigenes contained all three types of SNPs. The categories were named after the number of Unigenes in each category (e.g., SR_14777).
FIGURE 5.
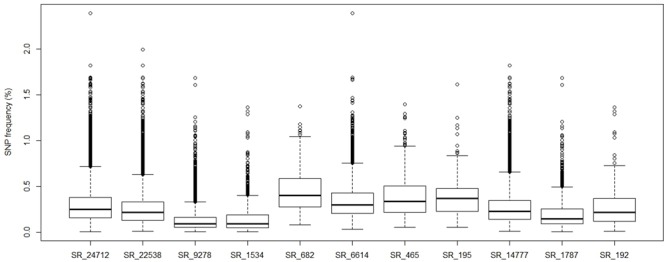
Boxplot of pairwise sand rice SNP frequencies in each of the SNP defined Unigene categories described in Figure 4.
Genes in each category (Figure 4C) were separately subjected to GO enrichment analysis (Table 2 and Supplementary Table 2). For the whole Unigene set (SR_24712), the most enriched GO terms were related to basic biology processes, including ‘DNA integration,’ ‘RNA-dependent DNA replication,’ and ‘translation.’ The GO enrichment results for inter-individual category (SR_22538) were similar to those for SR_24712, except they also included ‘translation elongation’ (GO: 0006414, p = 0.04). The GO term, ‘DNA recombination’ (GO: 0006310) was enriched for NM-specific category (SR_1534, p = 0.02) and not for any of the other categories. Interestingly, the GO term, ‘thylakoid membrane organization’ (GO: 0010027), was found in the enrichment results of SPT-specific category (SR_9278) and SR_24712, suggesting genes in SR_6614 were largely responsible for this annotation (p = 0.03). SR_14777 included only genes containing inter-individual SNPs (Figure 4C) and was enriched for seven GO terms, including ‘response to misfolded protein’ (GO: 0051788) and ‘response to cold’ (GO: 0009409). Of note, the GO term ‘embryo development ending in seed dormancy’ (GO: 0009793) was also enriched in categories SR_24712, SR_22538, and SR_14777.
Table 2.
Gene ontology enrichment results of SR_24712 and SR_14777 categories.
| GO ID | GO term | p-values | adj-p-values |
|---|---|---|---|
| SR_24712 | |||
| GO:0015074 | DNA integration | 8.00E-17 | 1.61E-13 |
| GO:0006278 | RNA-dependent DNA replication | 1.27E-11 | 2.54E-08 |
| GO:0006412 | Translation | 2.28E-09 | 4.57E-06 |
| GO:0055085 | Transmembrane transport | 2.60E-08 | 5.20E-05 |
| GO:0009793 | Embryo development ending in seed dormancy | 3.17E-07 | 0.000635 |
| GO:0019288 | Isopentenyl diphosphate biosynthetic process, methylerythritol 4-phosphate pathway | 7.49E-07 | 0.001498 |
| GO:0043581 | Mycelium development | 2.17E-06 | 0.004338 |
| GO:0006357 | Regulation of transcription from RNA polymerase II promoter | 3.71E-06 | 0.007416 |
| GO:0006259 | DNA metabolic process | 5.39E-06 | 0.010762 |
| GO:0010027 | Thylakoid membrane organization | 2.09E-05 | 0.041638 |
| SR_14777 | |||
| GO:0015074 | DNA integration | 4.30E-15 | 6.53E-12 |
| GO:0006278 | RNA-dependent DNA replication | 3.26E-09 | 4.94E-06 |
| GO:0051788 | Response to misfolded protein | 8.55E-07 | 0.001297 |
| GO:0055085 | Transmembrane transport | 2.96E-06 | 0.00449 |
| GO:0009793 | Embryo development ending in seed dormancy | 6.57E-06 | 0.00994 |
| GO:0009409 | Response to cold | 1.00E-05 | 0.015188 |
| GO:0006412 | Translation | 1.29E-05 | 0.019432 |
Candidate Genes Relevant to Heat Tolerance and Agronomic Traits
To isolate candidate genes for heat tolerance and agronomic traits, an all-against-all blast approach was conducted (described in Zhao et al., 2014) between the assembled sand rice Unigenes and the Arabidopsis protein database, resulting in the identification of 10,512 pairs of reciprocal best hits (RBHs) (Figure 6 and Supplementary Table 3). A Literature survey identified 64 heat shock proteins (HSPs), 21 HSFs, 366 flowering-, 59 seed size-, and 21 architecture-related genes in Arabidopsis (Finka et al., 2011; Scharf et al., 2012; Kesavan et al., 2013; Xiao et al., 2013; Dong and Wang, 2015; Li and Li, 2015, 2016; Teichmann and Muhr, 2015) and 31 HSPs, 11 HSFs, 100 flowering-, 28 seed size-, and 11 architecture-related genes had RBHs in the sand rice transcriptome, with mean sequence identities ranging from 50.88 to 64.09% (Figure 6 and Supplementary Table 3). Notably, only two Hsf1A sequences were identified in sand rice. Coincidently, the DA1 was missing from sand rice, while DAR1 was present. These lines of evidence imply that the gene families encoding these proteins may not have undergone expansion during sand rice speciation (Zhao et al., 2014). Furthermore, 41 genes with clear functions in the domestication of crop plants, including teosinte branched 1 in maize (Doebley et al., 1997), ring-type E3 ubiquitin ligase in rice (GW2; Song et al., 2007), non-brittle rachis 1 and 2 in barley (Pourkheirandish et al., 2015), tannin1 in sorghum (Wu et al., 2012), were blasted against the sand rice Unigene set, resulting in the identification of 39 RBHs with an average sequence identity of 53.78% (Figure 5 and Supplementary Table 3). By comparison with SR_24712 category, 30 HSPs, 11 HSFs, 96 flowering-, 26 seed size-, 11 architecture-, and 32 domestication-related genes containing at least one type of SNPs, were identified (Supplementary Table 3).
FIGURE 6.
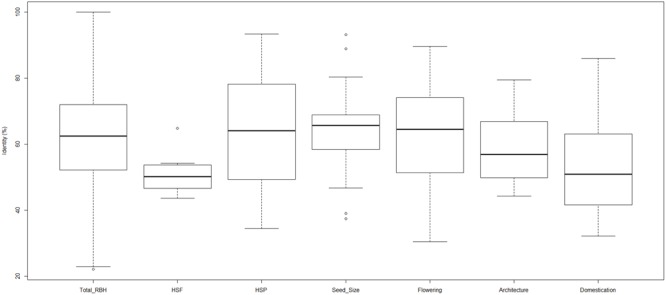
Boxplot of sequence identity values for total reciprocal best hits (RBHs), heat-shock transcription factor (HSF), heat shock protein (HSP), seed size, flowering, architecture, and domestication proteins between Arabidopsis and sand rice.
Genetic Diversity of HsfA1d, DAR1, LHY, and ELF3 in Natural Populations
Phylogeographic analysis has revealed that sand rice originated from the Gurbantunggut desert and then dispersed into the central desert region and eastern sandy lands in China (Qian et al., 2016). In this study, 10 natural populations (Figure 7) from the Gurbantunggut desert (FK), Kumutage desert (DH), Qinghai-Tibetan Plateau (QHH and YJ), central deserts (M4, MQ, SPT, JB, DLSH), and eastern sandy regions (NM), were used to investigate the genetic diversity of four candidate genes. Six genotypes in each population were sequenced and the successful genotypes for each gene ranged from 51 to 54 (Table 3). The HsfA1d gene was conserved in nine populations, with a single transversion SNP (T/A) leading to an amino acid change (Glutamate/Aspartate) detected in NM population (Figure 8). Alignment based on the RBH results demonstrated that this SNP was located between the regions encoding the transactivation domain (AHA) and the nuclear export signal (NES) at the C terminus of Arabidopsis HsfA1d. For the seed size gene DAR1, an intron (125 bp) was included in the PCR products and population sequencing identified a single transversion SNP (G/C), specific to the NM population. This synonymous SNP encoded an amino acid located between the LIM and the LIM-associated C-terminal domains (Supplementary Figure 4). Similarly, an 86 bp intron was included in the LHY amplicons and four SNPs were obtained from across the 10 sand rice populations, of which three were transitions (T/C, C/T, and T/C) and one was a transversion (A/T) leading to an amino acid change (Glutamine/Histidine; Supplementary Figure 5). Two transition SNPs were detected in the ELF3 gene. One SNP (G/A) was NM-specific and synonymous, while the other (C/T) was observed in five of six genotypes in the JB population and encode an Alanine to Valine amino acid substitution (Supplementary Figure 6). The aligned sequences for each gene were further subjected to analysis of nucleotide and haplotype diversity using DnaSP. Consistent with the numbers of SNP, nucleotide diversity values for all three genes were very low, ranging from 0.00032 (HsfA1d) to 0.00118 (LHY), while haplotype diversity ranged from 0.208 (HsfA1d) to 0.352 (ELF3).
FIGURE 7.
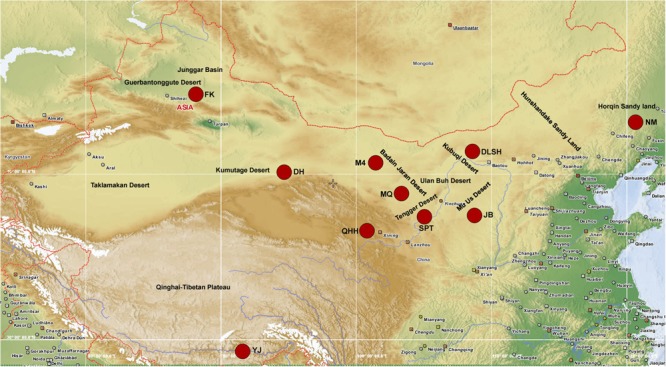
Sampling sites. This map was generated using PopART-1.7 (Bandelt et al., 1999) based on the latitude and longitude of each population.
Table 3.
Nucleotide and haplotype diversity of four genes in 10 natural populations.
| Candidate gene | HsfA1d | DAR1 | ELF3 | LHY |
|---|---|---|---|---|
| Expected length (bp) | 810 | 539 | 699 | 866 |
| PCR length (bp) | 810 | 664 | 699 | 952 |
| Sequence length (bp) | 654 | 459 | 626 | 849 |
| No. of genotypes | 52 | 51 | 54 | 53 |
| No. of indels | 0 | 0 | 0 | 0 |
| Indel frequency | 0 | 0 | 0 | 0 |
| No. of SNPs | 1 | 1 | 2 | 4 |
| Transition | 0 | 0 | 2 | 3 |
| Transversion | 1 | 1 | 0 | 1 |
| SNP frequency | 1/654 | 1/459 | 1/313 | 1/212 |
| Nucleotide diversity (Pi) | 0.00032 | 0.00046 | 0.00059 | 0.00118 |
| Watterson’s parameter (𝜃w) | 0.00034 | 0.00048 | 0.0007 | 0.0009 |
| No. of haplotypes | 2 | 2 | 3 | 3 |
| Haplotype diversity | 0.208 | 0.212 | 0.352 | 0.312 |
FIGURE 8.
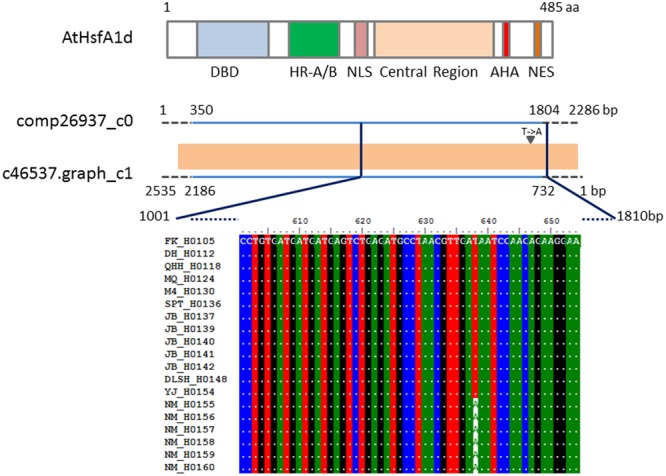
Schematic of Arabidopsis and sand rice HsfA1d protein structure and multiple sequence alignment results. The Arabidopsis HsfA1d protein (AtHsfA1d) structure is adapted from Ohama et al. (2015); the DNA-binding domain (DBD), oligomerization domain (HR-A/B), nuclear localization signal (NLS), transactivation domain (AHA), and nuclear export signal (NES) are indicated. Based on the RBH results, one previously assembled Unigene sequence (comp26937_c0, 2286 bp; Zhao et al., 2014) and one Unigene identified in this study (c46537.graph_c1, 2535 bp) are indicated by lines. The orange rectangle represents a region of identity between the two Unigenes. Sky-blue lines represent similar regions (350–1804 bp in comp26937_c0 and 2186–732 bp in c46537.graph_c1) between the AtHsfa1d protein and sand rice Unigenes. The vertical dark blue lines indicate the fragment (1001–1810 bp), that was amplified from sand rice samples from 10 natural populations. The multiple sequence alignment includes all of the successful sequencing results for the JB and NM populations, along with representative sequences from each of the eight other populations. The arrowhead indicates the T/A SNP.
Discussion
Dissection of the genetic variation of sand rice is essential for understanding its extreme stress tolerance and phenotypic variability and will facilitate its future domestication. In this study, a total of 105,868 pairwise SNPs, distributed in 24,712 Unigenes, were identified between SPT and NM samples, with an average SNP frequency of 0.3% (Figures 2, 3). There were a larger number of SNPs specific to SPT (81,980 in 9,278 Unigenes) than to NM (3,499 in 1,534 Unigenes), implying that sand rice in the SPT region may exhibit a higher degree of outcrossing, and, consequently, increased genomic heterozygosity. GO enrichment analysis identified only one term (GO: 0006310, ‘DNA recombination’) significantly enriched for SR_1534 (Table 2), suggesting that variations in specific genes were required for the survival of the NM population in the semi-arid environment.
Environmental stresses, such as drought, heat, and salinity, adversely affect plant photosynthesis (Nouri et al., 2015). The thylakoid membrane is the primary site of photosynthesis inside chloroplasts and its molecular organization is vital for the coordination and regulation of photosynthetic processes (Nouri et al., 2015). Given that SPT is an arid, desert environment, it is logical that the GO term ‘thylakoid membrane organization’ is enriched in the SPT specific category (SR_9278). Two terms associated with the response to misfolded protein (GO: 0051788) and cold (GO: 0009409) were identified as enriched in the inter-individual category (SR_14777). These results may provide evidence that common genetic modules are shared in natural populations, whereas different alleles are favored by direction selection pressure resulting from the prevailing environmental conditions in the NM and SPT regions. Another abundant term in SR_14777 was ‘embryo development ending in seed dormancy’ (GO: 0009793), which is consistent with a survival strategy to cope with sand bury and unpredictable precipitation typical in the geographic range of sand rice (Tobe et al., 2005; Zheng et al., 2005; Liu et al., 2006; Gao et al., 2014).
In Arabidopsis, numerous genes have been identified with important roles in stress responses and controlling agronomic traits, such as large seed size, plant architecture, and earlier flowering. In this study, 10,512 pairs of orthologous genes were identified between Arabidopsis and sand rice (Supplementary Table 3). Among these, c48914.graph_c0 was included in the top 50 Unigenes with the highest numbers of SNPs; the ortholog in Arabidopsis was maintenance of methylation 1 (MOM1), which is involved in silencing the stress-induced expression of transposons and thereby in preventing the transgenerational transmission of epigenetic memory (Iwasaki and Paszkowski, 2014). It is possible that different alleles of MOM1 may have evolved in the NM and SPT sand rice populations to control epigenetic stress memory in the face of reoccurring heat- and other types of stress-induced damages. A number of orthologous genes in the sand rice transcriptome dataset that are candidates for involvement in the heat stress response and the control of agronomic traits are also listed in Supplementary Table 3, and the majority of them contained sequence variation between NM and SPT. Dissecting the genetic diversity of these candidate genes and analyzing their association with phenotypic variability in natural populations is likely to result in the identification of important molecular markers and/or favorable alleles, and to facilitate the domestication process of sand rice.
The sequence identity value (54%) between Arabidopsis HsfA1d and sand rice c46537.graph_c1 suggests that these genes may encode functionally equivalent proteins involved in heat stress tolerance. Quantitative RT-PCR revealed that the expression pattern of c46537.graph_c1 was similar to that of Arabidopsis HsfA1d after heat stress treatment (Supplementary Figure 7). A fragment of c46537.graph_c1 was analyzed in 10 natural populations, resulting in the identification of a single unique allele in the NM population. Similarly, only one synonymous SNP was detected in sand rice DAR1 by population sequencing. These results demonstrate that the same HsfA1d and DAR1 haplotypes were shared by plants in the central deserts and that genetic divergence has mainly occurred between NM and the other populations. Both of the SNPs in HsfA1d and DAR1 located in sequences encoding inter-domain protein regions, hence it is difficult to predict the effect of these SNPs on sand rice adaptation based on knowledge of protein domain functions determined in Arabidopsis. The non-synonymous SNP in HsfA1d may compromise the trimer formation (HsfA1a, b, and d), resulting in ineffective activation of the transcription network, which would be consistent with the reduced heat tolerance phenotype associated with NM plants (Zhao et al., 2014).
LHY and ELF3 are important regulators of the circadian rhythm (Hicks et al., 1996; Nusinow et al., 2011; Hsu and Harmer, 2014). The eastern sandy population (NM) harbored specific LHY and ELF3 alleles which were separated from other populations. These results suggest that variants in these two genes could confer some fitness advantage, such as early flowering, in the semi-arid environment. Furthermore, two transition SNPs of LHY, were shared between JB and NM populations. This is congruent with the speculation that the sand rice colonization pathway originated from the Gurbantunggut desert and subsequently dispersed into other desert regions (Qian et al., 2016).
Author Contributions
PZ conceived and designed the project. JZ prepared the RNA for sequencing. CQ and X-FM supplied the population DNA samples. QZ and XZ helped to perform experiments. PZ conducted the experiments, analyzed the results, and wrote the manuscript and GC revised the manuscript.
Conflict of Interest Statement
The authors declare that the research was conducted in the absence of any commercial or financial relationships that could be construed as a potential conflict of interest.
Acknowledgments
We thank Dr. Lirong Wang for her help on the seed sampling and sand rice growth.
Footnotes
Funding. This work was granted by one of National Basic Research Program of China (973 Program, 2013CB429904), by National Natural Science Foundation of China (No. 41201048) and by Natural Science Foundation of Gansu Province, China (No. 1208RJZA244).
Supplementary Material
The Supplementary Material for this article can be found online at: http://journal.frontiersin.org/article/10.3389/fpls.2017.00536/full#supplementary-material
References
- Alonso-Blanco C., Aarts M. G., Bentsink L., Keurentjes J. J., Reymond M., Vreugdenhil D., et al. (2009). What has natural variation taught us about plant development, physiology, and adaptation? Plant Cell 21 1877–1896. 10.1105/tpc.109.068114 [DOI] [PMC free article] [PubMed] [Google Scholar]
- Bandelt H. J., Forster P., Röhl A. (1999). Median-joining networks for inferring intraspecific phylogenies. Mol. Biol. Evol. 16 37–48. [DOI] [PubMed] [Google Scholar]
- Bokszczanin K. L., Solanaceae Pollen Thermotolerance Initial Training Network Consortium and Fragkostefanakis S. (2013). Perspectives on deciphering mechanisms underlying plant heat stress response and thermotolerance. Front. Plant Sci. 4:315 10.3389/fpls.2013.00315 [DOI] [PMC free article] [PubMed] [Google Scholar]
- Chen G., Zhao J., Zhao X., Zhao P., Duan R., Nevo E., et al. (2014). A psammophyte Agriophyllum squarrosum (L.) Moq.: a potential food crop. Genet. Resour. Crop Evol. 61 669–676. 10.1007/s10722-014-0083-8 [DOI] [Google Scholar]
- Dobin A., Davis C. A., Schlesinger F., Drenkow J., Zaleski C., Jha S., et al. (2013). STAR: ultrafast universal RNA-seq aligner. Bioinformatics 29 15–21. 10.1093/bioinformatics/bts635 [DOI] [PMC free article] [PubMed] [Google Scholar]
- Doebley J., Stec A., Hubbard L. (1997). The evolution of apical dominance in maize. Nature 386 485–488. [DOI] [PubMed] [Google Scholar]
- Dong Y., Wang Y. Z. (2015). Seed shattering: from models to crops. Front. Plant Sci. 6:476 10.3389/fpls.2015.00476 [DOI] [PMC free article] [PubMed] [Google Scholar]
- Eddy S. R. (1998). Profile hidden Markov models. Bioinformatics 14 755–763. 10.1093/bioinformatics/14.9.755 [DOI] [PubMed] [Google Scholar]
- Finka A., Mattoo R. U., Goloubinoff P. (2011). Meta-analysis of heat- and chemically upregulated chaperone genes in plant and human cells. Cell Stress Chaperones 16 15–31. 10.1007/s12192-010-0216-8 [DOI] [PMC free article] [PubMed] [Google Scholar]
- Fornara F., de Montaigu A., Coupland G. (2010). SnapShot: control of flowering in Arabidopsis. Cell 141 550 550e1–2. 10.1016/j.cell.2010.04.024 [DOI] [PubMed] [Google Scholar]
- Gao Q. (2002). The “grass seed” is Agriophyllum squarrosum in Dunhuang manuscripts. J. Dunhuang Stud. 42 43–44. [Google Scholar]
- Gao R., Yang X., Yang F., Wei L., Huang Z., Walck J. L. (2014). Aerial and soil seed banks enable populations of an annual species to cope with an unpredictable dune ecosystem. Ann. Bot. 114 279–287. 10.1093/aob/mcu104 [DOI] [PMC free article] [PubMed] [Google Scholar]
- Grabherr M. G., Haas B. J., Yassour M., Levin J. Z., Thompson D. A., Amit I., et al. (2011). Full-length transcriptome assembly from RNA-Seq data without a reference genome. Nat. Biotechnol. 29 644–U130. 10.1038/nbt.1883 [DOI] [PMC free article] [PubMed] [Google Scholar]
- Hall T. A. (1999). BioEdit: a user-friendly biological sequence alignment editor and analysis program for Windows 95/98/NT. Nucleic Acids Symp. Ser. 41 95–98. [Google Scholar]
- Hancock A. M., Brachi B., Faure N., Horton M. W., Jarymowycz L. B., Sperone F. G., et al. (2011). Adaptation to Climate Across the Arabidopsis thaliana Genome. Science 334 83–86. 10.1126/science.1209244 [DOI] [PubMed] [Google Scholar]
- Henry R. J. (2014). Genomics strategies for germplasm characterization and the development of climate resilient crops. Front. Plant Sci. 5:68 10.3389/fpls.2014.00068 [DOI] [PMC free article] [PubMed] [Google Scholar]
- Hicks K. A., Millar A. J., Carré I. A., Somers D. E., Straume M., Meeks-Wagner D. R., et al. (1996). Conditional Circadian Dysfunction of the Arabidopsis early-flowering 3 Mutant. Science 274 790–792. 10.1126/science.274.5288.790 [DOI] [PubMed] [Google Scholar]
- Horton M. W., Hancock A. M., Huang Y. S., Toomajian C., Atwell S., Auton A., et al. (2012). Genome-wide patterns of genetic variation in worldwide Arabidopsis thaliana accessions from the RegMap panel. Nat. Genet. 44 212–216. 10.1038/ng.1042 [DOI] [PMC free article] [PubMed] [Google Scholar]
- Hsu P. Y., Harmer S. L. (2014). Wheels within wheels: the plant circadian system. Trends Plant Sci. 19 240–249. 10.1016/j.tplants.2013.11.007 [DOI] [PMC free article] [PubMed] [Google Scholar]
- Huang X., Wei X., Sang T., Zhao Q., Feng Q., Zhao Y., et al. (2010). Genome-wide association studies of 14 agronomic traits in rice landraces. Nat. Genet. 42 961–967. 10.1038/ng.695 [DOI] [PubMed] [Google Scholar]
- Iwasaki M., Paszkowski J. (2014). Identification of genes preventing transgenerational transmission of stress-induced epigenetic states. Proc. Natl. Acad. Sci. U.S.A. 111 8547–8552. 10.1073/pnas.1402275111 [DOI] [PMC free article] [PubMed] [Google Scholar]
- Kesavan M., Song J. T., Seo H. S. (2013). Seed size: a priority trait in cereal crops. Physiol. Plant. 147 113–120. 10.1111/j.1399-3054.2012.01664.x [DOI] [PubMed] [Google Scholar]
- Kump K. L., Bradbury P. J., Wisser R. J., Buckler E. S., Belcher A. R., Oropeza-Rosas M. A., et al. (2011). Genome-wide association study of quantitative resistance to southern leaf blight in the maize nested association mapping population. Nat. Genet. 43 163–168. 10.1038/ng.747 [DOI] [PubMed] [Google Scholar]
- Lai J., Li R., Xu X., Jin W., Xu M., Zhao H., et al. (2010). Genome-wide patterns of genetic variation among elite maize inbred lines. Nat. Genet. 42 1027–1030. 10.1038/ng.684 [DOI] [PubMed] [Google Scholar]
- Lasky J. R., Des Marais D. L., McKay J. K., Richards J. H., Juenger T. E., Keitt T. H. (2012). Characterizing genomic variation of Arabidopsis thaliana: the roles of geography and climate. Mol. Ecol. 21 5512–5529. 10.1111/j.1365-294X.2012.05709.x [DOI] [PubMed] [Google Scholar]
- Li N., Li Y. (2015). Maternal control of seed size in plants. J. Exp. Bot. 66 1087–1097. 10.1093/jxb/eru549 [DOI] [PubMed] [Google Scholar]
- Li N., Li Y. (2016). Signaling pathways of seed size control in plants. Curr. Opin. Plant Biol. 33 23–32. 10.1016/j.pbi.2016.05.008 [DOI] [PubMed] [Google Scholar]
- Librado P., Rozas J. (2009). DnaSP v5: a software for comprehensive analysis of DNA polymorphism data. Bioinformatics 25 1451–1452. 10.1093/bioinformatics/btp187 [DOI] [PubMed] [Google Scholar]
- Liu Z., Yan Q., Baskin C. C., Ma J. (2006). Burial of canopy-stored seeds in the annual psammophyte Agriophyllum squarrosum Moq. (Chenopodiaceae) and its ecological significance. Plant Soil 288 71–80. 10.1007/s11104-006-9090-7 [DOI] [Google Scholar]
- Lobell D. B., Gourdji S. M. (2012). The influence of climate change on global crop productivity. Plant Physiol. 160 1686–1697. 10.1104/pp.112.208298 [DOI] [PMC free article] [PubMed] [Google Scholar]
- Lobell D. B., Schlenker W., Costa-Roberts J. (2011). Climate trends and global crop production since 1980. Science 333 616–620. 10.1126/science.1204531 [DOI] [PubMed] [Google Scholar]
- Mayes S., Massawe F. J., Alderson P. G., Roberts J. A., Azam-Ali S. N., Hermann M. (2012). The potential for underutilized crops to improve security of food production. J. Exp. Bot. 63 1075–1079. 10.1093/jxb/err396 [DOI] [PubMed] [Google Scholar]
- McCouch S., Baute G. J., Bradeen J., Bramel P., Bretting P. K., Buckler E., et al. (2013). Feeding the future. Nature 499 23–24. [DOI] [PubMed] [Google Scholar]
- McKenna A., Hanna M., Banks E., Sivachenko A., Cibulskis K., Kernytsky A., et al. (2010). The genome analysis toolkit: a MapReduce framework for analyzing next-generation DNA sequencing data. Genome Res. 20 1297–1303. 10.1101/gr.107524.110 [DOI] [PMC free article] [PubMed] [Google Scholar]
- McNally K. L., Childs K. L., Bohnert R., Davidson R. M., Zhao K., Ulat V. J., et al. (2009). Genomewide SNP variation reveals relationships among landraces and modern varieties of rice. Proc. Natl. Acad. Sci. U.S.A. 106 12273–12278. 10.1073/pnas.0900992106 [DOI] [PMC free article] [PubMed] [Google Scholar]
- Mitchell-Olds T., Schmitt J. (2006). Genetic mechanisms and evolutionary significance of natural variation in Arabidopsis. Nature 441 947–952. 10.1038/nature04878 [DOI] [PubMed] [Google Scholar]
- Nouri M. Z., Moumeni A., Komatsu S. (2015). Abiotic stresses: insight into gene regulation and protein expression in photosynthetic pathways of plants. Int. J. Mol. Sci. 16 20392–20416. 10.3390/ijms160920392 [DOI] [PMC free article] [PubMed] [Google Scholar]
- Nusinow D. A., Helfer A., Hamilton E. E., King J. J., Imaizumi T., Schultz T. F., et al. (2011). The ELF4-ELF3-LUX complex links the circadian clock to diurnal control of hypocotyl growth. Nature 475 398–402. 10.1038/nature10182 [DOI] [PMC free article] [PubMed] [Google Scholar]
- Ohama N., Kusakabe K., Mizoi J., Zhao H., Kidokoro S., Koizumi S., et al. (2015). The transcriptional cascade in the heat stress response of Arabidopsis is strictly regulated at the expression levels of transcription factors. Plant Cell 28 181–201. 10.1105/tpc.15.00435 [DOI] [PMC free article] [PubMed] [Google Scholar]
- Ohama N., Sato H., Shinozaki K., Yamaguchi-Shinozaki K. (2016). Transcriptional regulatory network of plant heat stress response. Trends Plant Sci. 22 53–65. 10.1016/j.tplants.2016.08.015 [DOI] [PubMed] [Google Scholar]
- Pavy N., Gagnon F., Deschenes A., Boyle B., Beaulieu J., Bousquet J. (2016). Development of highly reliable in silico SNP resource and genotyping assay from exome capture and sequencing: an example from black spruce (Picea mariana). Mol. Ecol. Resour. 16 588–598. 10.1111/1755-0998.12468 [DOI] [PubMed] [Google Scholar]
- Pourkheirandish M., Hensel G., Kilian B., Senthil N., Chen G., Sameri M., et al. (2015). Evolution of the grain dispersal system in barley. Cell 162 527–539. 10.1016/j.cell.2015.07.002 [DOI] [PubMed] [Google Scholar]
- Qian C., Yin H., Shi Y., Zhao J., Yin C., Luo W., et al. (2016). Population dynamics of Agriophyllum squarrosum, a pioneer annual plant endemic to mobile sand dunes, in response to global climate change. Sci. Rep. 6:26613 10.1038/srep26613 [DOI] [PMC free article] [PubMed] [Google Scholar]
- R Development Core Team (2008). R: A Language and Environment for Statistical Computing. Vienna: R Foundation for Statistical Computing. [Google Scholar]
- Scharf K. D., Berberich T., Ebersberger I., Nover L. (2012). The plant heat stress transcription factor (Hsf) family: structure, function and evolution. Biochim. Biophys. Acta 1819 104–119. 10.1016/j.bbagrm.2011.10.002 [DOI] [PubMed] [Google Scholar]
- Silva-Junior O. B., Rosado T. B., Laviola B. G., Pappas M. R., Pappas G. J., Grattapaglia D. (2011). Genome-wide SNP discovery from a pooled sample of accessions of the biofuel plant Jatropha curcas based on whole-transcriptome Illumina resequencing. BMC Proc. 5(Suppl. 7):57 10.1186/1753-6561-5-s7-p57 [DOI] [Google Scholar]
- Song X.-J., Huang W., Shi M., Zhu M.-Z., Lin H.-X. (2007). A QTL for rice grain width and weight encodes a previously unknown RING-type E3 ubiquitin ligase. Nat. Genet. 39 623–630. [DOI] [PubMed] [Google Scholar]
- Teichmann T., Muhr M. (2015). Shaping plant architecture. Front. Plant Sci. 6:233 10.3389/fpls.2015.00233 [DOI] [PMC free article] [PubMed] [Google Scholar]
- Tester M., Langridge P. (2010). Breeding technologies to increase crop production in a changing world. Science 327 818–822. 10.1126/science.1183700 [DOI] [PubMed] [Google Scholar]
- Tobe K., Zhang L., Omasa K. (2005). Seed germination and seedling emergence of three annuals growing on desert sand dunes in China. Ann. Bot. 95 649–659. 10.1093/aob/mci060 [DOI] [PMC free article] [PubMed] [Google Scholar]
- van Heerwaarden J., Doebley J., Briggs W. H., Glaubitz J. C., Goodman M. M., de Jesus Sanchez Gonzalez J., et al. (2011). Genetic signals of origin, spread, and introgression in a large sample of maize landraces. Proc. Natl. Acad. Sci. U.S.A. 108 1088–1092. 10.1073/pnas.1013011108 [DOI] [PMC free article] [PubMed] [Google Scholar]
- Verhage L., Angenent G. C., Immink R. G. H. (2014). Research on floral timing by ambient temperature comes into blossom. Trends Plant Sci. 19 583–591. 10.1016/j.tplants.2014.03.009 [DOI] [PubMed] [Google Scholar]
- Wheeler T., von Braun J. (2013). Climate change impacts on global food security. Science 341 508–513. 10.1126/science.1239402 [DOI] [PubMed] [Google Scholar]
- Wu Y., Li X., Xiang W., Zhu C., Lin Z., Wu Y., et al. (2012). Presence of tannins in sorghum grains is conditioned by different natural alleles of Tannin1. Proc. Natl. Acad. Sci. U.S.A. 109 10281–10286. 10.1073/pnas.1201700109 [DOI] [PMC free article] [PubMed] [Google Scholar]
- Xiao D., Zhao J. J., Hou X. L., Basnet R. K., Carpio D. P. D., Zhang N. W., et al. (2013). The Brassica rapa FLC homologue FLC2 is a key regulator of flowering time, identified through transcriptional co-expression networks. J. Exp. Bot. 64 4503–4516. 10.1093/jxb/ert264 [DOI] [PMC free article] [PubMed] [Google Scholar]
- Yin C., Qian C., Chen G., Yan X., Ma X. F. (2016). The influence of selection of ecological differentiation to the phenotype polymorphism of Agriophyllum squarrosum. J. Desert Res. 36 364–373. [Google Scholar]
- Zhao P., Capella-Gutierrez S., Shi Y., Zhao X., Chen G., Gabaldon T., et al. (2014). Transcriptomic analysis of a psammophyte food crop, sand rice (Agriophyllum squarrosum) and identification of candidate genes essential for sand dune adaptation. BMC Genomics 15:872 10.1186/1471-2164-15-872 [DOI] [PMC free article] [PubMed] [Google Scholar]
- Zhao P., Zhang J., Zhao X., Chen G., Ma X. F. (2016). Different sets of post-embryonic development genes are conserved or lost in two Caryophyllales species (Reaumuria soongorica and Agriophyllum squarrosum). PLoS ONE 11:e0148034 10.1371/journal.pone.0148034.g001 [DOI] [PMC free article] [PubMed] [Google Scholar]
- Zheng Y., Xie Z., Yu Y., Jiang L., Shimizu H., Rimmington G. M. (2005). Effects of burial in sand and water supply regime on seedling emergence of six species. Ann. Bot. 95 1237–1245. 10.1093/aob/mci138 [DOI] [PMC free article] [PubMed] [Google Scholar]
- Zou X., Shi C., Austin R. S., Merico D., Munholland S., Marsolais F., et al. (2014). Genome-wide single nucleotide polymorphism and Insertion-Deletion discovery through next-generation sequencing of reduced representation libraries in common bean. Mol. Breed. 33 769–778. 10.1007/s11032-013-9997-7 [DOI] [Google Scholar]
Associated Data
This section collects any data citations, data availability statements, or supplementary materials included in this article.


