Abstract
Drug delivery in brain tumors is challenging because of the presence of blood-brain barrier (BBB) and the blood-tumor barrier (BTB). Focused ultrasound (FUS) combined with microbubbles can enhance the permeability of the BTB in brain tumors, as well as disrupting the BBB in the surrounding tissue. In this study, dynamic contrast-enhanced Magnetic Resonance Imaging (DCE-MRI) was used to characterize FUS-induced permeability changes in a rat glioma model and in the normal brain and to investigate the relationship between these changes and the resulting concentration of the chemotherapy agent doxorubicin (DOX). 9L gliosarcoma cells were implanted in both hemispheres in male rats. At day 10–12 after implantation, FUS-induced BTB disruption using 690 kHz ultrasound and Definity microbubbles was performed in one of the tumors and in a normal brain region in each animal. After FUS, DOX was administered at a dose of 5.67 mg kg−1. The resulting DOX concentration was measured via fluorometry at 1 or 24 hours after FUS. The transfer coefficient Ktrans describing extravasation of the MRI contrast agent Gd-DTPA was significantly increased in both the sonicated tumors and in the normal brain tissue (P<0.001) between the two DCE-MRI acquisitions obtained before and after FUS, while no significant difference was found in the controls (non-sonicated tumor/normal brain tissue). DOX concentrations were also significantly larger than controls in both the sonicated tumors and in the normal tissue volumes at 1 and 24 hours after sonication. The DOX concentrations were significantly larger (P<0.01) in the control tumors harvested 1 hour after FUS than in those harvested at 24 hours, when the tumor concentrations were not significantly different than in the non-sonicated normal brain. In contrast, there was no significant difference in the DOX concentrations between the tumors harvested at 1 and 24 hours after FUS or in the concentrations measured in the brain at these time points. The transfer coefficient Ktrans for Gd-DTPA and the drug concentrations showed a good linear correlation (R2 = 0.56). Overall, these data suggest that FUS and microbubbles can not only increase DOX delivery across the BBB and BTB, but that it is retained in the tissue at significantly enhanced levels for at least 24 hours. Such enhanced retention may increase the potency of this chemotherapy agent and allow for reduced systemic doses. Furthermore, MRI-based estimates of Gd-DTPA transport across these barriers might be useful to estimate local DOX concentrations in the tumor and in the surrounding normal tissue.
Graphical abstract
Introduction
Treatment of brain tumors remains a great challenge because of the presence of the blood-brain barrier (BBB) and the partially-intact blood-tumor barrier (BTB). These barriers preclude the effective passing of most chemotherapeutics from the blood circulation to the brain parenchyma and limit their delivery to tumors [1]. Different methods have been used to overcome those barriers and have had promising outcomes, but they all have been either invasive, non-targeted, or required the formulation of new drugs [2]. Focused ultrasound (FUS) has emerged with a great promise to temporarily permeabilize these vascular barriers and enable or enhance drug delivery for brain tumors and other disorders of the central nervous system [3]. When burst ultrasound is combined with microbubbles, mechanical effects produced by the acoustically activated microbubbles are localized to the vasculature and result in temporary opening of the BBB and BTB. This method is accessible transcranially without the need of invasive procedures because it can be achieved using low frequency ultrasound (<1MHz) that can penetrate the intact skull [4]. Several studies have been shown that FUS-induced BBB opening is safe, even with multiple sessions [5–9]. With the use of this technique, a wide range of imaging and therapeutic agents have been delivered into the brain [10–13] as well in tumor models in animals [14–17].
Given that the vascular density and permeability can vary substantially in tumors, it could be useful to have a method to predict and map how much drug is delivered to the targeted tissue volume. This can be achieved directly by radiolabeling drugs or by conjugating them to imaging contrast agents. It may also be possible to estimate drug delivery using a surrogate marker. Dynamic contrast-enhanced MRI (DCE-MRI) has been performed to estimate the spatial and temporal characteristics of BBB permeability after FUS [18,19]. The relationship between the delivery of MRI contrast agents and the resulting concentration of drugs or other tracers has been explored in normal brain and in murine tumor models [20–24]. These studies suggest that MRI contrast agents can predict drug or tracer concentrations in the normal brain, even when large drug carriers (liposomes) are used [11,22,25,26]. In a tumor model, others have found a good correlation between MRI contrast and Evan’s Blue delivery a rat tumor model [21,23]. However, we did not find such an agreement with between MRI contrast and liposomal doxorubicin delivery in tumors [24].
Along with concentration, the amount of time that a drug resides in the tissue after it extravasates may have an impact on its therapeutic efficacy. Clearance of drugs from the brain occurs through the “glymphatic” system [27]. This system, along with the transport of many substances back into the blood stream via drug efflux pumps such as P-glycoprotein [28,29], and other factors [30,31], result in a highly regulated chemical environment. These clearance mechanisms differ from what occurs in most other tissues and might affect how long different drugs are present in the brain or a brain tumor. It may also possible that ultrasound-induced effects could enhance this duration, through enabling greater drug penetration or by modulating drug efflux. If drug retention could be increased, it might allow for the use of a lower systemic drug dose.
The purpose of this work was to investigate drug concentrations at different time points in healthy brain tissue and in a brain tumor model after ultrasound-induced BBB/BTB permeabilization. We used free (unencapsulated) doxorubicin (DOX), a chemotherapy agent with a relatively low molecular weight (580 Da) that is cleared rapidly from the body after administration as a model drug. DOX concentrations were correlated with estimates of permeability changes for an MRI contrast agent made using DCE-MRI.
Materials and Methods
Animals
The experiments were approved by our institutional animal care and use committee. A total of 21 male Sprague-Dawley rats (Charles River Laboratories, Boston, MA; weight: 250–280 g) were used for this study. The animals were randomly divided into five groups (Table 1). Before each procedure, the rats were anesthetized with a mix of 80 mg/kg of ketamine (Aveco Co., Inc., Fort Dodge, IA) and 10 mg/kg of xylazine (Lloyd Laboratories, Shenandoah, IA) by i.p. injection. A catheter was placed in the tail vein for i.v. injection of microbubbles, MRI contrast agent, DOX, or Trypan blue.
Table 1.
Summary of the experimental groups
| Group number | Experimental purpose | No. of rats | Sonication (Right/Left) | Pressures amplitude (MPa) |
|---|---|---|---|---|
| 1 | Normal brain | 5 | 5/5 | 0.72 |
| 2 | Brain tumor-1 hr | 6 | 6/0 | 0.72 |
| 3 | Brain tumor-24hr | 5 | 5/0 | 0.72 |
| 4 | Histology | 2 | 2/0 | 0.72 |
| 5 | Sham Control/baseline signal |
3 | n/a | n/a |
9L cell implantation for brain tumor
The 9L rat gliosarcoma cell line was provided by the Neurosurgery Tissue Bank at The University of California-San Francisco. The cells were grown in Minimum Essential Medium (MEM) with Earle’s salts, supplemented with 10% heat-inactivated fetal bovine serum, 1% L-glutamine, 1% MEM nonessential amino acids, and 0.1 % gentamicin (Invitrogen, Carlsbad, CA) and maintained at 37°C in a humidified incubator containing 5% CO2. Rats were anesthetized, the hair on the scalp was removed with clippers and depilatory cream (Nair, Church & Dwight Co., Inc., Princeton, NJ), and the dorsal surface of the skull was sterilized with a povidone-iodine swab and alcohol. The head was immobilized in a stereotactic frame. After a skin incision to expose the skull, a 1 mm burr hole was drilled into the skull 2 mm lateral and 1 mm anterior of the bregma. Immediately before implantation, the 9L cells were trypsinized and resuspended in serum-free MEM, containing no additional supplements. A 10-μl Hamilton syringe (Hamilton, Reno, Nevada) was inserted 3.5 mm into the cerebral cortex. A 4μl volume of cell suspension (1×10⁵ cells in MEM) was injected over a 5 min period. After waiting 2 min, the needle was retracted slowly over another 5 min. The hole in the skull was sealed with bone wax (Ethicon, Somerville, New Jersey) to prevent leakage of the cerebrospinal fluid, and the incision was closed with 5-0 silk sutures (Ethicon, Somerville, New Jersey). Each animal was given a one-time dose of antibiotic (Baytril, 2.5 mg/kg; Bayer Healthcare, Wayne, New Jersey) and an analgesic (Buprenex, 0.05 mg/kg; Reckitt Benckiser Healthcare, Hull, England, UK) every 12 hr for 24 hr following the implantation by i.p. administration. The sutures were removed prior to sonication one week after tumor implantation.
Sonications
An air-backed, single-element, spherically-curved, piezoelectric transducer with a diameter of 100 mm, a radius of curvature of 80 mm, and a resonant frequency of 690 kHz (manufactured in-house) generated the ultrasound field. The absolute and relative peak negative pressure amplitudes were measured in a water tank with a calibrated 0.5-mm diameter membrane hydrophone (Marconi, Chelmsford, UK) and a 0.075-mm diameter needle hydrophone (Precision Acoustics, Dorchester, UK). The exposure conditions throughout the present study are given in peak rarefactional focal pressure (PRFP) amplitude in water. The half-maximum pressure amplitude width and length of the focal region for this transducer were 2.3 and 14 mm, respectively. The transducer was driven by a signal generated by an arbitrary waveform generator (Model 395, Wavetek Inc., San Diego, CA) and an RF amplifier (Model 240L, ENI Inc., Rochester, NY). The electrical impedance of the transducer was matched to the output impedance of the amplifier using an external inductor-capacitor tuning network. The electrical power was monitored with a power meter (Model E4419B, Agilent, Santa Clara, CA) and a dual-directional coupler (Werlatone, Patterson, NY). The transducer efficiency was measured with a radiation force balance consisting of an absorbing brush attached to a digital scale. The transducer was immersed in a tank of degassed water and mounted on an MR-compatible positioning system (Fig. 1A). The experiments were performed in a clinical 3T MRI scanner (General Electric Healthcare, Milwaukee, WI). MRI was used for image guidance and evaluation of BBBD/BTBD. The imaging was performed using a 7.5 cm diameter transmit/receive surface coil (constructed in-house).
Figure 1.
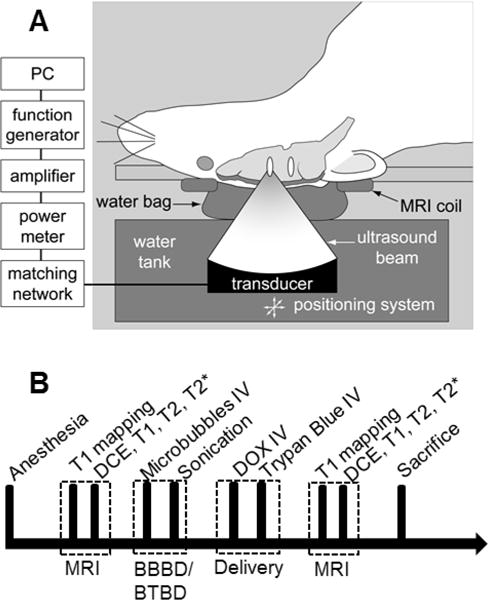
A. Schematic of the experimental set-up used to induce BBB/BTB disruption (BBBD/BTBD) in rats using FUS and microbubbles under MRI guidance. B. Experimental time line. MRI was performed to characterize the tumor size and the permeability of BBBD/BTBD before sonication. The sonications were performed at five locations in centered on the tumor in each rat. Each 60 s sonication started immediately after the microbubble injection. DOX and Trypan blue were administered immediately after the last sonication, and then MRI was performed to characterize the disruption and to detect any damage after the sonications. The rats were sacrificed at either 4 hours after sonications for histological analysis or 1 or 24 hours after sonication for DOX quantification.
Five targets in and around the tumor in right hemisphere were exposed to ultrasound (10 ms bursts period with at 1 Hz pulse repetition frequency for 60 s) transcranially into the brain of the rat, which laid in the supine position on the sonication system (Fig. 1A). The ultrasound power amplitude was 0.68–0.72 MPa. These exposure levels used were obtained from a prior safety study with this transducer in rats [7]. Similar locations in the tumor were selected in the left hemisphere. For the normal rats, similarly, five targets at each hemisphere were sonicated. Each sonication was applied synchronous to an IV bolus injection of the ultrasound contrast agent (Definity™, Lantheus Medical Imaging, N. Billerica, MA). Definity™ consists of a C3F8 gas encapsulated by an outer phospholipid shell. Immediately after activation, the suspension contains approximately 1.2×10¹⁰ microbubbles/mL with a mean diameter range of 1.1 μm–3.3 μm. For the current study, the solution was diluted 10 times in PBS and was injected IV at a dosage of 10 μl/kg, the recommended dose for clinical use with ultrasound imaging. The administration of Definity™ was followed by an injection of 0.2 mL normal saline (0.9% NaCl). Sonication of the individual locations was spaced at least 2 min apart to allow the agent to mostly clear from the vascular.
Delivery of DOX and trypan blue dye
Doxorubicin hydrochloride (DOX; Novaplus, Irving, TX) was used as a model drug to compare with the permeability characterization in this study. DOX (molecular weight: 579.98 Da) was selected because it is one of the most widely-used chemotherapeutic agents available, but it does not cross the intact BBB [32]. In addition, DOX could be extracted from the harvested tissue samples and readily quantified with fluorometric analysis [11,33]. DOX was administered IV at a dose of 5.67 mg/kg immediately after the last sonication (Fig. 1B). This dose was selected to be similar to what has been used clinically. To confirm successful BBBD and mark the targeted areas for tissue extraction, a vital dye, trypan blue (MP Biomedicals, Solon, OH) was administered after the DOX administration. The agent was prepared for each experiment as described previously [34]. The agent was dissolved in 0.45 % NaCl and then boiled and filtered to avoid formation of microcrystals. The solution was administered IV at a dose of 0.1 g trypan blue per kg of body weight.
Magnetic resonance imaging
Before the rat experiments, the target location of the FUS beam in the MRI coordinate-space was visualized by imaging temperature changes induced in a silicone phantom with a T1-weighted fast spin echo (FSE) sequence. Then, the animal was placed supine on the focused ultrasound system with the dorsal surface of the head centered in the MRI coil (Figure 1A). Standard MR imaging sequences were used to select the brain targets, characterize the BBBD and the tumor, and evaluate the brain for tissue damage. The sequences used and imaging parameters are listed in Table 2. T2-weighted FSE imaging was used to select the targets and tumor locations.
Table 2.
The MRI parameters used in the study
| Sequence | Purpose | FOV (mm) |
TR (ms) |
TE (ms) |
Matrix | FA (º) |
SL (mm) |
ST (s) |
BW (±kHz) |
|---|---|---|---|---|---|---|---|---|---|
| FSE T2-W | Tissue anatomy targeting | 80 | 2000 | 85 | 256×256 | 90 | 1 | 132 | 16 |
| FSPGR | T1 mapping | 80 | 9.9 | 4.8 | 256×256 | 30/20/15/10/2 | 2 | 15§ | 31.25 |
| FSPGR | DCE | 80 | 9.9 | 4.8 | 256×256 | 35 | 2 | 535 | 31.25 |
| FSE T1-W | Contrast enhancement | 80 | 500 | 17 | 256×256 | 90 | 1 | 130 | 16 |
| SPGR T2*-W | Tissue damage | 80 | 33 | 19 | 256×256 | 15 | 0.7 | 277 | 16 |
FOV: field of view, TR: Repetition time, TE: Echo time, FA: Flip angle, SL: Slice thickness, ST: Scan time, BW: Bandwidth
Scan time for each flip angle
DCE imaging was performed before and after sonication to evaluate the permeability change of the BBB. Details for the DCE-MRI procedures were similar to those described previously [22]. Briefly, before contrast injection, a spoiled gradient echo sequence was obtained with different flip angles to estimate the baseline relaxation time T1 [35]. Then, after obtaining eight pre-contrast sets of SPGR images were acquired, a bolus of MRI contrast agent was administered IV and an additional 62 sets of SPGR images were acquired with a temporal resolution of 7.6 seconds for 8 min. Identical slice locations were used for T1 mapping and DCE-MRI. These data were fit to a modified Tofts and Kermode model [36] using least squares regression using the software package TOPPCAT [37]. The plasma concentration of MRI contrast was measured in a large blood vessel present in the images (opthalalmic artery or transverse sinus). The interval between pairs of DCE-MRI measurements was at least 60 min to avoid excessive or changing concentrations of contrast agent. We used the MRI contrast agent gadopentetate dimeglumine (Gd-DTPA) (Magnevist®, Berlex Laboratories, Inc., Wayne, NJ, USA; molecular weight: 938 Da; plasma half-life in rats: 13 min [38]) administered i.v. at a dose of 0.25 mmol per kg of body weight. After DCE-MRI acquisition, T1-weighted FSE images were acquired to further visualize the BBBD, and T2*-weighted spoiled gradient echo (SPGR) images were acquired to evaluate whether extensive petechaie were produced [3]
DOX extraction
The concentration of DOX in the tissue was quantified using fluorometric analysis. For these measurements, tissue samples were extracted from the brain following a protocol adapted from a previous study [11,33]. Approximately 1 or 24 hr after the last sonication, the animals were deeply anaesthetized with ketamine/xylazine and sacrificed. To flush DOX from the cerebral vasculature, the brain was transcardially perfused with normal saline (0.9% NaCl, 250 mL). Then, the brain was removed and small tissue volumes (approximately 30 mg) identified by trypan blue staining were harvested along with their contralateral counterparts, which served as controls. The samples were soaked in acidified ethanol (50% ethanol in 0.3N HCl). After homogenization with a tissue blender (Next Advance, Averill Park, NY) and refrigeration for 24 hr at 4°C, the samples were centrifuged at 16,000 g for 25 min. The fluorescent intensity of the supernatant was measured using a benchtop fluorometer (VersaFluor; Bio-Rad Laboratories, Hercules, CA; Ex/Em: 480/590 nm). The concentration of DOX was quantified by linear regression and a standard curve derived from eight serial concentrations. The concentration of DOX for each tissue sample was determined by taking the average of at least of three readings.
Histology
To evaluate the histological effects of the ultrasound protocol used in this study, two of the animals, one of which was tumor-bearing, were sacrificed four hours after the last sonication. These two animals did not receive DOX or trypan blue. The animal was deeply anesthetized with ketamine/xylazine, sacrificed, and the brain fixed via transcardial perfusion (0.9% NaCl, 100 mL; 10% buffered formalin phosphate, 250 mL). The brain was then removed, embedded in paraffin, and serially sectioned at 5 μm sections in the axial plane (perpendicular to the direction of ultrasound beam propagation). Every 50th section (250 μm apart) was stained with hematoxylin and eosin (H&E). The author who evaluated the histology was blind to the FUS exposure parameters.
Statistical analysis
Ktrans and DOX measurements for the sonicated and contralateral (control) volumes were compared using a two-tailed paired Student’s t test. Values of p < 0.05 were considered statistically significant. Additional analyses included least-squares linear regression and calculation of correlation coefficients. Ktrans values presented are mean values (± standard deviation) obtained in a 0.75×0.75 mm region of interest.
RESULTS
Enhanced BBB and BTB permeabilization by FUS
Tumor appearance, BBB permeabilization and the presence or lack of petechiae were confirmed using T2-weighted imaging, contrast-enhanced T1-weighted imaging, and T2*-weighted imaging, respectively. In the normal brain, signal intensity changes were evident after contrast injection in the sonicated locations, but not in the contralateral hemisphere. Similarly, in the sonicated tumors, the magnitude and extent of this enhancement were both increased. Example images from a normal and a tumor-bearing animal are shown in Figure 2.
Figure 2.
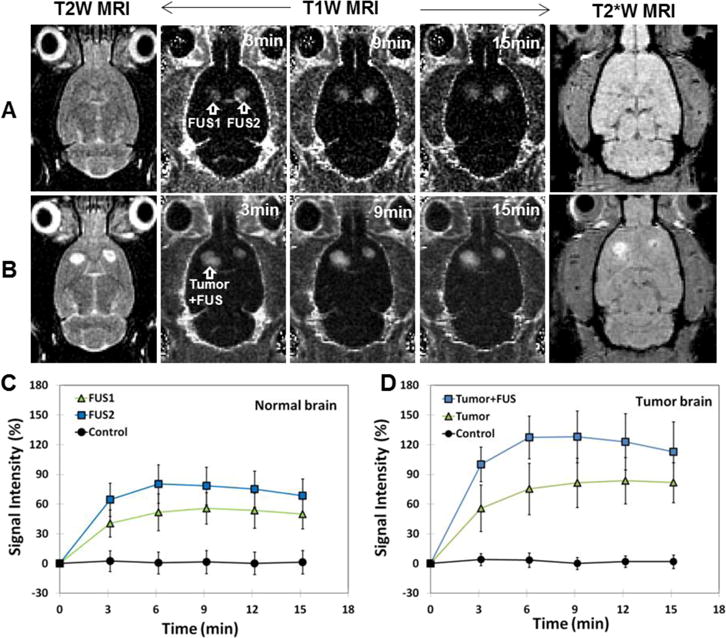
BBB and BTB permeabilization by FUS and microbubbles. A–B. MRI evaluation of FUS-induced BBBD/BTBD and tissue damage in the normal (A) and tumor-bearing (B) rat brain. T2-weighted (T2W) MR images show the tumor locations before sonication. The tumor in one hemisphere was sonicated; the non-sonicated tumor served as a control. T1-weighted (T1W) MR images show contrast changes relative to pre-contrast images. After sonication, a time series of axial contrast-enhanced T1W MR images show localized BBBD at two sonicated spots (arrows) in normal brain (A) and enhanced BTBD at a sonicated region in a brain tumor (B). T2*-weighted (T2*W) MR images in axial plane after FUS showed no evidence of the creation of extensive petechiae, which would have appeared in this imaging as hypointense spots. C: In normal brain, mean signal intensity changes as function of time for 5×5 voxels regions of interest at the two sonicated targets (FUS1 and FUS2) and non-sonicated locations (Control). D. Mean signal intensity changes as function of time for 5×5 voxels regions of interest in the sonicated tumor (Tumor+FUS), the non-sonicated tumor (Tumor), and non-sonicated normal tissue (Control). A PRFP amplitude 0.72 MPa was used to induce BBBD/BTBD. Scale bars are 5 mm.
Kinetics of BBB/BTB permeability and doxorubicin concentration changes
DCE-MRI was obtained before and after FUS-induced BBB/BTB disruption to estimate Gd-DTPA concentrations as a function of time. These estimates were used to calculate the transfer coefficient, Ktrans. Example Ktrans maps and plots showing Gd-DTPA concentration vs. time before and after sonication are shown in Figure 3. Before FUS, the Gd-DTPA concentrations and Ktrans values for both tumors were similar. After FUS, the estimated Gd-DTPA concentration in the sonicated tumor increased significantly, and the area with evident signal intensity changes increased.
Figure 3.
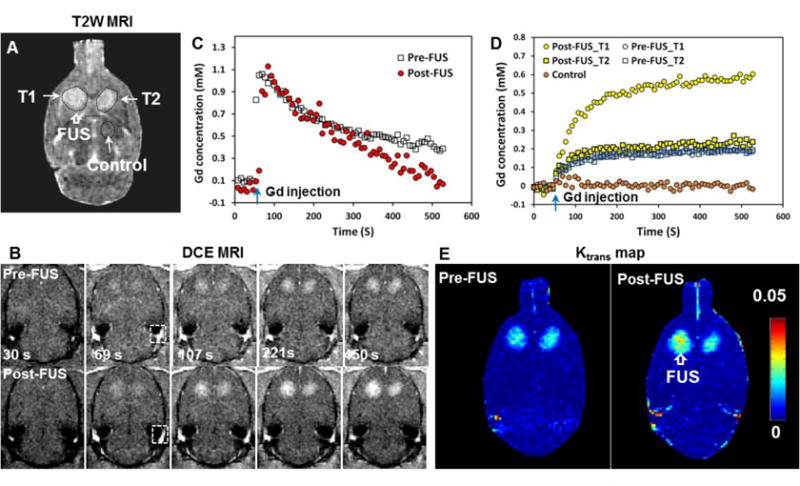
Representative example showing MRI contrast signal dynamics measured in a rat tumor model and in the normal brain, and the steps used to calculate the Ktrans maps. A. T2-weighted (T2W) MRI shows bilateral brain tumors. B. Dynamic contrast enhanced (DCE) MR images obtained before and after sonication of tumor T1. The concentration of the MRI contrast agent Gd-DTPA in plasma was obtained in a blood vessel included in the image (box in B) C. Time history of Gd-DTPA concentration in the region of interest in this blood vessel before and after FUS. Only minor changes were observed. D. Time history of Gd-DTPA concentrations in the sonicated tumor (T1), the control tumor (T2), and in the control location before and after FUS. Data shown are the mean values obtained in 5×5 voxel regions of interest. E. The resulting Ktrans maps. A PRFP amplitude of 0.72 MPa was used to induce BBBD/BTBD in this example. Scale bars are 5 mm.
Comparisons of mean Ktrans before and after sonication are shown in Figure 4. Before sonication, the mean Ktrans values (±S.D) were 0.016 ± 0.0069 and 0.013 ± 0.0067 min−1 in the sonicated and non-sonicated tumors, respectively. These values were not significantly different. After FUS, the mean Ktrans for the sonicated tumor was 0.032 ± 0.0085 min−1, significantly higher (P<0.001) than the pre-FUS estimate. In contrast, in the control tumor, the mean Ktrans in the second measurement (0.016 ± 0.0086 min−1) was not significantly different. In the normal brain without sonication, no signal changes were observed and the mean Ktrans measurements were less than 0.0001 min−1. After FUS, the mean Ktrans value in the sonicated tissue was 0.019 ± 0.0054 min−1, a significant increase (P<0.001).
Figure 4.
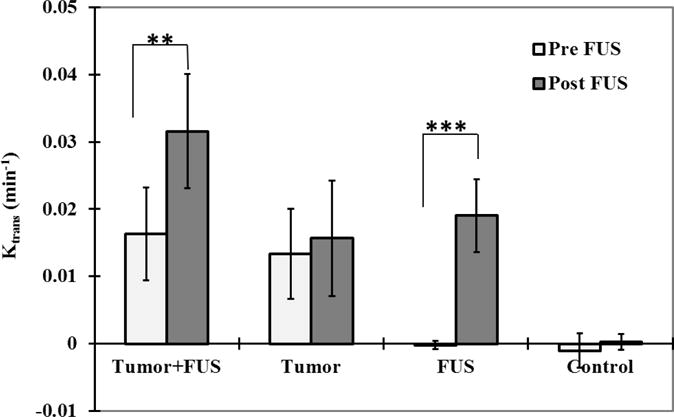
Mean Ktrans estimates (± SD) before and after FUS for the sonicated and non-sonicated tumors and regions in the normal brain. Ktrans measurements were significantly increased in both the sonicated tumors the sonicated normal brain tissue between the two DCE-MRI acquisitions (before and after FUS). The Ktrans values in the sonicated tumors and brain regions were also significantly greater than the non-sonicated cases (P<0.001). The mean Ktrans estimates for the non-sonicated tumor and normal brain regions from the two acquisitions were not significantly different. (*** P<0.001)
DOX concentrations in sonicated and non-sonicated brain and tumor tissues obtained from animals sacrificed 1 hour and 24 hours after FUS are summarized in Figure 5. For the non-sonicated tumors, the mean DOX concentration was 559 ± 199 ng/g at 1 hour and 114 ± 45 ng/g at 24 hours. Significantly higher concentrations (1494 ± 495, P<0.01 and 1585 ± 385 P<0.001 at 1 and 24 hours respectively) were observed at both times in the tumors that were sonicated. The difference in concentration at 1 and 24 hours was not significant in the sonicated tumors. Similar findings were observed in the normal brain. Without sonication, a low DOX concentration (114 ± 51, 61 ± 40 ng/g at 1, 24 hours) was observed. With sonication, the concentration was significantly (P<0.01) higher (1040 ± 225, 797 ± 152 ng/g at 1, 24 hours respectively). As was the case with the tumors, with sonication the difference in DOX concentrations in the normal brain at 1 and 24 hours was not significant.
Figure 5.
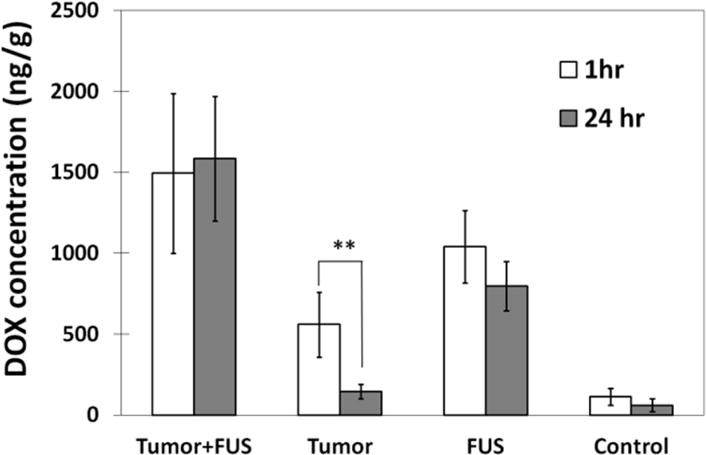
Mean DOX concentrations estimates (± SD) at 1 and 24 hours after FUS for the sonicated and non-sonicated tumors and for the regions in the normal brain. At both times, the concentrations in the sonicated areas were significantly larger (P<0.01) than the non-sonicated controls. The concentration in the non-sonicated tumors was significantly less at 24 hours than at 1 hour, and little DOX was found in the non-sonicated brain regions at either time point. In contrast, there was no significant difference in DOX concentrations at 1 and 24 hours for both the sonicated tumors and the sonicated normal brain regions, suggesting that the sonications enhanced drug retention.
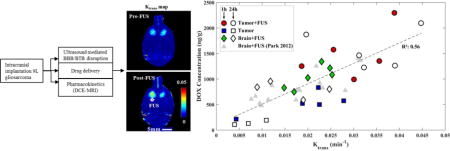
The relationship between the DOX concentration and Ktrans measurements is shown in Figure 6. A linear relationship with a good correlation (R2: 0.56) was observed. No apparent difference was observed in this relationship between sonicated and non-sonicated tumors, sonicated normal brain, or for animals sacrificed at 1 or 24 hours after sonication. Regression of this data suggests that with each increase in Ktrans of 0.01 min−1, the DOX concentration increased by 361 ng/g.
Figure 6.
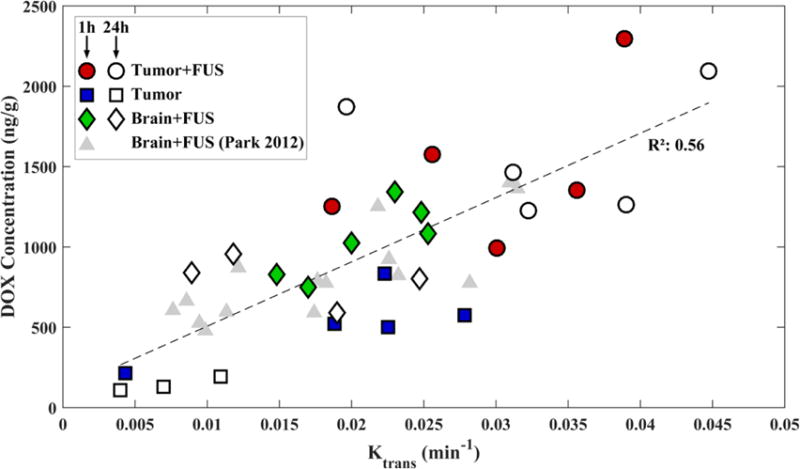
DOX concentrations measured in the sonicated tumors (FUS+Tumor), the sonicated regions in the normal brain (FUS), and the non-sonicated tumors (Tumor) as function of Ktrans measured using DCE-MRI. DOX concentrations were measured 1 or 24 hours after sonication. The solid line shows a linear regression of the data (slope: 36,094 ng/g DOX per change in Ktrans in min−1; intercept: 361 ng/g DOX; R2: 0.56). Data from a similar prior study [22] are shown for comparison.
Histology
Two animals were examined in histology. Overall, the sonicated and non-sonicated brain and tumor tissue appeared similar. The tumors were a dense mass of spindle-shaped cells, and the surrounding brain tissue was edematous. The tissue surrounding the tumor as well as the brain tissue in the non-tumor-bearing rats appeared normal. The only changes were the presence of small (<1 mm) regions containing extravasated erythrocytes (petechiae). These petechiae suggest minor vessel damage occurred along with the BBB disruption. The density of extravasated blood cells was greatest at the margin of a ventricle that was included in the sonicated area.
Discussion
The plasma half-life of free (unencapsulated) DOX is only about 5 minutes, and the tissue half-life ranges from 9–23 minutes, depending on the organ [39]. These short times were reflected in the measurements in the control tumors that were not sonicated, where some DOX was delivered across the partially-intact BTB, but the concentration was significantly lower in the samples obtained 24 hours later. With sonication, the DOX levels were significantly enhanced compared to the controls, and the levels measured at 24 hours were not significantly different than those measured at 1 hour. In the normal brain, only a tiny amount of DOX was detected without sonication. With FUS enhancement, high levels of the drug were measured, and as was the case in the sonicated tumors, the levels at 1 and 24 hours were not significantly different from each other. Thus, these results demonstrate that microbubble-enhanced sonication not only enables delivery of this drug across the BBB and enhances its delivery to this tumor model, but that it may also increase the amount of time DOX is present in the tissue. Enabling enhanced drug retention in the target tissue could increase the potency of this drug. If this longer time can be translated to the clinic, it could thus be possible to use a lower systemic dose to achieve a local therapeutic effect.
How the ultrasound-induced effects on the BBB and BTB resulted in enhanced DOX retention is unknown. Modeling of doxorubicin delivery and clearance in the brain suggests significant drug retention is to be expected at 24 hours, both in drug in the extracellular space and in drug taken up into the intracellular space [40]. Extending this pharmacokinetic modeling to brain tumors might explain our findings. Other factors may be involved as well. Clearance of drugs from the brain occurs through the exchange of interstitial fluid and cerebral spinal fluid through the “glymphatic” system [27], through transport back into the blood stream via drug efflux pumps[28,41] and other factors [30,31]. It is possible that the sonications resulted in suppression of one or more drug efflux pumps. Indeed, others have shown that the efflux pump P-glycoprotein can be suppressed by ultrasound [42,43], and our laboratory has reported that such suppression may occur in blood vessels in the brain after BBB disruption [44]. DOX is known to be a substrate for P-glycoprotein. Aquaporin-4, a water channel which is present on the vessel-facing endfeet of astrocytes, plays an important role in the exchange between the interstitial fluid and the paravascular spaces through cerebrospinal fluid flows [45] Ultrasound-induced modulation of the BBB may have hereto unknown effects on the function of these channels. Physical factors such as the distance from the blood vessels that the drug penetrates, the flow rate of the cerebrospinal and interstitial fluid, and the sequestration of drugs within endothelial cells or other cells in the brain parenchyma might also play a role. Clearly, more knowledge of the physical and physiological effects produced by the sonications is needed.
Previously, we investigated the FUS effects on free DOX concentrations and Gd-DTPA pharmacokinetics in the normal rat brain [22], and others have evaluated concentrations and pharmacokinetics of different MRI contrast agents [18,19,21,23]. These results are consistent with those studies. Similar increases in Ktrans were observed after FUS, and a similar linear relationship between DOX concentration and Ktrans was found. Here, we extend these results to a tumor model. Interestingly, the relationship between DOX and Ktrans was similar for the normal brain after BBB disruption and both the sonicated and non-sonicated tumors. These results are thus promising for quantifying the amount of drug delivered to the target tissue. However, it is important to note that tumor permeability as well as the “magnitude” of the BTB disruption induced by FUS can change over time as the tumor grows [24]. The relationship between Gd-DTPA and drug delivery also will depend on which drug is used. For example, we found in a similar study performed with liposomal doxorubicin that Ktrans for Gd-DTPA was not enhanced by sonication in later-stage tumors while the delivery of the much larger liposomal drug was enhanced regardless of tumor stage [24]. Here, we only investigated effects at a single time point after implantation and more work is needed to understand under which circumstances an imaging contrast agent can be used as a surrogate to estimate drug concentrations.
Another limitation of this work is that different groups of animals were used to measure DOX concentrations at 1 and 24 hours after sonication. It would be interesting to repeat this study with agents that could be evaluated in vivo to confirm our findings in individual animals. Such studies could also facilitate investigations of drug clearance over longer time periods. We also only investigated tissue retention for a single agent. Work with a range of agents with different properties and that are known to be cleared by different mechanisms could be illuminating for better understanding the physical and physiological effects produced by microbubble-enhanced FUS. It would also be interesting to evaluate whether doxorubicin produced any additional adverse events. Here, histological examination was performed in animals that did not receive drug. Due to time restraints, we only waited a short time between sonications, and the microbubble concentration may have accumulated, resulting in variability in the sonication effects. Finally, our DOX concentration estimates were performed on homogenized tissue samples, and we do not know how far the drug penetrated after sonication. Examining drug distributions in microscopy are necessary to ensure that the drug can reach the target cells.
Conclusions
Kinetics of the BBB/BTB permeability changes induced by microbubble-enhanced FUS were characterized using DCE-MRI and related to measured DOX tissue concentrations. A linear relationship was found that agreed with previous studies that investigated normal brain. In the control tumors, the DOX concentrations were significantly lower at 24 hours compared to 1 hour after drug administration. In contrast, the DOX concentrations in sonicated tumors and in the sonicated normal brain were not significantly different at 1 and 24 hours. Overall, these findings suggest that FUS and microbubbles can not only enhance the delivery of DOX, but that it is retained in the tissue for at least 24 hours. The use of the MRI contrast agent as a surrogate appeared useful in predicting drug concentrations.
Figure 7.
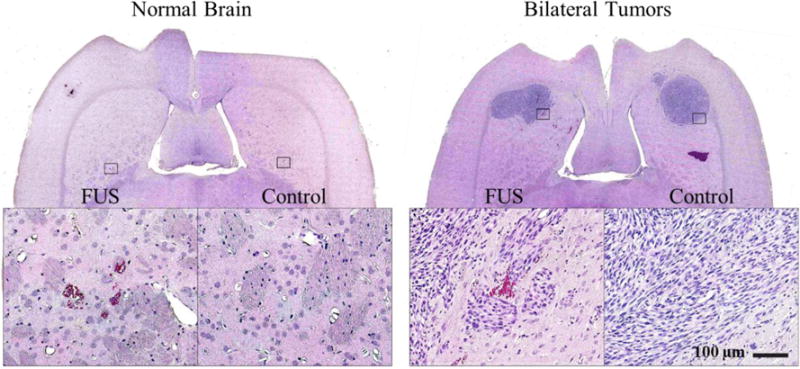
Histological appearance of the brain after sonication. A. The only sign of the sonications in the brain was the presence of small (<1 mm) regions containing extravasated erythrocytes (petechiae) (inset in (A)). B. Appearance of 9L gliosarcoma one week after implantation in histology. The tumors appeared as solid masses that replaced large volumes of brain tissue. The bulk of tumors consisted of rapidly dividing spindle-shaped cells. Most of the sonicated region appeared unaffected, but in a few areas tiny clusters of extravasated erythrocytes (petechaie) were observed (inset in (B)). Scale bar 5mm
Acknowledgments
This work was supported by National Institutes of Health (P01CA174645) and by the Brain Research Program of the National Research Foundation of Korea (NRF), which is funded by the Ministry of Science, ICT & Future Planning (2016M3C7A1913933). We thank Chanikarn (Yui) Power for her assistance in the animal handling and sonication procedure.
Footnotes
Publisher's Disclaimer: This is a PDF file of an unedited manuscript that has been accepted for publication. As a service to our customers we are providing this early version of the manuscript. The manuscript will undergo copyediting, typesetting, and review of the resulting proof before it is published in its final citable form. Please note that during the production process errors may be discovered which could affect the content, and all legal disclaimers that apply to the journal pertain.
References
- 1.Pardridge WM. Blood-brain barrier drug targeting: the future of brain drug development. Mol Interv. 2003;3:90–105. 51. doi: 10.1124/mi.3.2.90. [DOI] [PubMed] [Google Scholar]
- 2.Groothuis DR. The blood-brain and blood-tumor barriers: a review of strategies for increasing drug delivery. Neuro-Oncol. 2000;2:45–59. doi: 10.1093/neuonc/2.1.45. [DOI] [PMC free article] [PubMed] [Google Scholar]
- 3.Hynynen K, McDannold N, Vykhodtseva N, Jolesz FA. Noninvasive MR Imaging–guided Focal Opening of the Blood-Brain Barrier in Rabbits1. Radiology. 2001;220:640–646. doi: 10.1148/radiol.2202001804. [DOI] [PubMed] [Google Scholar]
- 4.Hynynen K, McDannold N, Sheikov NA, Jolesz FA, Vykhodtseva N. Local and reversible blood-brain barrier disruption by noninvasive focused ultrasound at frequencies suitable for trans-skull sonications. NeuroImage. 2005;24:12–20. doi: 10.1016/j.neuroimage.2004.06.046. [DOI] [PubMed] [Google Scholar]
- 5.McDannold N, Arvanitis CD, Vykhodtseva N, Livingstone MS. Temporary disruption of the blood-brain barrier by use of ultrasound and microbubbles: safety and efficacy evaluation in rhesus macaques. Cancer Res. 2012;72:3652–3663. doi: 10.1158/0008-5472.CAN-12-0128. [DOI] [PMC free article] [PubMed] [Google Scholar]
- 6.McDannold N, Vykhodtseva N, Raymond S, Jolesz FA, Hynynen K. MRI-guided targeted blood-brain barrier disruption with focused ultrasound: histological findings in rabbits. Ultrasound Med Biol. 2005;31:1527–1537. doi: 10.1016/j.ultrasmedbio.2005.07.010. [DOI] [PubMed] [Google Scholar]
- 7.Kobus T, Vykhodtseva N, Pilatou M, Zhang Y, McDannold N. Safety Validation of Repeated Blood-Brain Barrier Disruption Using Focused Ultrasound. Ultrasound Med Biol. 2015 doi: 10.1016/j.ultrasmedbio.2015.10.009. [DOI] [PMC free article] [PubMed] [Google Scholar]
- 8.Downs ME, Buch A, Karakatsani ME, Konofagou EE, Ferrera VP. Blood-Brain Barrier Opening in Behaving Non-Human Primates via Focused Ultrasound with Systemically Administered Microbubbles. Sci Rep. 2015;5:15076. doi: 10.1038/srep15076. [DOI] [PMC free article] [PubMed] [Google Scholar]
- 9.Burgess A, Dubey S, Yeung S, Hough O, Eterman N, Aubert I, Hynynen K. Alzheimer disease in a mouse model: MR imaging-guided focused ultrasound targeted to the hippocampus opens the blood-brain barrier and improves pathologic abnormalities and behavior. Radiology. 2014;273:736–745. doi: 10.1148/radiol.14140245. [DOI] [PMC free article] [PubMed] [Google Scholar]
- 10.Kinoshita M, McDannold N, Jolesz FA, Hynynen K. Noninvasive localized delivery of Herceptin to the mouse brain by MRI-guided focused ultrasound-induced blood-brain barrier disruption. Proc Natl Acad Sci U S A. 2006;103:11719–11723. doi: 10.1073/pnas.0604318103. [DOI] [PMC free article] [PubMed] [Google Scholar]
- 11.Treat LH, McDannold N, Vykhodtseva N, Zhang Y, Tam K, Hynynen K. Targeted delivery of doxorubicin to the rat brain at therapeutic levels using MRI-guided focused ultrasound. Int J Cancer J Int Cancer. 2007;121:901–907. doi: 10.1002/ijc.22732. [DOI] [PubMed] [Google Scholar]
- 12.Jordão JF, Ayala-Grosso CA, Markham K, Huang Y, Chopra R, McLaurin J, Hynynen K, Aubert I. Antibodies targeted to the brain with image-guided focused ultrasound reduces amyloid-beta plaque load in the TgCRND8 mouse model of Alzheimer’s disease. PloS One. 2010;5:e10549. doi: 10.1371/journal.pone.0010549. [DOI] [PMC free article] [PubMed] [Google Scholar]
- 13.Liu HL, Hua MY, Yang HW, Huang CY, Chu PC, Wu JS, Tseng IC, Wang JJ, Yen TC, Chen PY, Wei KC. Magnetic resonance monitoring of focused ultrasound/magnetic nanoparticle targeting delivery of therapeutic agents to the brain. Proc Natl Acad Sci U S A. 2010;107:15205–15210. doi: 10.1073/pnas.1003388107. [DOI] [PMC free article] [PubMed] [Google Scholar]
- 14.Chen PY, Liu HL, Hua MY, Yang HW, Huang CY, Chu PC, Lyu LA, Tseng IC, Feng LY, Tsai HC, Chen SM, Lu YJ, Wang JJ, Yen TC, Ma YH, Wu T, Chen JP, Chuang JI, Shin JW, Hsueh C, Wei KC. Novel magnetic/ultrasound focusing system enhances nanoparticle drug delivery for glioma treatment. Neuro-Oncol. 2010;12:1050–1060. doi: 10.1093/neuonc/noq054. [DOI] [PMC free article] [PubMed] [Google Scholar]
- 15.Park EJ, Zhang YZ, Vykhodtseva N, McDannold N. Ultrasound-mediated blood-brain/blood-tumor barrier disruption improves outcomes with trastuzumab in a breast cancer brain metastasis model. J Control Release Off J Control Release Soc. 2012;163:277–284. doi: 10.1016/j.jconrel.2012.09.007. [DOI] [PMC free article] [PubMed] [Google Scholar]
- 16.Aryal M, Vykhodtseva N, Zhang YZ, Park J, McDannold N. Multiple treatments with liposomal doxorubicin and ultrasound-induced disruption of blood–tumor and blood–brain barriers improve outcomes in a rat glioma model. J Controlled Release. 2013;169:103–111. doi: 10.1016/j.jconrel.2013.04.007. [DOI] [PMC free article] [PubMed] [Google Scholar]
- 17.Wei KC, Chu PC, Wang HYJ, Huang CY, Chen PY, Tsai HC, Lu YJ, Lee PY, Tseng IC, Feng LY, Hsu PW, Yen TC, Liu HL. Focused ultrasound-induced blood-brain barrier opening to enhance temozolomide delivery for glioblastoma treatment: a preclinical study. PloS One. 2013;8:e58995. doi: 10.1371/journal.pone.0058995. [DOI] [PMC free article] [PubMed] [Google Scholar]
- 18.Vlachos F, Tung YS, Konofagou EE. Permeability assessment of the focused ultrasound-induced blood-brain barrier opening using dynamic contrast-enhanced MRI. Phys Med Biol. 2010;55:5451–5466. doi: 10.1088/0031-9155/55/18/012. [DOI] [PMC free article] [PubMed] [Google Scholar]
- 19.Marty B, Larrat B, Van Landeghem M, Robic C, Robert P, Port M, Le Bihan D, Pernot M, Tanter M, Lethimonnier F, Meriaux S. Dynamic study of blood-brain barrier closure after its disruption using ultrasound: a quantitative analysis. J Cereb Blood Flow Metab. 2012;32:1948–1958. doi: 10.1038/jcbfm.2012.100. [DOI] [PMC free article] [PubMed] [Google Scholar]
- 20.Treat LH, McDannold N, Vykhodtseva N, Zhang Y, Tam K, Hynynen K. Targeted delivery of doxorubicin to the rat brain at therapeutic levels using MRI-guided focused ultrasound. Int J Cancer J Int Cancer. 2007;121:901–907. doi: 10.1002/ijc.22732. [DOI] [PubMed] [Google Scholar]
- 21.Chai WY, Chu PC, Tsai MY, Lin YC, Wang JJ, Wei KC, Wai YY, Liu HL. Magnetic-resonance imaging for kinetic analysis of permeability changes during focused ultrasound-induced blood-brain barrier opening and brain drug delivery. J Control Release Off J Control Release Soc. 2014;192:1–9. doi: 10.1016/j.jconrel.2014.06.023. [DOI] [PubMed] [Google Scholar]
- 22.Park J, Zhang Y, Vykhodtseva N, Jolesz FA, McDannold NJ. The kinetics of blood brain barrier permeability and targeted doxorubicin delivery into brain induced by focused ultrasound. J Control Release Off J Control Release Soc. 2012;162:134–142. doi: 10.1016/j.jconrel.2012.06.012. [DOI] [PMC free article] [PubMed] [Google Scholar]
- 23.Chu PC, Chai WY, Hsieh HY, Wang JJ, Wey SP, Huang CY, Wei KC, Liu HL. Pharmacodynamic analysis of magnetic resonance imaging-monitored focused ultrasound-induced blood-brain barrier opening for drug delivery to brain tumors. BioMed Res Int. 2013;2013:627496. doi: 10.1155/2013/627496. [DOI] [PMC free article] [PubMed] [Google Scholar]
- 24.Aryal M, Park J, Vykhodtseva N, Zhang YZ, McDannold N. Enhancement in blood-tumor barrier permeability and delivery of liposomal doxorubicin using focused ultrasound and microbubbles: evaluation during tumor progression in a rat glioma model. Phys Med Biol. 2015;60:2511–2527. doi: 10.1088/0031-9155/60/6/2511. [DOI] [PMC free article] [PubMed] [Google Scholar]
- 25.Chu PC, Liu HL, Lai HY, Lin CY, Tsai HC, Pei YC. Neuromodulation accompanying focused ultrasound-induced blood-brain barrier opening. Sci Rep. 2015;5:15477. doi: 10.1038/srep15477. [DOI] [PMC free article] [PubMed] [Google Scholar]
- 26.Kinoshita M, McDannold N, Jolesz FA, Hynynen K. Targeted delivery of antibodies through the blood-brain barrier by MRI-guided focused ultrasound. Biochem Biophys Res Commun. 2006;340:1085–1090. doi: 10.1016/j.bbrc.2005.12.112. [DOI] [PubMed] [Google Scholar]
- 27.Iliff JJ, Wang M, Liao Y, Plogg BA, Peng W, Gundersen GA, Benveniste H, Vates GE, Deane R, Goldman SA, Nagelhus EA, Nedergaard M. A paravascular pathway facilitates CSF flow through the brain parenchyma and the clearance of interstitial solutes, including amyloid β. Sci Transl Med. 2012;4:147ra111. doi: 10.1126/scitranslmed.3003748. [DOI] [PMC free article] [PubMed] [Google Scholar]
- 28.Cordon-Cardo C, O’Brien JP, Boccia J, Casals D, Bertino JR, Melamed MR. Expression of the multidrug resistance gene product (P-glycoprotein) in human normal and tumor tissues. J Histochem Cytochem Off J Histochem Soc. 1990;38:1277–1287. doi: 10.1177/38.9.1974900. [DOI] [PubMed] [Google Scholar]
- 29.Miller DS, Bauer B, Hartz AMS. Modulation of P-Glycoprotein at the Blood-Brain Barrier: Opportunities to Improve Central Nervous System Pharmacotherapy. Pharmacol Rev. 2008;60:196–209. doi: 10.1124/pr.107.07109. [DOI] [PMC free article] [PubMed] [Google Scholar]
- 30.Louveau A, Smirnov I, Keyes TJ, Eccles JD, Rouhani SJ, Peske JD, Derecki NC, Castle D, Mandell JW, Lee KS, Harris TH, Kipnis J. Structural and functional features of central nervous system lymphatic vessels. Nature. 2015;523:337–341. doi: 10.1038/nature14432. [DOI] [PMC free article] [PubMed] [Google Scholar]
- 31.Aspelund A, Antila S, Proulx ST, Karlsen TV, Karaman S, Detmar M, Wiig H, Alitalo K. A dural lymphatic vascular system that drains brain interstitial fluid and macromolecules. J Exp Med. 2015;212:991–999. doi: 10.1084/jem.20142290. [DOI] [PMC free article] [PubMed] [Google Scholar]
- 32.von Holst H, Knochenhauer E, Blomgren H, Collins VP, Ehn L, Lindquist M, Norén G, Peterson C. Uptake of adriamycin in tumour and surrounding brain tissue in patients with malignant gliomas. Acta Neurochir (Wien) 1990;104:13–16. doi: 10.1007/BF01842886. [DOI] [PubMed] [Google Scholar]
- 33.Bachur NR, Moore AL, Bernstein JG, Liu A. Tissue distribution and disposition of daunomycin (NCS-82151) in mice: fluorometric and isotopic methods. Cancer Chemother Rep. 1970;54:89–94. [PubMed] [Google Scholar]
- 34.BAKAY L, BALLANTINE HT, Jr, HUETER TF, SOSA D. Ultrasonically produced changes in the blood-brain barrier. AMA Arch Neurol Psychiatry. 1956;76:457–467. doi: 10.1001/archneurpsyc.1956.02330290001001. [DOI] [PubMed] [Google Scholar]
- 35.Wang HZ, Riederer SJ, Lee JN. Optimizing the precision in T1 relaxation estimation using limited flip angles. Magn Reson Med Off J Soc Magn Reson Med Soc Magn Reson Med. 1987;5:399–416. doi: 10.1002/mrm.1910050502. [DOI] [PubMed] [Google Scholar]
- 36.Barboriak DP. Standardized software for calculation of Ktrans and vp from dynamic T1-weighted MR images. McLean VA: 2004. [Google Scholar]
- 37.Tofts PS, Kermode AG. Measurement of the blood-brain barrier permeability and leakage space using dynamic MR imaging. 1. Fundamental concepts. Magn Reson Med. 1991;17:357–367. doi: 10.1002/mrm.1910170208. [DOI] [PubMed] [Google Scholar]
- 38.Vexler VS, Clément O, Schmitt-Willich H, Brasch RC. Effect of varying the molecular weight of the MR contrast agent Gd-DTPA-polylysine on blood pharmacokinetics and enhancement patterns. J Magn Reson Imaging JMRI. 1994;4:381–388. doi: 10.1002/jmri.1880040325. [DOI] [PubMed] [Google Scholar]
- 39.Rahman A, Carmichael D, Harris M, Roh JK. Comparative pharmacokinetics of free doxorubicin and doxorubicin entrapped in cardiolipin liposomes. Cancer Res. 1986;46:2295–2299. [PubMed] [Google Scholar]
- 40.Nhan T, Burgess A, Lilge L, Hynynen K. Modeling localized delivery of Doxorubicin to the brain following focused ultrasound enhanced blood-brain barrier permeability. Phys Med Biol. 2014;59:5987–6004. doi: 10.1088/0031-9155/59/20/5987. [DOI] [PubMed] [Google Scholar]
- 41.Miller DS. Regulation of ABC transporters blood-brain barrier: the good, the bad, and the ugly. Adv Cancer Res. 2015;125:43–70. doi: 10.1016/bs.acr.2014.10.002. [DOI] [PubMed] [Google Scholar]
- 42.Wu F, Shao ZY, Zhai BJ, Zhao CL, Shen DM. Ultrasound reverses multidrug resistance in human cancer cells by altering gene expression of ABC transporter proteins and Bax protein. Ultrasound Med Biol. 2011;37:151–159. doi: 10.1016/j.ultrasmedbio.2010.10.009. [DOI] [PubMed] [Google Scholar]
- 43.Zhang Z, Xu K, Bi Y, Yu G, Wang S, Qi X, Zhong H. Low Intensity Ultrasound Promotes the Sensitivity of Rat Brain Glioma to Doxorubicin by Down-Regulating the Expressions of P-Glucoprotein and Multidrug Resistance Protein 1 In Vitro and In Vivo. PLoS ONE. 2013;8 doi: 10.1371/journal.pone.0070685. [DOI] [PMC free article] [PubMed] [Google Scholar]
- 44.Aryal M, Fischer K, Gitto S, Zhang Y-Z, McDannold N. Possible effects on P-glycoprotein expression after blood brain barrier disruption using focused ultrasound and microbubbles. International Society for Therapeutic Ultrasound; Natherland: 2015. [DOI] [PMC free article] [PubMed] [Google Scholar]
- 45.Amiry-Moghaddam M, Ottersen OP. The molecular basis of water transport in the brain. Nat Rev Neurosci. 2003;4:991–1001. doi: 10.1038/nrn1252. [DOI] [PubMed] [Google Scholar]


