Abstract
A new ultra high-resolution (UHR) mode has been implemented on a whole body photon counting-detector (PCD) CT system. The UHR mode has a pixel size of 0.25 mm by 0.25 mm at the iso-center, while the conventional (macro) mode is limited to 0.5 mm by 0.5 mm. A set of synthetic lung nodules (two shapes, five sizes, and two radio-densities) was scanned using both the UHR and macro modes and reconstructed with 2 reconstruction kernels (4 sets of images in total). Linear regression analysis was performed to compare measured nodule volumes from CT images to reference volumes. Surface curvature was calculated for each nodule and the full width half maximum (FWHM) of the curvature histogram was used as a shape index to differentiate sphere and star shape nodules. Receiver operating characteristic (ROC) analysis was performed and area under the ROC curve (AUC) was used as a figure of merit for the differentiation task. Results showed strong linear relationship between measured nodule volume and reference standard for both UHR and macro mode. For all nodules, volume estimation was more accurate using UHR mode with sharp kernel (S80f), with lower mean absolute percent error (MAPE) (6.5%) compared with macro mode (11.1% to 12.9%). The improvement of volume measurement from UHR mode was more evident particularly for small nodule size (3mm, 5mm), or star-shape nodules. Images from UHR mode with sharp kernel (S80f) consistently demonstrated the best performance (AUC = 0.85) when separating star from sphere shape nodules among all acquisition and reconstruction modes. Our results showed the advantages of UHR mode on a PCD CT scanner in lung nodule characterization. Various clinical applications, including quantitative imaging, can benefit substantially from this high resolution mode.
Keywords: Computed tomography (CT), photon counting detector (PCD), lung nodule, volume, shape index, shape differentiation
1. INTRODUCTION
Lung cancer is the #1 cause of death among all cancer types for both men and women in the United States, resulting in ~160,000 deaths in the country every year [1, 2]. Late diagnosis is the major reason for treatment failure; meanwhile, 5-year survival rate at early stage of lung cancer is higher than 70% [3–5]. In clinical practice, the size and irregularity of the shape of a lung nodule is often seen as the major risk factor for malignancy [6]. Volumetric computed tomography (CT) has been shown to be an effective imaging tool for the diagnosis and staging of lung cancer by providing quantitative information regarding lung nodule size and shape.
A photon-counting-detector (PCD)-based CT system is able to count individual incident photons and bin them according to their energy. This opens up new possibilities for CT applications [7–13]. A research PCD CT system was recently introduced that offers notable benefits, including improved spatial resolution, contrast-noise ratio, and dose efficiency compared with traditional energy integrating detector CT systems [14–19]. The PCD system consisted of detectors with native pixel size of 0.225 mm × 0.225 mm at the detector. In the regular configuration (macro mode), 4-by-4 sub-pixels are grouped, yielding an effective pixel size of 0.9 mm × 0.9 mm on the detector, and 0.5 mm × 0.5 mm at the iso-center [14]. A high resolution configuration, referred to as the UHR mode, was recently implemented by grouping 2-by-2 sub-pixels (instead of 4-by-4), yielding an effective pixel size of 0.45 mm × 0.45 mm on the detector, corresponding to 0.25 mm × 0.25 mm pixel size at the iso-center [16]. This improvement in spatial resolution of the PCD CT system has the potential for improved accuracy in volumetric CT, which serves as a quantitative imaging biomarker for lung nodule growth.
The aim of this study was to evaluate the performance of the UHR mode on a PCD CT scanner in phantom studies for the task of volume quantification and shape differentiation for lung nodules. The influence of nodule properties (size, shape and radio-density) and reconstruction kernel was assessed and the performance of the UHR mode also compared to that of the macro mode.
2. METHODS
2.1 PCD CT Scanner and Imaging Protocols
A whole-body research PCD CT scanner (Definition CounT, Siemens Healthcare, Forchheim, Germany), which is based on the second-generation dual-source CT scanner (Definition Flash, Siemens Healthcare), was used in this study. Scans were performed using two acquisition modes: the UHR mode with 32 × 0.25 mm collimation, and the macro mode with collimation of 32 × 0.50 mm. Spiral scans were performed with the following parameters, which were identical for both modes: 140 kV, energy thresholds of 25 and 75 keV, 1.0 s rotation time, pitch of 0.6, 36 effective mAs and corresponding volume CT dose index (CTDIvol) of 4.37 mGy. Images corresponding to the low threshold (25–140 keV) were reconstructed for volumetric quantifications and shape discrimination with a very sharp kernel (S80f) and a medium sharp kernel (B46f) using a field of view (FOV) of 110 × 110 mm and the thinnest available slice thickness for each mode (0.25 mm for UHR, 0.5 mm for macro).
2.2 Phantoms
A set of synthetic nodules (Figure 1A) were embedded in a tissue equivalent thorax phantom (140 mm × 115 mm, CIRS, Norfolk, Virginia, USA). A total of 20 nodules were included in this study: two shapes (sphere and star), five sizes (3, 5, 8, 10, 12 mm, in diameter) and two radio-densities (quantified in terms of CT number, −630 and +100 HU). Detailed descriptions of nodules are given in Table 1. All nodules were placed inside the phantom within the 27.5 cm FOV of the PCD CT system.
Figure 1.
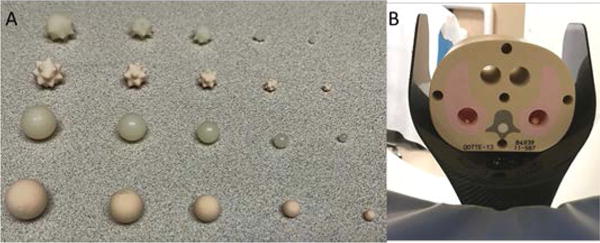
Photograph of the different types of synthetic nodules (A) and CIRS tissue-equivalent thoracic phantom (B) used in this study.
Table 1.
Description of the lung nodules used
| Sizes (mm) | Shape | Density (HU) |
|---|---|---|
| 3, 5, 8, 10, 12 | Star | +100 |
| 3, 5, 8, 10, 12 | Star | −630 |
| 3, 5, 8, 10, 12 | Sphere | +100 |
| 3, 5, 8, 10, 12 | Sphere | −630 |
The reference volume for each nodule was derived using the provided mass and density. The density of each nodule was provided by the manufacturer and the mass of each nodule was measured by a high precision (0.1 mg) scale. The reference volume for each nodule was obtained by dividing the measured mass by the provided density. The reference nodule volumes ranged from 14.3 to 994.5 mm3.
2.3 Volume Measurement from PCD CT Images
Volume measurements from PCD CT images were performed using MATLAB-based software (Version R2013b, Math-Works, Massachusetts, U.S.A.) developed in our lab. Nodule volumes were quantified in a semi-automatic manner. After loading the DICOM images into the software, the user first manually identified all the possible nodules. By clicking on the center of the nodule, a 3D segmentation of each nodule was automatically achieved. Volume estimation was calculated by multiplying number of voxels of each nodule and the voxel size.
2.4 Shape Differentiation
The same segmentation process was used as that described in the previous section on volume measurement. After segmentation, surface meshes were generated for each of the nodules. For each nodule, curvature of each vertex on the surface mesh, defined as the reciprocal of local circle radius was calculated. It has been demonstrated that the rough surface has a wider range of curvatures than the smooth surface [20]. Therefore, the full width half maximum (FWHM) of the curvature histogram was used as the shape index for each nodule to represent the roughness. The shape index was then used for nodule shape differentiation between sphere and star shape nodules.
2.5 Statistical analysis
Linear regression analysis was performed to compare the PCD-CT measured volume to the reference values. Slope and intercept with their 95% confidence interval (CI) were calculated, together with R2 and root mean square error (RMSE) to evaluate the goodness of fit and accuracy of volume estimation. Receiver operating characteristic (ROC) analysis was performed and area under the ROC curve (AUC) was used as a figure of merit for the differentiation of nodule shapes (sphere vs. star).
3. RESULTS
3.1 Volume Quantification
Figure 2 shows representative PCD-CT UHR-mode axial images (Figures 2A and 2D), 3D volume rendered images (Figures 2B and 2E) and the surface curvature distribution (Figures 2C and 2F) of a star and sphere nodule, respectively. Figure 3 is an example of 3D volume comparison from images acquired by UHR mode (Figure 3A) and macro mode (Figure 3B). Table 2 summarizes the slope (95% CI), intercept (95% CI), R2 and RMSE for the linear regression analysis between measured nodule volume and reference volume for 2 modes (macro, UHR) and 2 reconstruction kernels (B46f, S80f). Results demonstrated all slope were close to 1 and R2 was close to 1, indicating that all volume measurements from the 4 PCD-CT techniques were highly linear in relation to the reference values.
Figure 2.
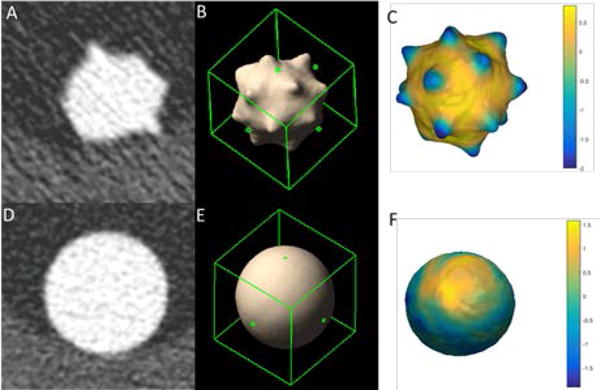
Representative UHR mode axial CTimage (A: Star, D: Sphere), 3D volume rendering (B: Star, E: Sphere) and surface curvature distribution (C: Star, F: Sphere) of a star nodule; W/L = 1500/−600 HU
Figure 3.
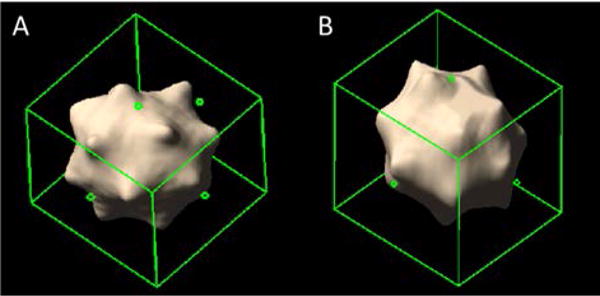
3D volume rendering comparison between UHR mode (A) and macro mode (B) for a 10 mm star-shaped lung nodule
Table 2.
Summary of linear regression of all nodules
| All Nodules | Slope (95% CI) | Intercept (95% CI) | R-Square | RMSE |
|---|---|---|---|---|
| UHR S80f | 1.03 (0.99 1.06) | 8.04 (−10.18 18.87) | 0.99 | 21.61 |
| Macro S80f | 1.02 (0.98 1.06) | 7.96 (−8.71 24.62) | 0.99 | 24.93 |
| UHR B46f | 1.03 (0.98 1.08) | 12.30 (−6.76 30.83) | 0.99 | 28.30 |
| Macro B46f | 1.02 (0.98 1.06) | 9.04 (−6.81 24.9) | 0.99 | 23.77 |
The mean absolute percent error (MAPE) of each acquisition mode/reconstruction kernel combination is shown in Figure 4. We found that UHR mode provided more accurate volume estimation with a lower MAPE for S80f kernels (6.5%) compared with UHR mode with B46f kernel (10.6%) macro mode with both kernels (11.1% for B46f, 12.8% for S80f).
Figure 4.
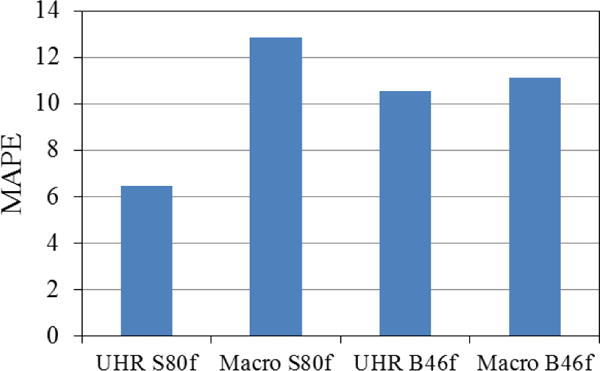
Comparison of overall MAPE of volume measurements
The volume measurement MAPE for each acquisition mode/reconstruction kernel combination was computed and compared based on lung nodule properties, including nodule size (Figure 5A), nodule CT number (Figure 5B) and nodule shape (Figure 5C). With B46f kernel UHR mode demonstrated substantially lower MAPE values for the small nodules (15.3%, for 3mm, 9.8% for 15.3%) than the macro mode (3mm: 20.1% for B46f, 24.5% for S80f: 5mm: 13.1% for B46f, 17.9% for S80f). With S80f kernel, the UHR mode further increased the volume accuracy with lowest MAPE (11.6% for 3mm, 4.9% for 5mm). For large nodule size (>5 mm), MAPE of UHR mode (7.8%–11.6% for B46f, 3.8%–6.6% for S80f) was close to that of macro mode (6.1%–9.5% for B46f, 5.0%–10.0% for S80f). This demonstrated the benefit of the UHR mode for small lung nodules, where improved spatial resolution had an obvious effect. For the high contrast nodule (+100 HU), the MAPE of UHR mode (4.6% for B46f, 3.3% for S80f) was lower than that of macro mode (8.3% for B46f, 10.6% for S80f), while for low contrast nodule (−630 HU), the MAPE of UHR mode with S80f kernel (9.6%) had a lower MAPE compared with UHR mode with B46f (16.5%) and macro mode (13.9% for B46f, 15.1% for S80f). Finally, both modes demonstrated similar errors for sphere-shaped nodules (UHR: 8.0% for B46f, 6.4% for S80f; Macro: 8.7 % for B46f, 9.4% for S80f). In contrast, UHR mode with S80f kernel had more accurate volume measurements of star shape nodules (6.5%) than did UHR with B46f kernel (13.1%) and macro mode (13.5% for B46f, 16.2% for S80f).
Figure 5.

MAPE comparison of volume measurements for nodule size (A), CT contrast (B), and nodule shape (C) between different PCD CT acquisition modes
3.2 Shape Differentiation
The shape indices for sphere and star nodules with different scan mode/reconstruction combinations are shown in Figure 6. The average shape index for sphere nodules ranged from 0.034 to 0.049, while for star nodules, it ranged from 0.090 to 0.132. For each scan mode/reconstruction combination, the average shape index of the sphere nodules was significantly lower than that of the star nodules (t test, P < 0.05). ROC curves (Figure 7) demonstrate that UHR mode had higher AUC values (0.85 for S80f and 0.75 for B46f) compared to macro mode (0.735 for S80f and 0.735 for B46f) for the discrimination of sphere and star nodules. The sharp kernel (S80f) in UHR mode had the highest AUC value (0.85).
Figure 6.
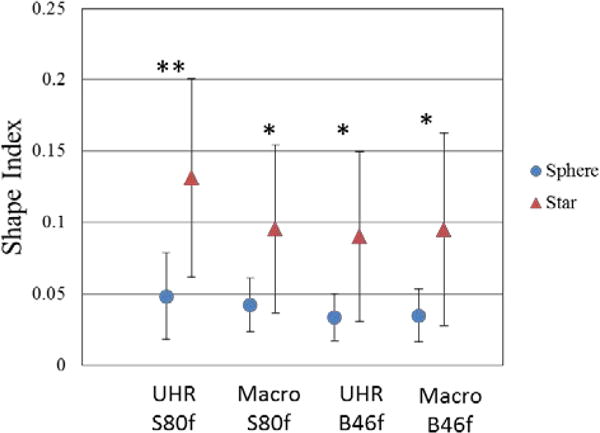
The mean and standard deviation of shape indices for sphere and star shaped nodules calculated from images obtained with different acquisition modes and reconstruction kernels. * p< 0.05 ** p<0.01, two-tail T-test
Figure 7.
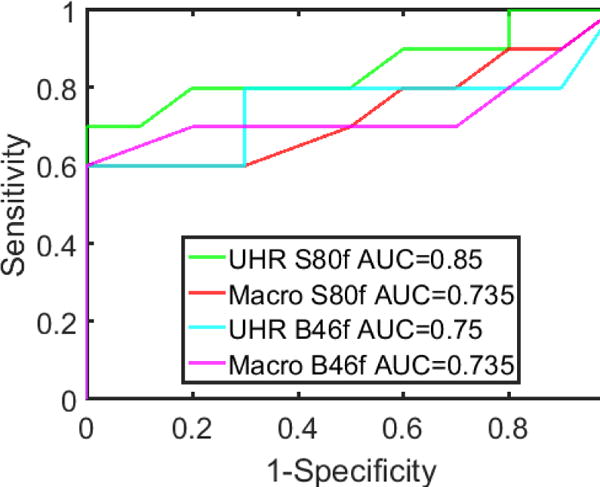
ROC curves for differentiating sphere from star shaped nodules using images with different acquisition modes and reconstruction kernels.
4. DISCUSSION AND CONCLUSION
In this study, we evaluated the lung nodule measurements for two acquisition modes (UHR and macro) in PCD CT by analyzing the accuracy of volume measurements and the ability to differentiate the sphere from star shaped nodules. This is the first quantitative characterization of lung nodules using the UHR mode of a PCD CT system. Our comparison found that the overall bias for volume estimation was reduced in UHR mode relative to that of macro mode. The volume measurements of small or star-shape nodules were notably improved with the new UHR acquisition, demonstrating the advantages of the UHR mode as a more robust quantitative tool for lung nodule characterization. Moreover, our results demonstrated that the UHR mode increased the capability to differentiate sphere from star shaped nodules. With its improved spatial resolution, the UHR mode of the evaluated PCD CT is able to improve measurements of nodule growth and nodule shape characterization. The results of this study indicate the potential for the UHR mode of the PCD CT system to have a substantial impact on lung imaging, as well as other applications that are now limited by spatial resolution.
Acknowledgments
This project was supported by NIH Grant Number EB016966 from the National Institute of Biomedical Imaging and Bioengineering.
References
- 1.Siegel RL, Miller KD, Jemal A. Cancer statistics, 2016. CA Cancer J Clin. 2016;66(1):7–30. doi: 10.3322/caac.21332. [DOI] [PubMed] [Google Scholar]
- 2.Kohler BA, Sherman RL, Howlader N, et al. Annual Report to the Nation on the Status of Cancer, 1975–2011, Featuring Incidence of Breast Cancer Subtypes by Race/Ethnicity, Poverty, and State. J Natl Cancer Inst. 2015;107(6):djv048. doi: 10.1093/jnci/djv048. [DOI] [PMC free article] [PubMed] [Google Scholar]
- 3.Henschke CI, McCauley DI, Yankelevitz DF, et al. Early Lung Cancer Action Project: overall design and findings from baseline screening. Lancet. 1999;354(9173):99–105. doi: 10.1016/S0140-6736(99)06093-6. [DOI] [PubMed] [Google Scholar]
- 4.Pastorino U, Bellomi M, Landoni C, et al. Early lung-cancer detection with spiral CT and positron emission tomography in heavy smokers: 2-year results. Lancet. 2003;362(9384):593–7. doi: 10.1016/S0140-6736(03)14188-8. [DOI] [PubMed] [Google Scholar]
- 5.T. National Lung Screening Trial Research. Church TR, Black WC, et al. Results of initial low-dose computed tomographic screening for lung cancer. N Engl J Med. 2013;368(21):1980–91. doi: 10.1056/NEJMoa1209120. [DOI] [PMC free article] [PubMed] [Google Scholar]
- 6.MacMahon H, Austin JHM, Gamsu G, et al. Guidelines for management of small pulmonary nodules detected on CT scans: A statement from the Fleischner Society. Radiology. 2005;237(2):395–400. doi: 10.1148/radiol.2372041887. [DOI] [PubMed] [Google Scholar]
- 7.Kappler S, Henning A, Kreisler B, et al. Photon counting CT at elevated X-ray tube currents: contrast stability, image noise and multi-energy performance. 9033:90331C-90331C-8. [Google Scholar]
- 8.Kappler S, Glasser F, Janssen S, et al. A research prototype system for quantum-counting clinical CT. 7622:76221Z-76221Z-6. [Google Scholar]
- 9.Kappler S, Hannemann T, Kraft E, et al. First results from a hybrid prototype CT scanner for exploring benefits of quantum-counting in clinical CT. 8313:83130X-83130X-11. [Google Scholar]
- 10.Shikhaliev PM. Energy-resolved computed tomography: first experimental results. Phys Med Biol. 2008;53(20):5595–613. doi: 10.1088/0031-9155/53/20/002. [DOI] [PubMed] [Google Scholar]
- 11.Shikhaliev PM. Computed tomography with energy-resolved detection: a feasibility study. Phys Med Biol. 2008;53(5):1475–95. doi: 10.1088/0031-9155/53/5/020. [DOI] [PubMed] [Google Scholar]
- 12.Iwanczyk JS, Nygard E, Meirav O, et al. Photon Counting Energy Dispersive Detector Arrays for X-ray Imaging. IEEE Trans Nucl Sci. 2009;56(3):535–542. doi: 10.1109/TNS.2009.2013709. [DOI] [PMC free article] [PubMed] [Google Scholar]
- 13.Persson M, Huber B, Karlsson S, et al. Energy-resolved CT imaging with a photon-counting silicon-strip detector. Phys Med Biol. 2014;59(22):6709–27. doi: 10.1088/0022-3727/59/22/6709. [DOI] [PubMed] [Google Scholar]
- 14.Yu Z, Leng S, Jorgensen SM, et al. Evaluation of conventional imaging performance in a research whole-body CT system with a photon-counting detector array. Phys Med Biol. 2016;61(4):1572–95. doi: 10.1088/0031-9155/61/4/1572. [DOI] [PMC free article] [PubMed] [Google Scholar]
- 15.Gutjahr R, Halaweish AF, Yu ZC, et al. Human Imaging With Photon Counting-Based Computed Tomography at Clinical Dose Levels: Contrast-to-Noise Ratio and Cadaver Studies. Investigative Radiology. 2016;51(7):421–429. doi: 10.1097/RLI.0000000000000251. [DOI] [PMC free article] [PubMed] [Google Scholar]
- 16.Leng S, Yu Z, Halaweish A, et al. Dose-efficient ultrahigh-resolution scan mode using a photon counting detector computed tomography system. Journal of Medical Imaging. 2016;3(4):043504–043504. doi: 10.1117/1.JMI.3.4.043504. [DOI] [PMC free article] [PubMed] [Google Scholar]
- 17.Jorgensen SM, Korinek MJ, Vercnocke AJ, et al. Arterial wall perfusion measured with photon counting spectral x-ray CT. 9967:99670B-99670B-8. doi: 10.1117/12.2238817. [DOI] [PMC free article] [PubMed] [Google Scholar]
- 18.Shikhaliev PM, Fritz SG. Photon counting spectral CT versus conventional CT: comparative evaluation for breast imaging application. Phys Med Biol. 2011;56(7):1905–30. doi: 10.1088/0031-9155/56/7/001. [DOI] [PubMed] [Google Scholar]
- 19.Yu Z, Leng S, Jorgensen SM, et al. Initial results from a prototype whole-body photon-counting computed tomography system. Proc SPIE Int Soc Opt Eng. 2015;9412 doi: 10.1117/12.2082739. [DOI] [PMC free article] [PubMed] [Google Scholar]
- 20.Duan X, Qu M, Wang J, et al. Differentiation of calcium oxalate monohydrate and calcium oxalate dihydrate stones using quantitative morphological information from micro-computerized and clinical computerized tomography. J Urol. 2013;189(6):2350–6. doi: 10.1016/j.juro.2012.11.004. [DOI] [PMC free article] [PubMed] [Google Scholar]


