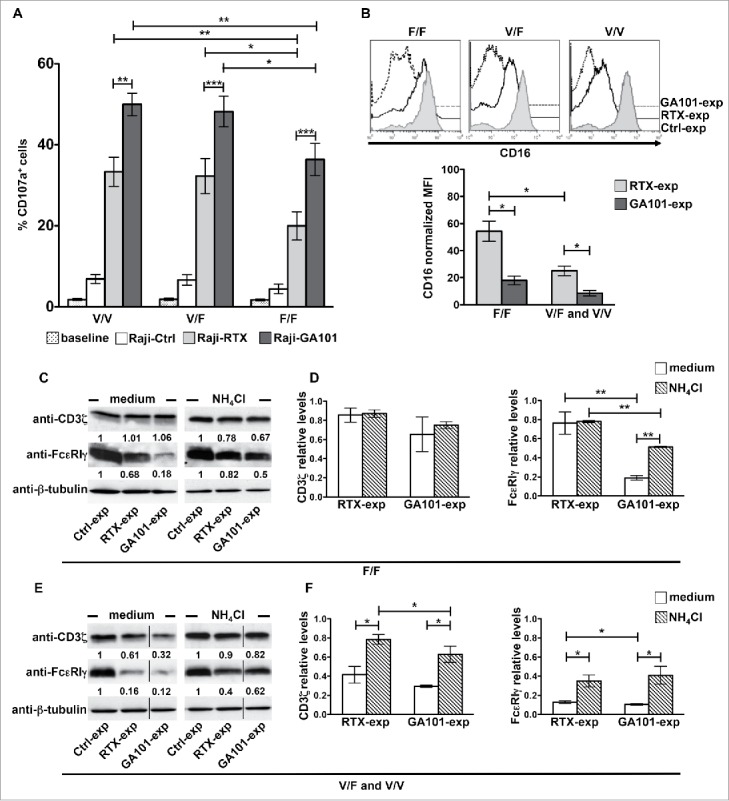
Figure 3.

CD16 engagement by obinutuzumab-opsonized targets results in enhanced degranulation as well as FcεRIγ lysosomal degradation irrespective of FCGR3A-V158F polymorphism. (A) PBMCs were left alone (baseline) or allowed to interact (2:1) with rituximab (Raji-RTX)-, obinutuzumab (Raji-GA101)-opsonized or non-opsonized Raji (Raji-Ctrl) for 6 h. The percentage of CD107a+ cells among CD3−CD56+ was evaluated by FACS analysis in individuals grouped by FCGR3A genotype (high-affinity allele V, low-affinity F; V/V, n = 6; V/F, n = 6; F/F, n = 6). Data are presented as mean ± SEM. *p < 0.05, **p < 0.01, ***p < 0.001. For each group, compared with baseline or Raji-Ctrl samples, all the differences were statistically significant (p < 0.001). (B–F) Primary cultured NK cells (n = 5/genotype) were isolated upon 18 h co-culture (2:1) with biotinylated rituximab (RTX-exp)-, obinutuzumab (GA101-exp)-opsonized or non-opsonized Raji (Ctrl-exp) in the presence of medium alone (medium) or, when indicated, with 20 mM NH4Cl. (B) CD16 surface expression was evaluated by FACS analysis by anti-CD16 (Leu11c) mAb in individuals grouped by FCGR3A genotype. (Top) Histogram overlay of one representative donor/genotype .is shown and (bottom) normalized CD16 MFI calculated as described in Fig. 2A are depicted in bar graph (mean ± SEM). *p < 0.05. (C, E) An equal amount of proteins from whole cell lysates was immunoblotted as indicated. The same membrane was immunoblotted with anti-FcεRIγ and, after stripping, with anti-CD3ζ Abs followed by anti-β-tubulin for sample normalization. Membranes containing untreated- (medium) or NH4Cl-treated samples were developed in the same film. The black vertical lines indicate that intervening lanes were sliced out. The numbers represent the relative protein amount of the indicated proteins obtained by normalizing to the level of β-tubulin and expressed as fold change respect to Ctrl-exp samples (arbitrarily set to 1). One representative experiment is shown. (D, F) The relative values (mean ± SEM) of CD3ζ or FcεRIγ chains from five independent experiments are depicted in bar graphs.*p < 0.05, **p < 0.01.
