Abstract
Glioblastoma multiforme (GBM) is one of the deadliest human cancers and is characterized by tumor cells that hijack immune system cells in a deadly symbiotic relationship. Microglia and glioma-infiltrating-macrophages (GIMs), which in principle should mount an immune response to the tumor, are subverted by tumor cells to facilitate growth in several ways. In this study we seek to understand the interactions between the tumor cells and the microglia that enhance tumor growth, and for this purpose we develop a mathematical and computational model that involves reaction-diffusion equations for the important components in the interaction. These include the densities of tumor and microglial cells, and the concentrations of growth factors and other signaling molecules. We apply this model to a transwell assay used in the laboratory to demonstrate that microglia can stimulate tumor cell invasion by secreting the growth factor TGF-β. We show that the model can both replicate the major components of the experimental findings and make new predictions to guide future experiments aimed at the development of new therapeutic approaches. Sensitivity analysis is used to identify the most important parameters as an aid to future experimental work. The current work is the first step in a program that involves development of detailed 3D models of the mechanical and biochemical interactions between a glioblastoma and the tumor microenvironment.
Index Terms: Hybrid model, Glioblastoma, microenvironment, microglia, astrocyte, TGFbeta, EGF, CSF-1, E-cadherin
I. Introduction
Tumor growth is a complex evolutionary process driven by dynamic feedback between a heterogeneous cell population and selection pressures from the tumor microenvironment (TME). The TME comprises the extracellular matrix (ECM), growth promoting and inhibiting factors, nutrients, chemokines, and other cell types in the stromal tissue. Alterations in gene regulation and signaling networks involved in cell proliferation and survival have been studied by many, but there is little understanding of how the chemical and mechanical signals from the TME interact to affect tumor progression. Here we study one aspect of this question in the context of brain tumors.
Most brain cancers are malignant gliomas, the most aggressive form of which is called GBM. These tumors are highly invasive, and they spread rapidly, which makes them difficult to completely remove surgically. GBM tumors stem from glial cells, a class of neural cells that includes both astrocytes and resident brain macrophages (microglia). GIMs can comprise up to one third of the total tumor mass [1], and apparently originate from both microglia and monocyte-derived macrophages from the circulation [2]. Activated GIMs exhibit two distinct phenotypes: the classically-activated, tumor-suppressive type (M1), and an alternatively-activated, tumor-promoting, immunosuppressive type (M2) [3]. The balance between these phenotypes is usually tilted to the M2 form [4], and numerous factors secreted by glioma cells, including growth factors, chemokines, cytokines and matrix proteins, can influence GIM recruitment and phenotypic switching [5], [6].
Transforming growth factor beta (TGF-β) is one of the growth factors involved in maintenance of tissue homeostasis. The receptor for TGF-β is a heterotetramer of dimeric Type I and Type II receptors, and occupation leads to phosphorylation of transcription factors in the SMAD family [7] (cf. Figure 1). Normally TGF-β acts to control growth via its effect on the cell cycle, but when up-regulated in GBM tumors it stimulates growth [8]. TGF-β also acts to stimulate glioma cell migration, as shown in a transwell assay described in Figure 2(A). When microglia are plated in the bottom chamber, TGF-β acts as a chemotactic attractant for glioma cells in the upper chamber, and silencing of the Type II receptor on glioma cells with shRNAs abolishes their migration [9]. More recent work has shown that the stimulative effect on invasiveness primarily acts on the stem-cell-like tumor sub-population [10].
Fig. 1. The interaction of the CSF-1, EGF and TGF-β pathways in the control of cell proliferation and invasion in glioblastoma.
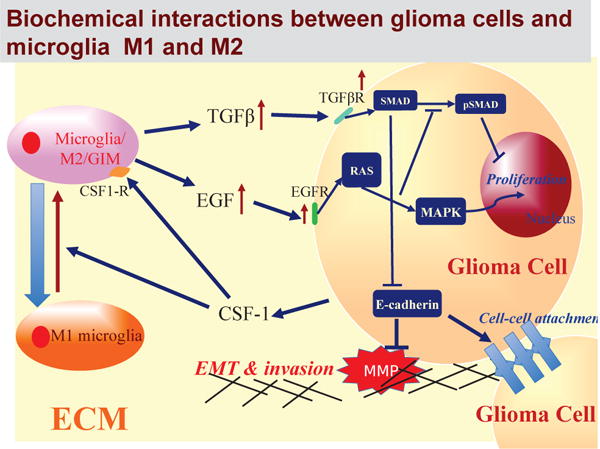
In normal cells these pathways are balanced so as to control growth, but in gliomas increased secretion of CSF-1 by tumor cells induces the M1→M2 transformation of the microglia and stimulates their secretion of EGF. This disrupts the proliferation-inhibition mechanism by partially blocking the TGF-β -Smad pathway and stimulates proliferation and invasion.
Fig. 2. Experimental and mathematical configuration.
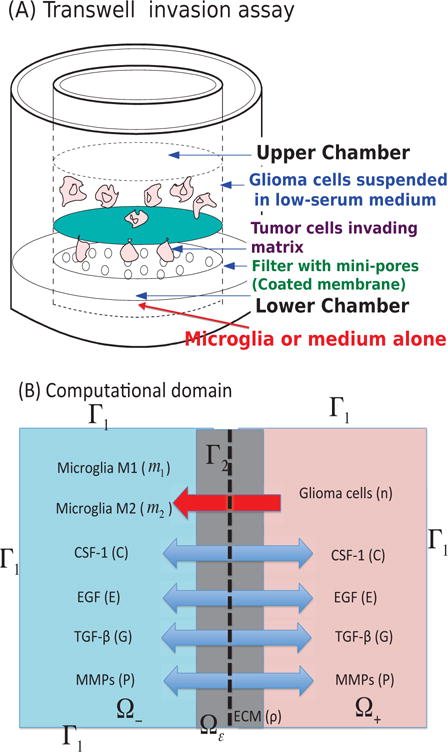
(A) The Boyden transwell invasion assay used in [9]. Glioma cells were suspended in low-serum medium in the upper chamber while microglia or medium alone (control) were put into the lower chamber. Semi-permeable inserts of 12 μm pore diameter coated with Matrigel ECM were inserted in the filter. In response to TGF-β secreted by microglia in the lower chamber, glioma cells degrade the ECM proteolytically and invade the lower chamber. The number of migrating cells on the lower surface of the permeable membrane were counted after 36 h in the absence and presence of microglia in the lower chamber. (B) A schematic of the 1D representation of the assay chamber: CSF-1, EGF, TGF-β, MMP, and tumor cells can cross the semi-permeable membrane, but neither type of microglia can cross it. Initially the glioma cells reside in the upper chamber (domain Ω+) while microglia are placed in the lower chamber (domain Ω−).
Other growth factors such as epidermal growth factor (EGF) and colony stimulating factor-1 (CSF-1) are also important in tumor development. GIMs require CSF-1 for survival, and it enhances the phenotypic M1 → M2 transition as well [11]. This is but one step in a paracrine signaling loop in which CSF-1 released by tumor cells stimulates GIMs to express EGF and infiltrate the tumor, and the EGF in turn acts on the tumor cells to promote their invasiveness. Blocking the CSF-1R receptor on GIMs inhibits their enhancement of tumor cell invasion [12], [5]. Proteases such as MMP-2 that degrade the extracellular matrix also play a role in dispersal of GBM cells, in that tumor cells induce GIMs to secrete MMP-2 [13].
Many biochemical and mechanical processes underlie the interactions in Figure 1, and it would be difficult to develop a comprehensive model of the tumor microenvironment that incorporates all of them. As a first step we focus here on one aspect for which there is experimental data – the chemotactic response of tumor cells to TGF-β. We develop a model based on reaction-diffusion equations that govern cell-cell signaling and cell dispersal with the goal of understanding the factors that are important in determining the chemotactic movement of glioma cells from the upper to the lower well of the Boyden chamber assay shown in Figure 2(A). We show that the model can reproduce many of the experimental observations and we make predictions as to how various interventions can affect the outcome.
II. The Mathematical Model For Transwell Experiments
The geometries of the experimental and computational domains are shown in Figure 2, and details of the experimental and computational setup are given in the figure caption. The mathematical model involves the densities of glioma cells (n), of M1 and M2 microglia (m1 and m2), and of the extracellular matrix (ρ), as well as the concentration of CSF-1 (C), of EGF (E), of TGF-β (G), and of MMPs (P), all a function of (x, t). The evolution equations for these components are developed in generality below, but in this paper we focus on the transwell assay in one space dimension.
A. Glioma cell density (= n(x, t))
The mass balance equation for the tumor cell density n(x, t) is
| (1) |
where Jn is the flux and Pn is the net production rate of glioma cells. The flux Jn is comprised of three parts, Jrandom, Jchemo, and Jhapto, which are the fluxes due to random motion, chemotaxis, and haptotaxis, respectively [14]. We assume that the ECM is homogeneous and isotropic, and that the flux due to the random component of motility is given by
| (2) |
where Dn is the diffusion coefficient, which is assumed to be constant. In brain tissue, glioma cells are strongly chemotactic to TGF-β [15], and therefore the chemotactic flux is assumed to be of the form
| (3) |
where χn is the chemotactic sensitivity and λG is a scaling parameter. This form reduces to the standard form under small gradients and saturates under large gradients.
Glioma invasiveness is enhanced by proteolytic degradation of the ECM via MMPs that are produced by glioma cells a the TGF-β–SMAD–E-cadherin–MMP pathway [16], [9]. This leads to local degradation of ECM [14] and movement in the direction of the gradient ∇ρ via a process called haptotaxis. We represent the haptotactic flux as
| (4) |
where is the haptotactic sensitivity and λρ is a scaling parameter.
The production of tumor cells is due to active EGF-stimulated growth, which we represent as follows.
| (5) |
Here a1 is the proliferation rate of tumor cells in the absence of EGF, kE, l are Hill-function parameters for activation of proliferation in the presence of EGF, and κ(x) is the spacedependent carrying capacity of the tumor in a given tumor environment (a1, kE, κ(x) ∈ ℝ+, l ∈ ℤ+).
Combining the fluxes and growth term leads to the governing equation for the tumor cells:
| (6) |
B. Densities of M1 (= m1(x, t)) & M2 (= m2(x, t)) type microglia
The evolution of the densities of microglia follows reaction-diffusion equations similar to those for tumor cells, but with the following assumptions. (i) Activated M2 – but not M1 – cells are chemotactic to the CSF-1 secreted by tumor cells [5], and the flux is of the form (3), but with a different sensitivity. Since the microglia produce TGF-β (see later references), the movement of activated microglia further enhances glioma invasiveness via the TGF-β-SMAD-E-cadherin-MMP pathway described earlier. (ii) The inactive (M1) microglia transform into the active M2 type at the rate a3 in the presence of CSF-1. (iii) Both phenotypes proliferate — with rate constants a2 and a4, respectively. This leads to following evolution equations.
| (7) |
| (8) |
C. Tumor ECM density (=ρ(x, t))
The tumor ECM provides structural support for cell migration, but it must also be degraded for cell migration by proteases such as the tumor-secreted MMPs. The rate of tumor ECM change can be expressed as
| (9) |
for ρ > 0, and 0 otherwise. Here dρ is the degradation rate by MMPs secreted by tumor cells. This equation describes degradation when there is a significant level of ECM present, as is normally the case.
D. CSF-1 concentration (= C(x, t))
Glioma cells secrete CSF-1 in order to recruit the stromal cells such as microglia [5]. CSF-1 is also needed for the activation of M1 into the aggressive M2 type, which in turn promotes tumor cell invasion [17], [18], [5], [9]. Thus the governing equation for CSF-1 is
| (10) |
where a5 is the secretion rate of CSF-1 by glioma cells and dC is the decay rate of CSF-1.
E. EGF concentration (= E(x, t))
We take into account diffusion, secretion, and first-order decay in the system. Activated microglia and macrophages are the major source of EGF in gliomas, and thus the governing equation for EGF is
| (11) |
where a6 and B1a6 are secretion rates of EGF by M1 type and M2 type of microglia, respectively, and dE is the decay rate of EGF. Here, a6 ≪ 1, B1 ≫ 1.
F. TGF-β concentration (= G(x, t))
Activated microglia and macrophages are the primary source of TGF-β in experimental rat gliomas or after brain injury [9], [19], [20], and the gradients created by diffusion promote chemotactic movement of tumor cells. In addition to diffusive transport of TGF-β there is a convective flux due to chemotactic movement of the microglia in reponse to CSF-1, but this is neglected here, and thus the governing equation for TGF-β is as follows.
| (12) |
Here a7 and B2a7 are secretion rates of TGF-β by M1 and M2 types of microglia, respectively, B2 is a scaling parameter, and dG is the decay rate. We assume that a7 ≪ 1 and B2 ≫ 1.
G. MMP concentration (= P (x, t))
We suppose that glioma cells secrete MMPs for degradation of the ECM in response to TGF-β signaling from microglia, as found in [16], [9]. It was also shown that antibody against TGF-β receptors blocks this effect in invasion assays [9]. Thus
| (13) |
where a9 is the MMP production rate by glioma cells, B3 is a scale factor, dP is the decay rate of MMPs, I(·) is the indicator function, and thG is a threshold value for activation of MMP secretion. In general, the diffusion coefficient of MMPs is very small (DP ≪ 1) and the half-life of MMPs is short (μP ≫ 1) [21].
H. Boundary conditions and initial conditions
In the following simulations we prescribe Neumann boundary conditions on the exterior boundary Γ1 (cf. Figure 2).
| (14) |
where ν is the unit outer normal vector. The membrane is permeable to all variables (n, m1, m2, C, E, G, P), but not freely so. We describe the flux at Γ2 for these variables u = (n, m1, m2, C, E, G, P) as
| (15) |
where
| (16) |
and the parameter γi (i = 1,…, 8) is determined by the size and density of the holes (see [22] for the derivation of these boundary conditions by the method of homogenization). If the size or density of the holes in the membrane is increased, the membrane becomes more permeable, and γi increases.
The entire system of equations (6)–(15) can be put into non-dimensional form for use in the simulations. This is done in the supplemental material and the parameters are defined there. Hereafter we restrict the computational domain to one space dimension, and the domain is scaled to unit length.
III. Computational Results
In this section we compare the predictions of the mathematical model with experimental observations, and then suggest a therapeutic strategy for blocking invasive glioma cells.
A. Predictions of the computational model
The density profiles of all variables in the model are shown in Figure 3 at t = 0, 18, 36 h in the presence of M1/M2 microglia in the lower chamber. Here the right half of the domain corresponds to the upper chamber in the transwell. By digesting the ECM, tumor cells in the upper chamber can invade the lower chamber and interact with M1/M2 cells. Tumor cells secrete CSF-1 (Figure 3C), which promotes the M1 → M2 transformation (Figure 3D). Both M1 & M2 cells secrete EGF (Figure 3E) and TGF-β (Figure 3F) to stimulate chemotactic movement of glioma cells. Tumor cells degrade the ECM using the MMP near the membrane, where TGF-β can exceed the threshold for MMP secretion, and invade the left chamber (Figure 3A,B). As they invade, they detect higher levels of EGF and TGF-β, and proliferate at a higher rate.
Fig. 3. Dynamics of the system.
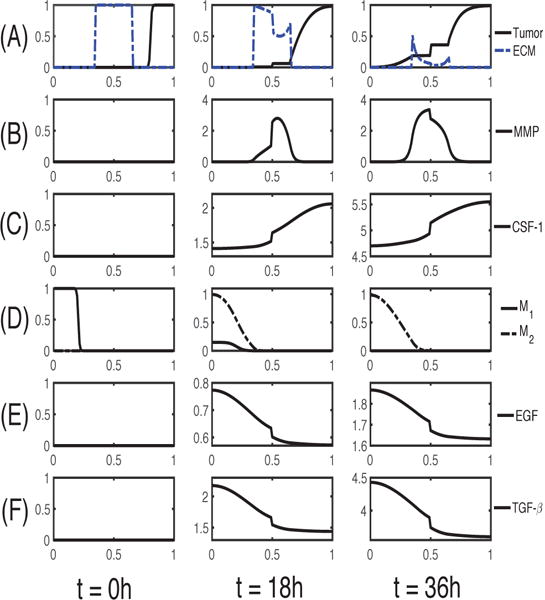
The time evolution of the density of each variable. (A) glioma cells and ECM (B) MMP (C) CSF-1 (D) M1/M2 cells (E) EGF (F) TGF-β. Here, ECM = [0.35, 0.65]. Note that the initial concentrations of CSF-1, EGF and TGF-β are uniformly zero, as in experiments. The x-axis is the dimensionless length across the tumor invasion chamber and the y-axis in each frame is the dimensionless density/concentration of the indicated.
A comparison of simulation results with experimental results is shown in Figure 4. After 36h the number of glioma cells invading the lower chamber doubled in the co-culture with microglial cells (Neg/9+microglia in Figure 4A) in the lower chamber as compared to the control (Neg/9 in Figure 4A) [9]. In the simulations, the number of invading glioma cells increased ∼2-fold in the presence of M1/M2 microglia in the lower chamber (+MG in Figure 4B) relative to the control (absence of microglia; −MG in Figure 4B). As Wesolowska et al. [9] remark, tumor cells invade the lower chamber even in the absence of microglia in the chamber, which demonstrates the intrinsic invasiveness of these cells.
Fig. 4. Experimental data and simulation results.
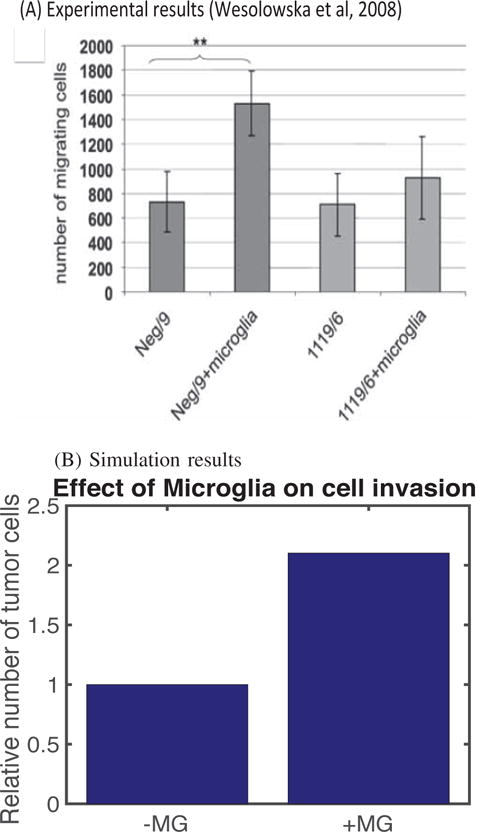
(A) The plot shows the number of glioma cells that migrate through the membrane in the absence (Neg/9 and 1119/6) or presence (Neg/9+microglia and 1119/6+microglia) of microglia at t = 36 h after seeding at a density of 4×10⁴ cells/insert. The results shown are from three independent experiments, each in triplicate, in which the invading glioma cells were stained with DAPI (4′,6-diamidino-2-pheylindole) [9]. (B) Simulation results showing how the number of migrating glioma cells increases in the presence of M1/M2 microglia (+MG) in the lower chamber compared to the absence of microglia (−MG).
In Figure 5, we investigate the effect of antibody against TGF-β on tumor invasion. In the experiments, Wesolowska et al. [9] found that the neutralizing antibody (Ab) abrogated the invasion-promoting effect of microglia in the lower chamber, i.e., the number of migrating cells was reduced in the presence of the antibody (+MG+Ab) when compared to the MG case in the absence of the antibody (+MG−Ab). Wesolowska et al. [9] showed that a knockdown of TGF-β type II receptor (TβIIR) by plasmid-transcribed shRNA can effectively inhibit TGF-β signaling and transcriptional responses, thus blocking invasiveness of human glioblastoma cells. They also found that a stable knockdown of TβIIR expression can impair growth of gliomas in nude mice. The mathematical model also predicts that the invasiveness of tumor cells is inhibited in the presence of antibody against TGF-β (+MG+Ab) relative to control cases: −MG-Ab (no M1/M2 in the lower chamber; no antiboy), +MG−Ab (M1/M2 in the lower chamber; no antibody). See Figure 5B. However, one should note that this antibody, or TGF-β blocking, is not enough to completely block the aggressive invasion of glioma cells, since they invade in the absence of microglia.
Fig. 5. A neutralizing antibody against TGF-β can abrogate the invasion-boosting effects of microglia.
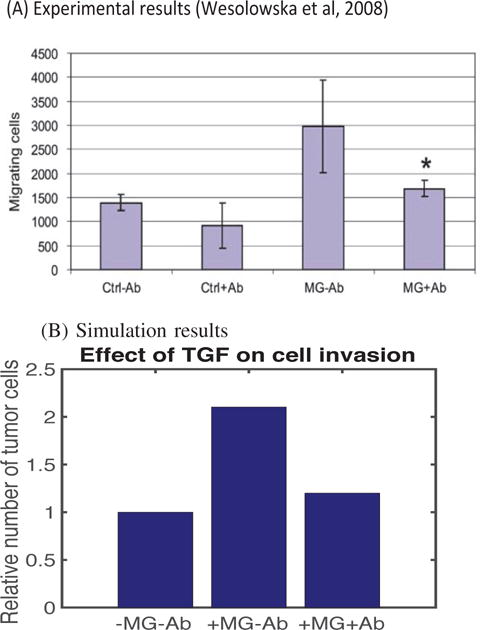
(A) Experimental data from the invasion assay in [9]. The graph shows the number of migrating glioma cells in the absence (Ctrl) or presence (MG) of microglia after introducing anti-TGF-β mAb. In the absence of antibody, the number of invading tumor cells more than doubled from the control case (Ctrl-Ab) in the presence of migroglia (MG−Ab). However, addition of antibody reduces the number of invading glioma cells by almost 50%. (B) Simulation results. In the absence of antibody, an introduction of M1/M2 microglia (+MG−Ab) in the lower chamber Increased the number of migrating glioma cells compared to the absence of microglia (−MG−Ab). However, this invasion-promoting effect can be neutralized by adding antibody to the system. In the simulation, we set a7 = 0 (complete blocking TGF-β secretion by M1/M2).
The results of computational studies on the effect of haptotaxis and chemotaxis of glioma cells on cell infiltration into the lower chamber are shown in Figure 6. This shows the tumor density (A) and the populations of invasive glioma cells (B) at t = 36 h as a function of the chemotactic sensitivity χn. One sees that as χn increases, the populations of invasive glioma cells increase, they move faster toward the transfilter and divide faster in the lower chamber, all leading to increased total glioma populations. Figures 6 (C & D) show the tumor densities in the lower chamber and the corresponding number of migrated glioma cells at t = 36 h as a function of the haptotactic sensitivity . As expected, as increases, the number of migrating glioma cells increases, and they invade the lower chamber faster. We also investigated the combined effect of χn and on the invasive glioma cell populations at 36 h (data not shown). Again, as expected, the results show that glioma cells invade faster when they have higher sensitivities of both haptotaxis and chemotaxis. Moreover, the combined effect is more evident in the left chamber due to the stronger interaction between tumor cells in the upper chamber and M1/M2 cells in the lower chamber.
Fig. 6. The effect of chemotaxis and haptotaxis on invasion.
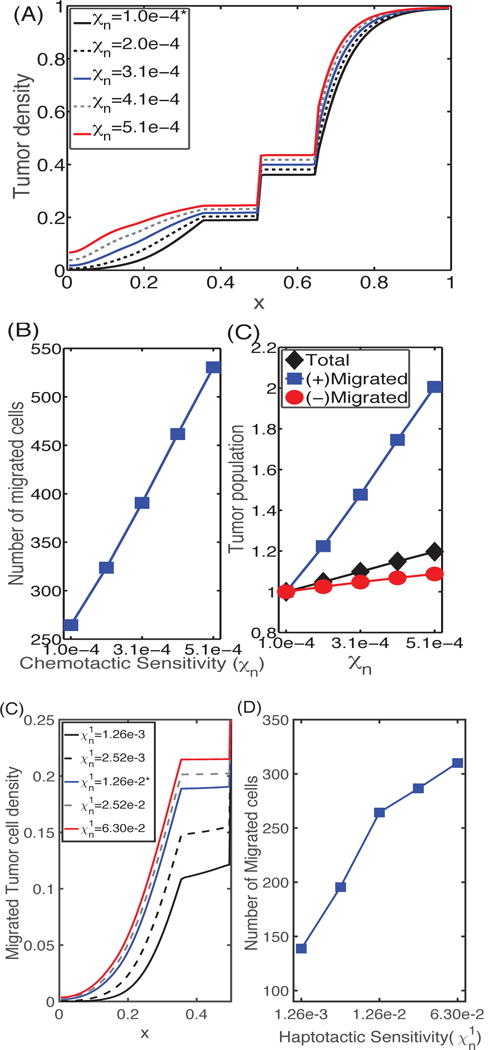
(A) Profiles of the tumor cell density at t = 36 h for different values of the chemotactic sensitivity χn. (B) (left) The number of cells that have migrated, and (right) the relative populations of invasive cells (squares), cells in the upper chamber (circles), and the total number of cells (diamonds) at t = 36 h as a function of chemotactic sensitivity. As χn increases, the number of migrating cells is increased. (C) Profiles of tumor cell densities at t = 36 h for different values of the haptotactic parameter ; (D) The population of migrating cells in the lower chamber as a function of . As the haptotactic parameter increases the tumor cells invade into the region initially occupied by the M1 cells more rapidly. Here and hereafter cell numbers are derived from the continuum density using the total number of cells in [9].
If we increase the rate a3 of differentiation of tumor-suppressive cells (M1) to tumor-enhancing cells (M2), the total population of microglia increases due to the higher proliferation rate of M2 cells, as shown in Figure 7A. M1-and M2-dominant spatial profiles of microglia for lower (a3 = 1.61 × 10⁻³; red) and larger (a3 = 1.61 × 10⁻¹; gray) transition rates, respectively, in the lower chamber at the final time are shown in Figure 7B. Figure 7C shows the tumor density in the whole domain. For larger a3, more aggressive M2 cells in the lower chamber can interact with tumor cells in the upper chamber (red curve in Figure 7C). This leads to an increased tumor population (1st column in Figure 7D) and enhanced glioma invasion (2nd column in Figure 7D). This enhanced invasiveness of the tumor cells is the result of the mutual interactions between tumor cells and the microglia. For large a3 the M1 type cells are completely converted into the M2 phenotype (solid red curves in Figure 7E, 7F; a3 = 1.61×10⁻¹), leading to efficient tumor invasion. However, when this transition rate is small (a3 = 1.61 × 10⁻³), the less effective M1 type persists in the lower chamber (black solid curve in Figure 7E) with less population of the M2 phenotype (black curve in Figure 7F). This leads to slower production of TGF-β and lower MMP secretion by tumor cells, which in turn results in a reduction in the population of invasive glioma cells by more than 25% (Figure 7D).
Fig. 7. The effect of the M1→M2 transformation on glioma invasion and M1/M2 dynamics.
(A) Scaled population levels of M1 and M2 cells at the final time (t = 36h) for various values of the differentiation rate a3. (B) Density profiles of the M1 and M2 phenotypes in the lower chamber at the final time. (C) Tumor density profiles at the final time for various transformation rates of M1 into M2 phenotype. (D) Tumor populations of invasive cells, growing cells in the upper chamber, and total cells at the final time. (E,F) The time courses of the M1 and M2 populations for various M1→M2 transition rates a3.
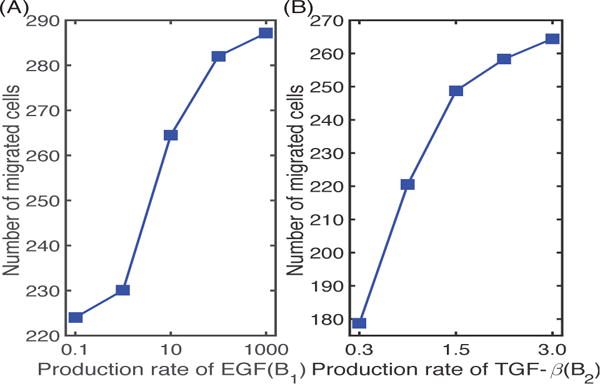
In Figure 8 we illustrate the effect of the M2 phenotype on the regulation of tumor cell invasion. As the secretion rate of EGF by M2 cells increases, the number of migrating tumor cells also increases (by 28%), since this leads to stronger interactions of M1 and M2 in the lower chamber with tumor cells in the upper chamber and faster growth of the latter. On the other hand, a decrease in the production rate B2 of TGF-β by M2 cells results in a significant decrease (33%) in the number of migrating cells, due to a decreased gradient of TGF-β for chemotaxis and to partial inhibition of MMP production via TGF-β-MMP signaling, as found in the experiments [9].
Fig. 8. The effect of EGF and TGF-β on glioma invasion.
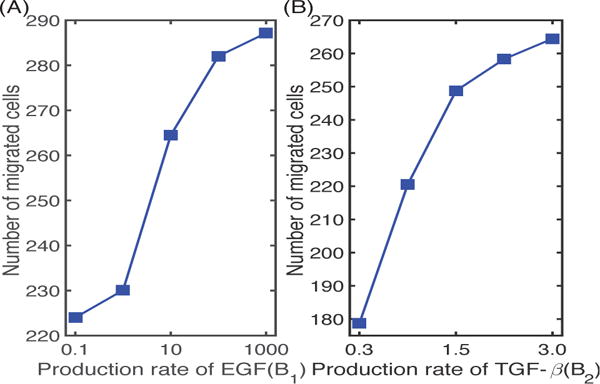
(A) The number of migrating glioma cells at t = 36 h for various secretion rates of EGF by M2 cells. (B) The number of migrating glioma cells at t = 36 h for various secretion rates of TGF-β by M2.
Figure 9 shows the results of simulating the population of migrating tumor cells for different values of the transfilter permeability γ0, which reflects the pore size in the membrane. One sees that as the membrane becomes more permeable to tumor cells, the number in the lower chamber increases, as expected. This is the result of the ease of crossing combined with the increased rate of proliferation in the higher EGF found in the lower chamber. In the experiments [9], the pore size of the transmembrane was 12 μm, corresponding to γ0 =78.5 in the model. Cells cannot cross the transfilter when the pore size is much smaller than their diameter, which is reflected in Figure 9A, albeit at a very low γ0, because the homogenization involves a limit as the pore size goes to zero [22].
Fig. 9. The effect of the the transwell membrane permeability (γ0) on glioma cell invasion.
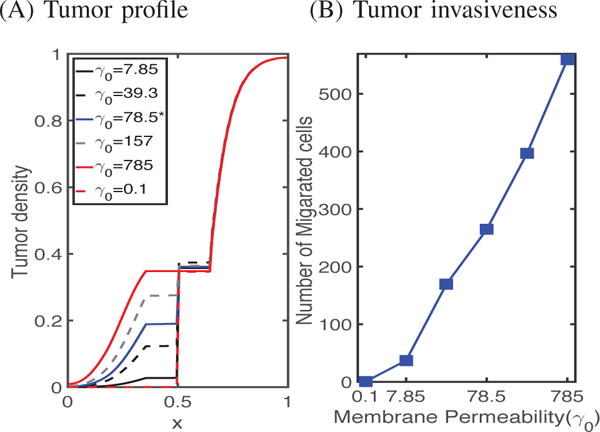
(A) Tumor densities at the final time (t = 36 h) for various values of the permeability γ0 of the transfilter separating the chambers. (B) The number of cells crossing in 36 hours as a function of the permeability.
B. Sensitivity analysis
The model developed in previous sections contains thirty-four parameters, many of which are available in the literature or which can be estimated, but there are some for which no experimental data are known. These parameters are χn, , χm, aE, a2, a3, a4, B1, B2, B3, γC, γM, and in order to determine how sensitive is the number of migratory glioma cells after 12, 24 or 36 hours to these parameters, we have performed a sensitivity analysis using a method developed in [23]. We have chosen a physically-reasonable range for each of these parameters, and divided each range into 1,000 intervals of uniform length, with all other parameters fixed at values given in Tables I & II in the supplemental material. For each of the twelve parameters of interest, a partial rank correlation coefficient (PRCC) value is calculated. The PRCC values range between -1 and 1 with the sign determining whether an increase in the parameter value will decrease (−) or increase (+) the variable of interest at a given time. Both the PRCC values and the associated p-value for the twelve perturbed parameters (χn, , χm, aE, a2, a3, a4, B1, B2, B3, γC, γM). are computed and recorded in Figure 10, which shows the sensitivities to parametric variations for populations of tumor cells: , M1 cells: , and M2 cells: , and concentrations of ECM: , CSF-1: , EGF: , TGF-β: , and MMPs: at t =12, 24, and 36 hours. The results show that the tumor population is most strongly positively correlated with aE,, moderately correlated with χn, & B1, and only weakly correlated with , χm, a4, B3, γC, & γM. While the M1 population is insensitive to most parameters, it is, not surprisingly, negatively correlated with the transformation rate of type M1 to type M2 (a3). On the other hand, the M2 phenotype is positively correlated with a2 and a4, but is only weakly correlated with other parameters. One also sees that the ECM density is negatively correlated with aE, and that the growth rate of the M2 phenotype (a4) is very sensitive to the M2 population level and the concentrations of EGF and TGF-β.
Fig. 10.
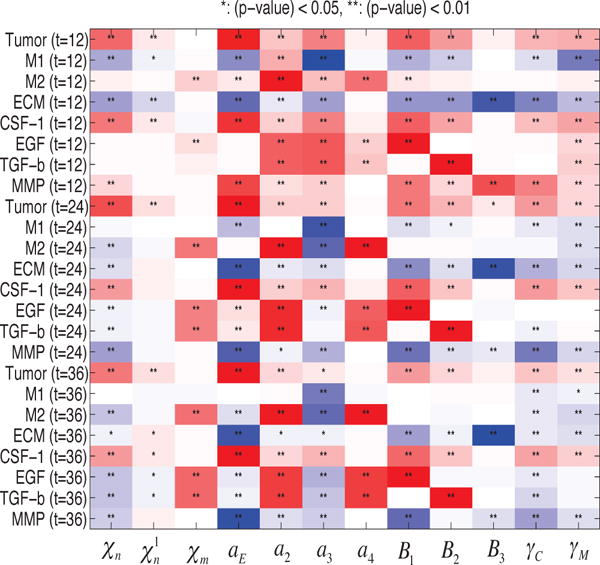
Sensitivity Analysis: General Latin Hypercube Sampling (LHS) scheme and Partial Rank Correlation Coefficient (PRCC) performed on the current model. The reference output in color is PRCC values (red for positive PRCC values; blue for negative PRCC values) for the populations of tumor, M1, and M2, and concentrations of ECM, CSF-1, ECM, TGF-β, and MMPs at time t = 12, 24, 36 h.
Figure 11 shows the PRCC values of the invasive tumor population in the lower chamber, which is defined as , at t =12 (blue), 24 (green), 36 (red) hours. The numbers of invasive cells are positively correlated with the parameters aE, B1, but not sensitive to χn, , χm, a2, a3, a4, B2, B3, γC, γM. Thus, in particular, the invasive glioma population will increase significantly if either the EGF-stimulated growth rate of tumor cells (aE) or the EGF production rate (B1) from M2 microglia is increased. Significantly, and again unsurprisingly, the dependence of the invasive cell population on the chemotactic sensitivity χn varies in time – it is initially strongly correlated, but at 36 hours the correlation is almost negligible.
Fig. 11.
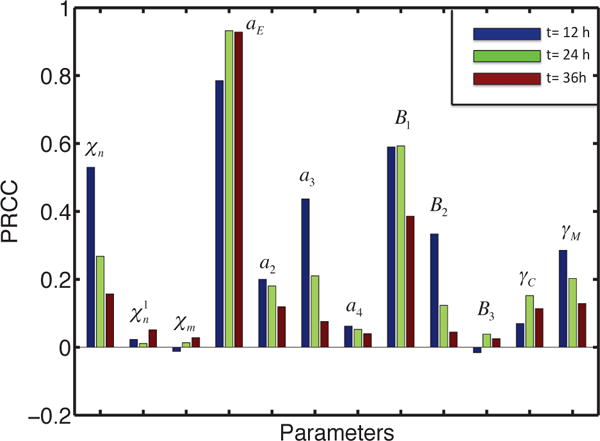
Sensitivity Analysis results for invasive tumor cells. The output is the PRCC values of invasive tumor cells in the lower chamber at time t =12 (blue), 24 (green), 36 (red) h.
C. Application of the model
Bemis and Schedin [24] conducted experiments on the invasive nature of breast cancer cells in a Boyden invasion assay with 8 micron pores in the filter, and showed that the number of cells invading is significantly decreased (more than 50%) when an MMP inhibitor called TIMP is applied to the system (cf. Figure 12A). In our model, blocking of MMP is implemented by setting a9, the MMP production rate coefficient in equation (13), to 0.05, which is 1% of the normal value. A simulation shows that after 36 h, the population of invading glioma cells in the lower chamber is reduced by approximately 70% (see Figure 12B), which is in good agreement with the experimental results shown in Figure 12B. As shown in experiments, TIMP cannot block the invasion of tumor cells completely, but they do suggest that blocking MMP activity in the brain will also slow down the invasion of glioma cells into the brain stroma. Another potentially-effective therapeutic approach to slowing invasion is to apply an antibody against TGF-β signaling [9] (also see Figure 5), given its pivotal roles in tumorigenesis [25]. When we apply combined therapeutic strategies by TIMP and antibody, this completely blocked the glioma invasion in the system (+MG+TIMP+Ab in Figure 12B). These in silico experiments suggest that glioma invasion may be significantly slowed down by the combined drug which blocks both MMP secretion and TβIIR (TGF-β receptors).
Fig. 12. The effect of MMP blocking (−MMP) and combined therapy (−MMP+Ab).
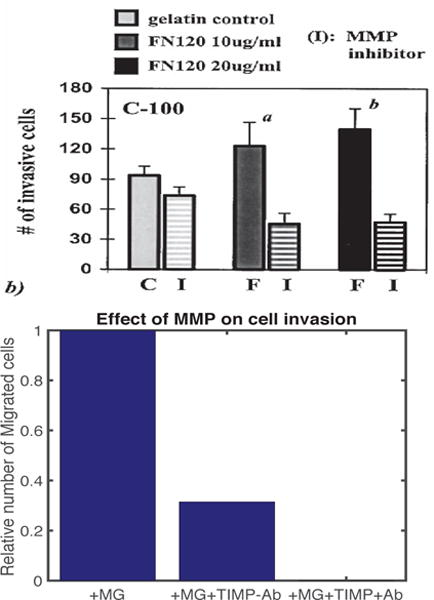
(A) Experimental results showing the number of migrating cells for a breast cancer cell line, C-100, in the absence and presence of MMP inhibitor on various ECM (fibronectin) concentrations (0, 10, 20 μg/ml) (Figure from Bemis et al. [24] with permission). (B) The population of invading tumor cells when MMP secretion was blocked in the absence (+MG−MMP−Ab) and presence (+MG−MMP+Ab) of TGF-β antibody relative to the control (+MG). When proteolytic activity of glioma cells near the membrane is blocked (a9 =0), fewer cells (69% reduction) invade the lower chamber.
IV. CONCLUSION
Cell-cell signaling is an integral process in tumor growth, since many mutations and chromosomal changes affect signaling pathways involving growth factors or cytokines. Signaling frequently involves indirect interactions between spatially-separated cell populations in the TME or between normoxic and hypoxic cells within a tumor. The ’go-or-grow’ behavior of glioma cells may depend on many microenvironmental factors, including glucose-induced up-regulation of miR-451 and mTOR [26]. Despite uncertainty concerning the details of the M1→M2 transition in gliomas, our model consistently predicts the role of GIMs in promoting glioma invasion in vitro. On the other hand, the presence of inhibitors of MMPs and of astrocytes was shown both experimentally and theoretically to block glioma invasion [27], [28], and we plan to investigate the role of the possibly continuous spectrum of the M1→M2 transition and the role of inhibitory molecules in the regulation of glioma infiltration in future work. Factors such as cell packing density and anisotropy of transport through the tissue affect the signaling process, but despite its importance, experimental data on signaling within tumors is sparse. Thus, computational studies on the effects of these interactions on tumor invasion, such as those done in [29], [30], and on the sensitivity of the predictions to kinetic parameters, may provide insights to guide experiments aimed at the development of new therapeutic approaches.
Acknowledgments
Y. Kim is supported by the Basic Science Research Program through the National Research Foundation of Korea funded by the Ministry of Education (NRF-2015R1D1A1A01058702).
Research supported by NSF Grant DMS #131974 and NIH Grant # GM 29123.
Biographies

Yangjin Kim received the M.S. and Ph.D. degrees in mathematics from the University of Minnesota, Minneapolis, in 2003 and 2006 respectively. He was a NSF research fellow at Mathematical Biosciences Institute (2006–2009) and an assistant professor at University of Michigan (2009–2012) before joining Konkuk University. His research interests include cancer signaling networks, anti-cancer strategies design, multi-scale analysis and simulation for cancer development.

Hyejin Jeon received the B.S. degree in the Radiology from Korea University, Seoul, Republic of Korea in 2016. She is an M.S. student at the Molecular and Translation Neuroimaging Lab, Department of Radiology, Seoul National University College of Medicine, Seoul, Republic of Korea. Her interests include multi-scale mathematical modeling of cancer development using Neuroimaging data.

Hans Othmer is a Professor of Mathematics at the University of Minnesota. He received his Ph. D. at the University of Minnesota and taught at Rutgers University and the University of Utah before returning to Minnesota. He is a Humboldt Fellow, a SIAM fellow and a fellow of the American Physical Society. His research interests involve cancer modeling, pattern formation, cell motility and stochastic processes.
Contributor Information
Yangjin Kim, Department of Mathematics, Konkuk University, Seoul, 143-701 Republic of Korea.
Hyejin Jeon, Molecular and Translational Neuroimaging Lab, Department of Radiology, Seoul National University College of Medicine, Seoul, Republic of Korea.
Hans Othmer, School of Mathematics, University of Minnesota, Minneapolis, MN 55455, USA.
References
- 1.Markovic D, et al. Gliomas induce and exploit microglial mt1-mmp expression for tumor expansion. Proc Natl Acad Sci USA. 2009;106:12530–12535. doi: 10.1073/pnas.0804273106. [DOI] [PMC free article] [PubMed] [Google Scholar]
- 2.Hambardzumyan D, et al. The role of microglia and macrophages in glioma maintenance and progression. Nature neuroscience. 2016;19(1):20–27. doi: 10.1038/nn.4185. [DOI] [PMC free article] [PubMed] [Google Scholar]
- 3.Mantovani A, et al. Macrophage plasticity and polarization in tissue repair and remodelling. The Journal of pathology. 2013;229(2):176–185. doi: 10.1002/path.4133. [DOI] [PubMed] [Google Scholar]
- 4.Pollard JW. Trophic macrophages in development and disease. Nature Reviews Immunology. 2009;9(4):259–270. doi: 10.1038/nri2528. [DOI] [PMC free article] [PubMed] [Google Scholar]
- 5.Coniglio SJ, et al. Microglial stimulation of glioblastoma invasion involves epidermal growth factor receptor (EGFR) and colony stimulating factor 1 receptor (CSF-1R) signaling. Molecular medicine. 2012;18(3):519. doi: 10.2119/molmed.2011.00217. [DOI] [PMC free article] [PubMed] [Google Scholar]
- 6.Wang Y, et al. Micrornas involved in the egfr/pten/akt pathway in gliomas. Journal of neuro-oncology. 2012;106(2):217–224. doi: 10.1007/s11060-011-0679-1. [DOI] [PubMed] [Google Scholar]
- 7.Massagué J. TGF [beta] in cancer. Cell. 2008;134(2):215–230. doi: 10.1016/j.cell.2008.07.001. [DOI] [PMC free article] [PubMed] [Google Scholar]
- 8.Anido J, et al. TGF-β receptor inhibitors target the CD44 high/id1 high glioma-initiating cell population in human glioblastoma. Cancer cell. 2010;18(6):655–668. doi: 10.1016/j.ccr.2010.10.023. [DOI] [PubMed] [Google Scholar]
- 9.Wesolowska A, et al. Microglia-derived TGF-beta as an important regulator of glioblastoma invasion–an inhibition of TGF-beta-dependent effects by shRNA against human TGF-beta type ii receptor. Oncogene. 2008;27(7):918–30. doi: 10.1038/sj.onc.1210683. [DOI] [PubMed] [Google Scholar]
- 10.zong Ye X, et al. Tumor-associated microglia/macrophages enhance the invasion of glioma stem-like cells via TGF-β1 signaling pathway. The Journal of Immunology. 2012;189(1):444–453. doi: 10.4049/jimmunol.1103248. [DOI] [PubMed] [Google Scholar]
- 11.Pyonteck SM, et al. CSF-1R inhibition alters macrophage polarization and blocks glioma progression. Nature medicine. 2013;19(10):1264–1272. doi: 10.1038/nm.3337. [DOI] [PMC free article] [PubMed] [Google Scholar]
- 12.Komohara Y, et al. Tumor-associated macrophages: Potential therapeutic targets for anti-cancer therapy. Advanced drug delivery reviews. 2015 doi: 10.1016/j.addr.2015.11.009. [DOI] [PubMed] [Google Scholar]
- 13.Markovic D, et al. Microglia stimulate the invasiveness of glioma cells by increasing the activity of metalloprotease-2. J Neuropathol Exp Neurol. 2005;64:754–762. doi: 10.1097/01.jnen.0000178445.33972.a9. [DOI] [PubMed] [Google Scholar]
- 14.Kim Y, et al. A mathematical model of brain tumor : pattern formation of glioma cells outside the tumor spheroid core. J Theo Biol. 2009;260:359–371. doi: 10.1016/j.jtbi.2009.06.025. [DOI] [PubMed] [Google Scholar]
- 15.Merzak A, et al. Control of human glioma cell growth, migration and invasion in vitro by transforming growth factor beta 1. British journal of cancer. 1994;70(2):199. doi: 10.1038/bjc.1994.280. [DOI] [PMC free article] [PubMed] [Google Scholar]
- 16.Han J, et al. TGF-beta signaling and its targeting for glioma treatment. Am J Cancer Res. 2015;5(3):945–55. [PMC free article] [PubMed] [Google Scholar]
- 17.Komohara Y, et al. Possible involvement of the m2 anti-inflammatory macrophage phenotype in growth of human gliomas. J Pathol. 2008;216:15–24. doi: 10.1002/path.2370. [DOI] [PubMed] [Google Scholar]
- 18.Coniglio SJ, Segall JE. Review: molecular mechanism of microglia stimulated glioblastoma invasion. Matrix Biology. 2013;32(7):372–380. doi: 10.1016/j.matbio.2013.07.008. [DOI] [PubMed] [Google Scholar]
- 19.Lindholm D, et al. Transforming growth factor-beta 1 in the rat brain: increase after injury and inhibition of astrocyte proliferation. J Cell Biol. 1992;117:395–400. doi: 10.1083/jcb.117.2.395. [DOI] [PMC free article] [PubMed] [Google Scholar]
- 20.Kiefer R, et al. In situ detection of transforming growth factor-beta mRNA in experimental rat glioma and reactive glial cells. Neurosci Lett. 1994;166:161–164. doi: 10.1016/0304-3940(94)90475-8. [DOI] [PubMed] [Google Scholar]
- 21.Eisenberg M, et al. Modeling the effects of myoferlin on tumor cell invasion. Proc Natl Acad Sci USA. 2011;108(50):20078–83. doi: 10.1073/pnas.1116327108. [DOI] [PMC free article] [PubMed] [Google Scholar]
- 22.Friedman A, et al. Effective permeability of the boundary of a domain. Commun In Partial differential equations. 1995;20(1–2):59–102. [Google Scholar]
- 23.Marino S, et al. A methodology for performing global uncertainty and sensitivity analysis in systems biology. J Theor Biol. 2008;254(1):178–96. doi: 10.1016/j.jtbi.2008.04.011. [DOI] [PMC free article] [PubMed] [Google Scholar]
- 24.Bemis L, Schedin P. Reproductive state of rat mammary gland stroma modulates human breast cancer cell migration and invasion. Cancer Res. 2000;60(13):3414–8. [PubMed] [Google Scholar]
- 25.Pinkas J, Teicher B. Tgf-beta in cancer and as a therapeutic target. Biochem Pharmacol. 2006;72(5):523–9. doi: 10.1016/j.bcp.2006.03.004. [DOI] [PubMed] [Google Scholar]
- 26.Kim Y, et al. Strategies of eradicating glioma cells: A multi-scale mathematical model with miR-451-AMPK-mTOR control. PLoS One. 2015;10(1):e0114370. doi: 10.1371/journal.pone.0114370. [DOI] [PMC free article] [PubMed] [Google Scholar]
- 27.Silver DJ, et al. Chondroitin sulfate proteoglycans potently inhibit invasion and serve as a central organizer of the brain tumor microenvironment. The Journal of Neuroscience. 2013;33(39):15603–15617. doi: 10.1523/JNEUROSCI.3004-12.2013. [DOI] [PMC free article] [PubMed] [Google Scholar]
- 28.Lee H, Kim Y. The role of the microenvironment in regulation of cspg-driven invasive and non-invasive tumor growth in glioblastoma. Japan J Indust Appl Math. 2016;32(3):771–805. [Google Scholar]
- 29.Kim Y, et al. A hybrid model for tumor spheroid growth in vitro I: Theoretical development and early results. Math Models Methods in Appl Scis. 2007;17:1773–1798. [Google Scholar]
- 30.Kim Y, Othmer H. A hybrid model of tumor-stromal interactions in breast cancer. Bull Math Biol. 2013;75:1304–1350. doi: 10.1007/s11538-012-9787-0. [DOI] [PMC free article] [PubMed] [Google Scholar]


