Abstract
Purpose
To develop and demonstrate an automated calculation method to provide organ dose assessment for a large cohort of pediatric and adult patients undergoing CT examinations.
Methods
We adopted two dose libraries that were previously published: the CTDIvol-normalized organ dose library and the mAs-normalized CTDIw library. We developed an algorithm to calculate organ doses using the two dose libraries and CT scan parameters available from DICOM data. To demonstrate the established method, we calculated organ doses for pediatric (n=2499) and adult (n=2043) CT scans randomly selected from four health care systems in the United States, and compared the adult organ doses with the values calculated from the ImPACT calculator.
Results
Median brain dose was 20 mGy (pediatric) and 24 mGy (adult), and brain dose was greater than 40 mGy for 11% (pediatric) and 18% (adult) of head scans. Both the NCI and the ImPACT methods provided similar organ doses (median discrepancy < 20%) for all organs except for the organs located close to scan boundaries. The visual comparisons of scan coverage and phantom anatomies revealed that the NCI method based realistic computational phantoms provides more realistic organ doses compared to the ImPACT method.
Conclusion
The automated organ dose calculation method developed in this study reduces the time needed to calculate doses on a large number of patients. We have successfully utilized this method for a variety of CT-related studies including retrospective epidemiological study and CT dose trend analysis studies.
1 INTRODUCTION
There is growing interest in being able to quantify the risk of cancers in pediatric and adult populations associated with Computed Tomography (CT) examinations, as well as interest in patient dose tracking of the exposures (1–5). In order to efficiently perform those studies and to accurately analyze the associated effects, it is crucial to have a dosimetry tool that offers accurate evaluation of patient-specific organ doses in an automatic manner. Existing commercial dosimetry tools for CT examinations1 (6,7) are not appropriate to meet the needs: First, some of them are based on outdated stylized computational human phantoms where the anatomy and body contour are not realistically modeled (8,9). This drawback makes it difficult to properly position the scan start and end points on the stylized phantoms using a given scanning protocol. The simplified anatomy and body contour of the phantoms may introduce errors in CT dosimetry. CT-Expo (6), which is one of the commercial dosimetry programs for evaluating exposure to pediatric patients and is widely used for research purposes, is limited to two patient-specific voxel phantoms corresponding to an 8-week-old and 7-year-old child. Second, not all the existing tools are automated or designed to perform dosimetry for a large number of patients. CT dose parameters must be manually entered into these programs one at a time to generate the organ doses, and this is not feasible for epidemiological studies or dose tracking. Third, some commercial tools are designed for patient dose tracking at large-scale healthcare systems not for personal research purposes.
There have been recent developments in phantom research, which can help fill the gaps outlined above. The research groups at University of Florida and National Cancer Institute (NCI) developed a series of hybrid computational phantoms representing individuals with reference organ mass and body dimensions ranging from newborn to adult, including six age groups in children and two genders (10). A library of organ dose conversion coefficients, organ dose normalized by volumetric Computed Tomography Dose Index (CTDIvol), calculated from the hybrid phantom series coupled with the simulation of X-rays in a reference CT scanner were reported (11,12). Lee et al. (13) recently reported a library of CTDI, which is the compilation of weighted CTDIw values normalized to 100 mAs collected from multiple data sources. If patient-specific CTDIvol is not available, the value can be reconstructed from CT scan parameters using the library. Using the two pre-calculated dose libraries, it is feasible to perform the automatic calculation of patient-specific radiation doses for a large-scale patient cohort.
The current study was intended to develop a dosimetry method to calculate organ doses for a large cohort of pediatric and adult patients undergoing CT examinations using the two dose libraries. The performance of the established method was demonstrated by calculating organ doses for 4542 CT examinations of which technical parameters were abstracted from multiple health care facilities in the United States.
2 MATERIALS AND METHODS
2.1 Algorithm for organ dose calculation
We adopted an algorithm that we previously published to calculate patient- and CT scanner-specific organ doses, which is described by the following equations.
| (1) |
where
DCC(organ, age, sex, spectrum, z) is the pre-calculated organ dose conversion coefficient per 1 cm axial slice (mGy/mGy) at longitudinal position z on the phantom, which is organ dose (mGy) normalized to the CTDIvol of the reference CT scanner (11,12);
organ is the organ of interest, age and sex are from a given patient, spectrum is one of the six combinations of three tube potentials (80, 100, and 120 kVp) and two filtrations (head and body) of the particular CT scan, and z is the slice number ranging from the top of the head to the bottom of the patient’s feet;
SS designates the slice number where scan starts and SE designates the slice number where scan ends;
CTDIvol is for the particular scanner for which organ doses are sought;
CTDIvol in Eq. (1) could be extracted from Digital Imaging and Communications in Medicine (DICOM) dataset in most of modern CT scanners. However, if not available, CTDIvol can be reconstructed by the following equation.
| (2) |
where
nCTDlw (make, model, spectrum) is the CTDIw normalized to 100 mAs for a given scanner make and model, and x-ray spectrum;
I×t is the product of the tube current (I) and the single rotation time (t).
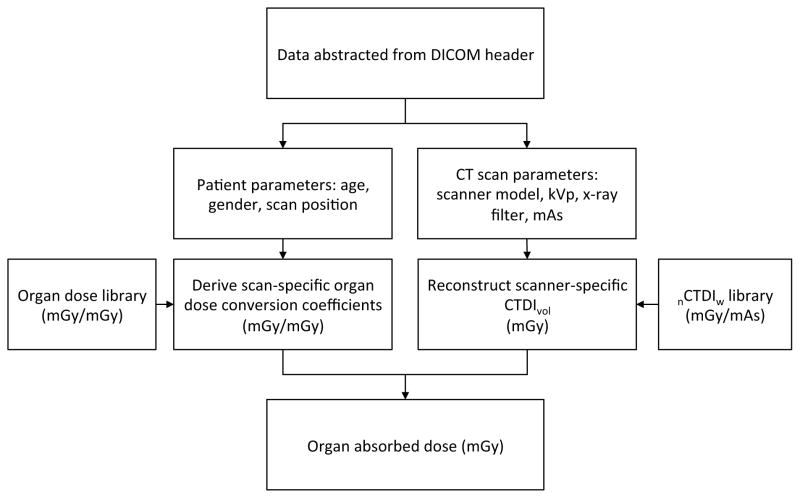
In order to calculate patient-specific organ dose, patient-specific dose conversion coefficients need to be derived from the dose conversion coefficient library based on organ-of-interest, patient age and gender, X-ray spectrum, and the start and end of scan, abstracted from DICOM data and patient records. If CTDIvol is available for each CT examination, organ doses can be calculated by using Eq. (1) where the CTDIvol is multiplied to the dose conversion coefficients derived in the previous step. However, if CTDIvol is not available, the value must be reconstructed using Eq. (2) where the nCTDIw selected from the CTDI library based on the manufacturer and model of CT scanners and X-ray spectrum, current-time product (mAs), and pitch are incorporated. The dosimetry method will be called the “National Cancer Institute (NCI) method” hereafter in the current paper. More details about the two dose libraries will be explained in the following two sections.
2.2 Organ dose library
The organ dose library (11,12) is consisting of a five dimensional matrix of organ dose conversion coefficients: DCC (33 organs, 6 age groups, 2 genders, 6 x-ray spectra2, 176 (adult male) positions with 1 cm slice thickness). In the current study, organ doses from axial and helical scans with a given scan range were approximated as the sum of doses from multiple axial slices included in the scan range of interest. This is the same approach adopted within the existing CT organ dose estimation programs such as CT-Expo (6) and ImPACT spreadsheet3. The method enables health and medical physicists to readily estimate organ doses for any particular CT scan coverage by using the pre-calculated organ dose conversion coefficients without the need to run Monte Carlo calculations for each CT examination.
The organ dose library was calculated by using a series of hybrid computational human phantoms coupled with Monte Carlo simulation of x-rays from a reference CT scanner (11). The hybrid phantom series covers newborn, 1-, 5-, 10-, 15-year-old, and adult male and female reference individuals whose organ mass matches the values of International Commission on Radiological Protection (ICRP) Publication 89 (14). The organs available in the organ dose library includes the following organs: brain, pituitary gland, lens, eyeballs, salivary glands, oral cavity, spinal cord, thyroid, esophagus, trachea, thymus, lungs, breast, heart wall, stomach wall, liver, gall bladder, adrenals, spleen, pancreas, kidney, small intestine wall, colon wall, recto-sigmoid wall, urinary bladder wall, prostate, uterus, testes, ovaries, skin, muscle, active marrow, and shallow marrow.
2.3 CTDI library
The CTDI library was recently published by the researchers at the National Cancer Institute (13). The library tabulates the measurements of the nCTDIw values (mGy/100mAs) for a total of 162 scanner groups from eight manufacturers including General Electric (GE), Siemens, Philips, Toshiba, Elscint, Picker, Shimadzu, and Hitachi. The dataset was created by summarizing four independent data sources: the ImPACT Dose Survey from the United Kingdom, the CT-Expo dose calculation program, and surveys performed by the US Food and Drug Administration (FDA) and the National Lung Screening Trial (NLST). From the sources, the CTDIw values for a total of 68, 138, 30, and 13 scanner model groups were collected, respectively.
2.4 Patient data abstraction
To demonstrate the patient specific dosimetry algorithm explained in the previous sections, we collected the extracted CT scan parameters from 4542 CT scans randomly selected from four health care systems participating in the Cancer Research Network (CRN) in the United States including Group Health Cooperative in Washington State; Kaiser Permanente Northwest in Northwest Oregon/Southwest Washington; and Marshfield Clinic in Wisconsin. We randomly selected patients based on age and gender in each year (from 1994 to 2011) and abstracted the primary determinants of dose from each examination: scan region, scan length, tube potential (kVp), tube current-time product (mAs), pitch, and the manufacturer and model of CT scanners. The abstraction was performed using an automated computer program, which extracted the parameters from DICOM dataset stored in the Picture Archiving and Communication System (PACS) or were manually extracted. The final patient cohort consisted of 46% males and 54% females. The patient age ranged from 0 to 84 years and included 53% pediatric (<20 years) and 47% adult patients.
2.5 Patient-specific organ dose calculation
The calculation of patient-specific organ dose was conducted in two steps: (1) the calculation of patient-specific organ dose conversion coefficients and (2) the reconstruction of CT scanner-specific CTDIvol.
First, according to Eq. (1), organ dose conversion coefficients were derived based on patient age and gender, tube potential (kVp), x-ray bowtie filter, and scan positions, which were abstracted for each exam. We assumed that the anatomy and body dimensions of a given patient are close to those of the reference hybrid phantoms. The organ dose library was created for the discrete age groups: newborn, 1-, 5-, 10-, 15-year-old, and adult male and female phantoms. If the age of patient did not match those of phantoms, the dose conversion coefficients were calculated by interpolating the two sets of organ doses of the two upper and lower age phantoms. For example, organ dose conversion coefficients for 7-year-old patient were linearly interpolated from those for 5-year-old and 10-year-old phantoms. Dose conversion coefficients calculated from adult hybrid phantoms were used for patients who are older than 20 years. Since the type of filter was not directly available, we selected a head filter for all pediatric and adult scans except for adult body scan. Scan start position was derived based on the scan type (e.g., head, chest, and etc.). In our dataset, we had a total of 14 types of CT exams including brain, brain orbit, brain spine, brain spine chest abdomen pelvis, face, orbit, spine, spine chest, spine chest abdomen pelvis, chest, chest abdomen pelvis, abdomen, abdomen pelvis, and pelvis. Once the scan start position was decided, we added the scan length (cm) to the scan start to locate the scan end position. Once the five parameters in Eq. (1) were decided, patient-specific organ dose conversion coefficients were obtained.
Second, according to Eq. (1), CTDIvol is multiplied by the dose conversion coefficients to obtain absolute organ doses. Because CTDIvol values were not directly available from DICOM data in the current study, we reconstructed the values using Eq. (2) coupled with the manufacturer and model of CT scanner, type of x-ray spectrum which is one of the six combinations of three tube potentials (80, 100, and 120 kVp) and two filtrations (head and body), and current-time product (mAs). CT scanner models abstracted from DICOM dataset were not exactly matched to the list of CT scanner models in the CTDI library (13). Table 1 shows the list of scanner models abstracted and mapped to the list in the CTDI library for four different scanner manufacturers. Normalized CTDIw for head and body phantoms and four tube potentials (80, 100, 120, and 140 kVp) are also included.
Table 1.
The scanners abstracted from the patient data (2nd column) and those mapped from the CTDI library (3rd column). Normalized CTDIw values are listed for CTDI head and body phantoms for different tube potentials (80, 100, 120, and 140 kVp).
| Manufacturer | Scanner model (abstracted) | Scanner model (mapped) | Normalized CTDIw (mGy/100mAs) | |||||||
|---|---|---|---|---|---|---|---|---|---|---|
|
| ||||||||||
| CTDI Head Phantom
|
CTDI Body Phantom
|
|||||||||
| 80 | 100 | 120 | 140 | 80 | 100 | 120 | 140 | |||
| GE | 9800 Series | 9800 Series | 6.5 | 10.1 | 13.6 | 19.0 | 2.8 | 4.3 | 6.2 | 8.5 |
| HiLight HiSpeed CT/i (No SmB) | HiLight, HiSpeed CT/i (no SmartBeam) | 4.3 | 7.8 | 11.9 | 17.1 | 1.7 | 3.4 | 5.1 | 7.5 | |
| HiSpeed CT/i with SmartBeam | HiSpeed CT/i (SmartBeam) | 4.3 | 7.8 | 12.2 | 18.0 | 2.2 | 4.2 | 6.1 | 9.0 | |
| LightSpeed 16 | LightSpeed 16 | 7.6 | 13.6 | 20.7 | 28.8 | 3.3 | 6.7 | 10.4 | 15.5 | |
| LightSpeed VCT | LightSpeed VCT | 9.8 | 17.3 | 26.3 | 36.1 | 4.1 | 7.4 | 10.7 | 16.2 | |
| LightSpeed | LightSpeed (AVERAGE) | 8.2 | 14.6 | 21.1 | 27.4 | 3.6 | 6.8 | 10.9 | 15.4 | |
| LightSpeed Plus | LightSpeed, QX/I, Plus | 7.6 | 13.6 | 20.1 | 26.0 | 3.4 | 6.5 | 10.2 | 14.8 | |
| Hi Speed CTI | HiSpeed CT/i (SmartBeam) | 4.3 | 7.8 | 12.2 | 18.0 | 2.2 | 4.2 | 6.1 | 9.0 | |
| HiSpeed Advanced | HiSpeed Advantage | 4.2 | 7.4 | 12.0 | 17.0 | 1.9 | 3.2 | 5.1 | 7.5 | |
| HiSpeed Advance with Smart | HiSpeed Advantage | 4.2 | 7.4 | 12.0 | 17.0 | 1.9 | 3.2 | 5.1 | 7.5 | |
| HiSpeed | HiSpeed (AVERAGE) | 5.0 | 8.5 | 14.1 | 19.4 | 2.2 | 4.0 | 6.5 | 9.4 | |
|
| ||||||||||
| Siemens | Sensation 64 | Somatom Sensation 64 | 3.9 | 8.3 | 14.0 | 23.7 | 1.8 | 3.9 | 7.2 | 10.6 |
| Sensation Open | Somatom Sensation Open | 6.3 | 12.1 | 19.5 | 33.4 | 2.9 | 5.7 | 9.4 | 14.0 | |
| SOMATOM PLUS 4 | Somatom Plus 4 | 4.1 | 8.7 | 14.3 | 20.7 | 2.4 | 5.0 | 8.1 | 11.7 | |
| Volume Zoom | Somatom Volume Zoom | 8.0 | 14.3 | 20.7 | 28.6 | 2.8 | 5.5 | 8.5 | 12.3 | |
| Definition | Somatom Definition (AVERAGE) | 4.3 | 8.6 | 14.5 | 21.1 | 1.9 | 3.9 | 6.7 | 9.9 | |
| Sensation 40 | Somatom Sensation 40 | 4.8 | 9.9 | 17.0 | 25.0 | 2.2 | 4.7 | 8.2 | 12.4 | |
|
| ||||||||||
| Toshiba | Aquilion 16 | Aquilion 16 | 9.2 | 16.0 | 24.7 | 34.1 | 5.2 | 9.2 | 13.7 | 20.1 |
| Aquilion | Aquilion (AVERAGE) | 9.5 | 17.0 | 26.4 | 41.0 | 4.9 | 8.9 | 14.0 | 21.8 | |
| Asteion | Asteion | 6.5 | 9.9 | 13.5 | 22.5 | 3.3 | 5.0 | 6.0 | 12.1 | |
| Asteion 4 slice | Asteion 4 (after 2002) | 11.4 | 18.6 | 27.8 | 39.0 | 5.0 | 8.5 | 13.1 | 19.0 | |
|
| ||||||||||
| Elscint | MX Twin | Mx Twin | 4.3 | 7.2 | 10.9 | 15.5 | 1.6 | 2.8 | 4.5 | 6.6 |
The CTDIvol values obtained in the second step were multiplied by the organ conversion coefficients calculated in the first step to finally calculate organ doses for each CT exam. All calculations were automatically performed by using an in-house batch script written in Visual Basic 6.0. Figure 1 summarizes the steps used to calculate organ doses from the data abstracted from DICOM dataset.
Fig. 1.
Diagram of the workflow from data abstraction from DICOM dataset to organ dose calculations
2.6 Comparison of organ doses with ImPACT batch version
We independently performed another organ dose calculations by using a method developed at the National Aeronautics and Space Administration (NASA) to compare with the dose calculated using the NCI algorithm and dose library described in the previous sections. In order to monitor organ doses and the associated cancer risks for many CT exams conducted for astronauts (as patients), the ImPACT spreadsheet4 was adopted for organ dose calculations, which is based on the adult male and female stylized phantoms developed in 1980s (8). The anatomy of the phantoms is described using mathematical equations, which may not be realistic compared to the patient CT image-based hybrid phantoms adopted in the NCI dose calculation.
The ImPACT spreadsheet was translated into a MATLAB (The MathWorks, Natick, MA) function that could be automated. The MATLAB function used the CT exam parameters to perform the same calculations as the ImPACT spreadsheet. The same CT scan parameters used for the NCI calculation were also used for the ImPACT calculation. The manufacturer and model, voltage, and filter were used to find the correct normalized CTDIw value to use in the simulation based upon a library of values provided by the NCI. These quantities were also used to determine the appropriate NRPB Monte Carlo data set (15) to use in the calculation. The scan type and scan length were used to determine the scan start and scan stop positions, which was the same approach in the NCI calculation.
Once the correct reference data were determined based on the exam parameters, the organ doses were calculated. First, the NCI nCTDIw was used to calculate the nCTDIair using the ImPACT library of nCTDIw and nCTDIair values. The CTDIair was calculated using the current-time product. Soft tissue CTDI was calculated as the product of CTDIair and 1.07, the ImPACT conversion factor. Next, the appropriate slice indices for the NCRP Monte Carlo data were found and used to calculate organ dose per unit soft tissue CTDI. The absolute organ doses were found by multiplying by the soft tissue CTDI divided by the pitch. Finally, a MATLAB script was written to execute the MATLAB function for each exam and output the results in a matrix. Since ImPACT is only capable of representing adult patients, the comparison with results from the NCI was restricted to patients with age greater than 20 years. In the comparison, we used identical CTDIvol values described in Eq. (2) in both methods. We also used the same anatomical landmark to set the scan start based on the scan type (e.g., head, chest, abdomen, and etc.) and applied the same scan lengths. A notable difference remaining in the two methods is the anatomical structures in the stylized and hybrid phantoms adopted to the ImPACT and NCI methods, respectively.
3 RESULTS AND DISCUSSIONS
3.1 Descriptive analysis of the NCI organ dose
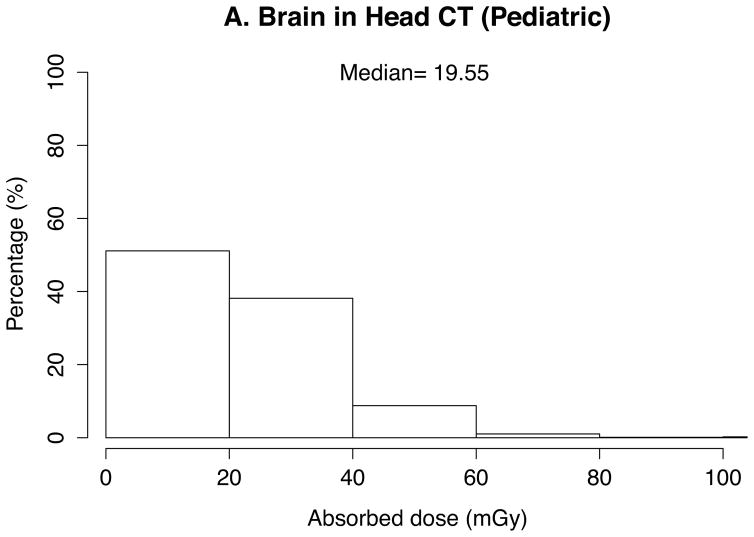
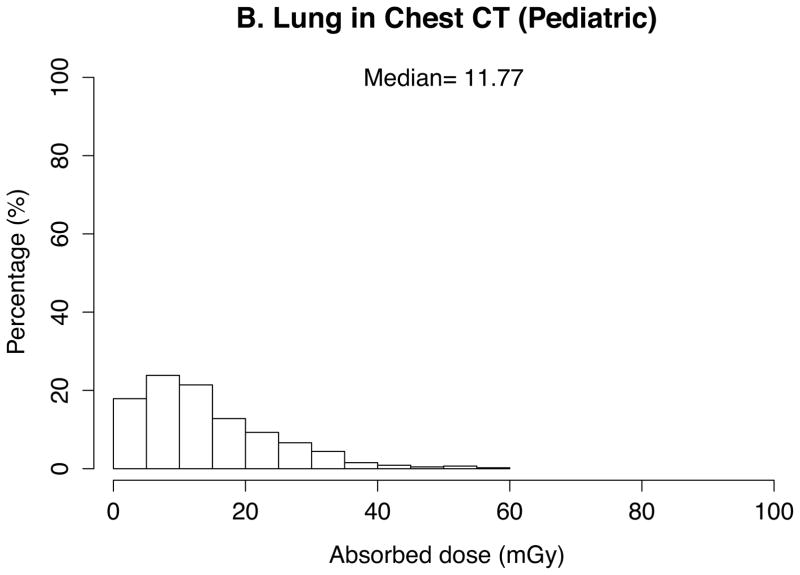
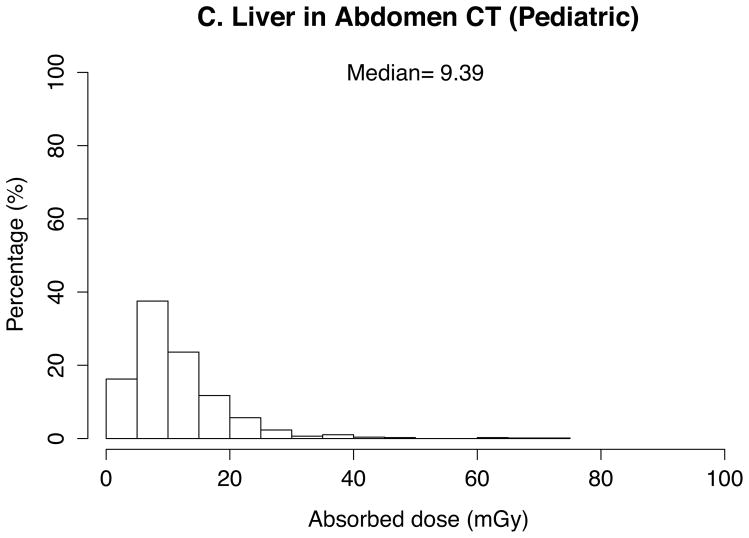
The absorbed doses to 33 organs were calculated by the in-house batch script into which 10 patient- and CT scanner-related parameters abstracted from the 4542 CT scans were imported. Thanks to the look-up-table feature based on the pre-calculated dose conversion coefficients, total calculation took a couple of seconds. The absorbed doses to the brain in head exams, the lung in chest exams, and the kidney and liver in abdominal exams were graphed in histograms. Median was calculated and added to the graphs for these organ doses as the dose distribution was skewed.
In pediatric scans (Figure 2), medians of organ doses are 20 mGy for the brain, 12 mGy for the lung, and 10 mGy for the liver in head scans (n=878), chest scans (n=453), and abdominal scans (n=775), respectively. Dose is greater than 40 mGy (to the brain) for 11% of the pediatric head scans, 7% (to the lungs) of pediatric chest scans, and 2% (to the liver) of abdominal scans.
Fig. 2.
Distribution and median of organ doses in pediatric scans for (a) brain in head scans (n=878), (b) lung in chest scans (n=453), (c) liver in abdominal scans (n=775)
In adult examinations, medians of organ doses are 24 mGy for the brain, 18 mGy for the lung, and 11 mGy for the liver in head scans (n=1123), chest scans (n=404), and abdominal scans (n=516), respectively. The organ doses are overall greater than those of pediatric scans. Median lung dose in the adult chest scans are up to 1.5-fold greater than that of the pediatric scans. Dose is greater than 40 mGy for 18% (to the brain) of adult head scans, 1% (to the lungs) of adult chest scans, and 7% (to the liver) of abdominal scans.
3.2 Organ dose comparison with ImPACT
We compared adult organ doses calculated by the NCI method with the values from the ImPACT method. A total of 2043 scans out of 4542 scans were included in the comparison: head (n=1123), chest (n=404), and abdominal (n=516) scans. Table 2 shows the ratio of the NCI dose to the ImPACT dose for major organs in head, chest, and abdomen scans. Median, minimum, and maximum ratios were listed for each comparison. Both methods provided similar doses (less than 20% discrepancy) for all selected organs except for thyroid and liver. The differences for the two organs were greater, and the median ratios between the two methods of estimating dose (NCI/ImPACT) were 0.47 and 0.61, respectively. The number of exams showing the difference ratios greater than 2-fold and 5-fold was included in the last two columns in Table 2. Few head scans (< 1%) show the dose ratio greater than 2-fold. More chest scans showed significant discrepancies: the NCI method provided more than 5-fold greater heart doses than the ImPACT method for 14% of the total chest scans. In the abdomen scans, the organ doses from the NCI method are more than 2-fold greater than those from the ImPACT method for less than 6% of the total abdomen scans.
Table 2.
Mean, min, and max of the ratio of adult organ doses calculated from the NCI and ImPACT methods for major organs in three examinations.
| Exam type | Total cases (n) | Organs | Organ dose ratio (NCI/ImPACT)
|
Extreme cases
|
|||||
|---|---|---|---|---|---|---|---|---|---|
| Median | Min | Max | > 2-fold | % | > 5-fold | % | |||
|
|
|
|
|||||||
| Head | 1123 | Brain | 0.84 | 0.52 | 2.31 | 5 | 0.4 | 0 | 0.0 |
| Thyroid | 0.47 | 0.18 | 13.84 | 7 | 0.6 | 3 | 0.3 | ||
|
|
|
|
|||||||
| Chest | 404 | Lung | 0.94 | 0.73 | 7.27 | 56 | 13.9 | 4 | 1.0 |
| Heart | 1.06 | 0.78 | 13.14 | 113 | 28.0 | 57 | 14.1 | ||
| Breast | 0.86 | 0.69 | 4.01 | 21 | 5.2 | 1 | 0.2 | ||
|
|
|
|
|||||||
| Abdomen | 516 | Kidney | 1.03 | 0.68 | 7.95 | 31 | 6.0 | 9 | 1.7 |
| Liver | 0.61 | 0.44 | 9.55 | 5 | 1.0 | 3 | 0.6 | ||
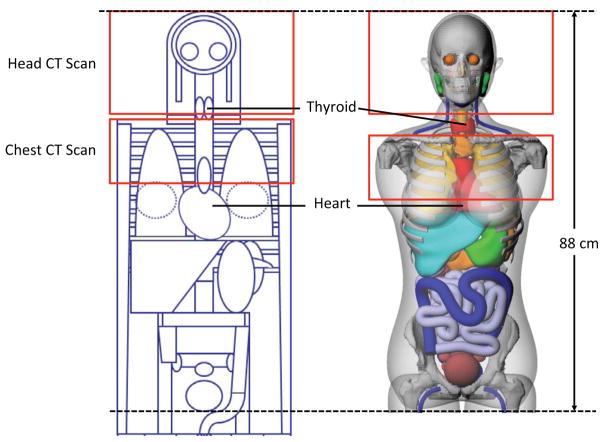
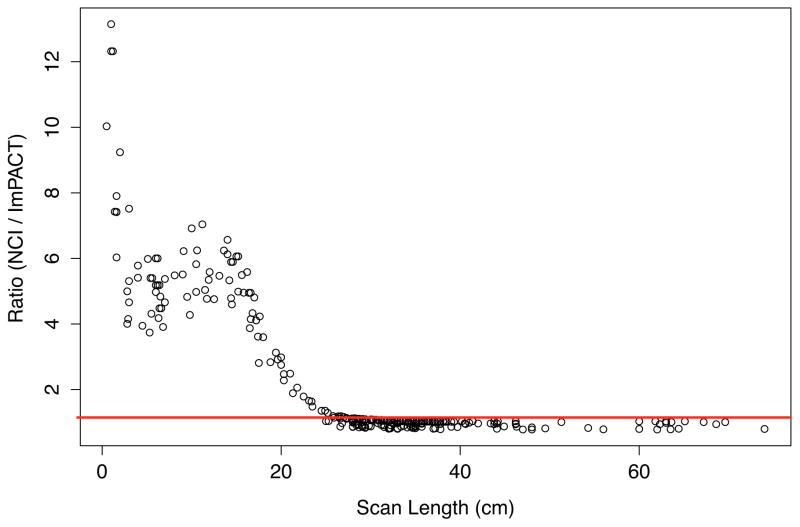
In order to investigate the main cause of the large dose difference in the heart, we identified a chest scan where the heart doses were 4.1 and 20.5 mGy calculated from the ImPACT and NCI methods, respectively. The patient was 31-year-old female and was scanned using 120 kVp, 225 mAs, and the pitch of 1.125. The scan coverage started from the top of the clavicle and the scan length was 17 cm. Figure 3 shows the head and torso of the stylized (left) and hybrid (right) phantoms, which are the basis of the ImPACT and NCI methods, respectively. The scan coverage is depicted on both phantoms with the same scan length and the location and contour of the heart is indicated. The heart model in the stylized phantom is clearly located outside the scan coverage, whereas the significant portion of the heart is included in the scan coverage in the hybrid phantom. The relationship between the scan length and the dose difference ratio is graphed in Figure 4. The difference ratio becomes smaller as the scan length increases, which means more portion of the heart volume is covered by the scan coverage. Once both heart models in the two phantoms are within the scan coverage, the difference ratio is close to unity.
Fig. 3.
Comparison of the scan coverage of head and chest scans on the hermaphrodite stylized phantom embedded in ImPACT (left) and the adult female hybrid phantom (right) used in the NCI dose calculation. The thyroids and hearts are indicated in each phantom. The sternum and coastal cartilages are removed to better visualize the contour of the heart.
Fig. 4.
Relationship between the scan length and the dose difference ratio between NCI and ImPACT. The line representing the ratio of 1 is indicated.
3.3 Limitations of the current study
The dosimetry methods developed in this study enabled us to efficiently calculate the doses to multiple organs for more than 4000 CT scans. However, it must be noted that the approach has a couple of limitations. The organ dose reconstruction method may not be complete because of two types of parameter, which were not available from DICOM data. First, total collimation widths were not available. We assumed the collimation width of 10 mm for all calculations. However, we acknowledge that multidetector scanners show significant dependence on the collimation (16). Second, the body dimension of the patients was missing in DICOM dataset. We adopted the hybrid phantom series representing the reference body size of the USA. However, if the height and weight of patients are available, we will be able to calculate more accurate organ dose by using the body size-dependent computational phantoms (17), which was recently published. Finally, compared to the look-up-table approach taken in this study, Monte Carlo transport calculations using patient-specific anatomies from CT images may provide more accurate individualized organ doses. However, the methods we developed in this study were intended for organ dose reconstructions for a large number of patients with a reasonable level of uncertainties.
4 CONCLUSION
We developed an automated organ dose calculation method to fill the gaps in the existing CT dosimetry tools, which are limited to old computational phantoms or not designed to perform dosimetry for a large number of patients. The new method combines two pre-calculated dose libraries with the patient- and CT scan-related parameters abstracted from DICOM data to calculate scan-specific organ doses. We demonstrated organ dose calculations for 4542 scans and compared the results with other existing method based on ImPACT dose calculator. We found our method is highly efficient in large-scale dose calculations for CT patients and is more accurate than the ImPACT dosimetry tool although Monte Carlo transport calculations based on real patient CT images may provide more accurate individualized organ doses. We have successfully applied this method to a variety of CT-related studies including retrospective epidemiological study (1,5,18,19) and CT dose trend analysis studies (3,20).
Acknowledgments
Funding:
This work was supported by the intramural research program of the National Institutes of Health, National Cancer Institute, Division of Cancer Epidemiology and Genetics.
Footnotes
CT Dosimetry (http://www.impactscan.org/ctdosimetry.htm), Radimetrics™ (Bayer Health Care, Leverkusen, Germany), Virtual Dose™ (Virtual Phantoms, Inc., Albany, NY)
Six x-ray energy spectra are the combination of 80, 100, and 120 kVp and the two bowtie filters for head and body scans, which were available for the reference CT scanner simulated in the Monte Carlo calculations.
References
- 1.Pearce MS, Salotti JA, Little MP, McHugh K, Lee C, Kim KP, et al. CT scans in childhood and risk of leukaemia and brain tumours: Authors’ reply. The Lancet [Internet] 2012;380(9840):1736–7. doi: 10.1016/S0140-6736(12)60815-0. Available from: http://www.thelancet.com/pdfs/journals/lancet/PIIS0140-6736(12)61984-9.pdf. [DOI] [PMC free article] [PubMed] [Google Scholar]
- 2.Mathews JD, Forsythe AV, Brady Z, Butler MW, Goergen SK, Byrnes GB, et al. Cancer risk in 680,000 people exposed to computed tomography scans in childhood or adolescence: data linkage study of 11 million Australians. Brirish Medical Journal. 2013;346:f2360. doi: 10.1136/bmj.f2360. [DOI] [PMC free article] [PubMed] [Google Scholar]
- 3.Smith-Bindman R, Miglioretti DL, Johnson E, Lee C, Feigelson HS, Flynn M, et al. Use of Diagnostic Imaging Studies and Associated Radiation Exposure for Patients Enrolled in Large Integrated Health Care Systems, 1996–2010. Journal of the American Medical Association American Medical Association. 2012;307(22):2400–9. doi: 10.1001/jama.2012.5960. [DOI] [PMC free article] [PubMed] [Google Scholar]
- 4.Huang W-Y, Muo C-H, Lin C-Y, Jen Y-M, Yang M-H, Lin J-C, et al. Paediatric head CT scan and subsequent risk of malignancy and benign brain tumour: a nation-wide population-based cohort study. British journal of cancer Nature Publishing Group. 2014;110(9):1–7. doi: 10.1038/bjc.2014.103. [DOI] [PMC free article] [PubMed] [Google Scholar]
- 5.Journy N, Rehel J-L, Ducou Le Pointe H, Lee C, Brisse H, Chateil J-F, et al. Are the studies on cancer risk from CT scans biased by indication? Elements of answer from a large-scale cohort study in France. British journal of cancer Nature Publishing Group. 2015;112(1):185–93. doi: 10.1038/bjc.2014.526. [DOI] [PMC free article] [PubMed] [Google Scholar]
- 6.Stamm G, Nagel HD. CT-expo--a novel program for dose evaluation in CT. R\“oFo: Fortschritte auf dem Gebiete der R\”ontgenstrahlen und der Nuklearmedizin. 2002;174(12):1570. doi: 10.1055/s-2002-35937. [DOI] [PubMed] [Google Scholar]
- 7.Kalender WA, Schmidt B, Zankl M, Schmidt M. A PC program for estimating organ dose and effective dose values in computed tomography. Eur Radiol Springer-Verlag. 1999;9(3):555–62. doi: 10.1007/s003300050709. [DOI] [PubMed] [Google Scholar]
- 8.Cristy M, Eckerman KF. Specific absorbed fractions of energy at various ages from internal photon sources. Oak Ridge, TN: Oak Ridge National Laboratory; 1987. [Google Scholar]
- 9.Kramer R, Zankl M, Williams G, Drexler G. The calculation of dose from external photon exposures using reference human phantoms and Monte-Carlo methods, Part 1: The male (ADAM) and female (EVA) adult mathematical phantoms. Neuherberg, Germany: GSF-National Research Center for Health and Environment; 1982. [Google Scholar]
- 10.Lee C, Lodwick D, Hurtado J, Pafundi D, Williams JL, Bolch WE. The UF family of reference hybrid phantoms for computational radiation dosimetry. Physics in Medicine and Biology. (2009) 2010;55(2):339–63. doi: 10.1088/0031-9155/55/2/002. [DOI] [PMC free article] [PubMed] [Google Scholar]
- 11.Lee C, Kim KP, Long D, Fisher R, Tien C, Simon SL, et al. Organ doses for reference adult male and female undergoing computed tomography estimated by Monte Carlo simulations. Medical physics. 2011;38(3):1196–206. doi: 10.1118/1.3544658. [DOI] [PMC free article] [PubMed] [Google Scholar]
- 12.Lee C, Kim KP, Long D, Bolch WE. Organ doses for reference pediatric and adolescent patients undergoing computed tomography estimated by Monte Carlo simulation. Medical Physics. 2012;39(4):2129–46. doi: 10.1118/1.3693052. [DOI] [PMC free article] [PubMed] [Google Scholar]
- 13.Lee E, Lamart S, Little MP, Lee C. Database of normalised computed tomography dose index for retrospective CT dosimetry. Journal of Radiological Protection. 2014 Apr;34(2):363–88. doi: 10.1088/0952-4746/34/2/363. [DOI] [PMC free article] [PubMed] [Google Scholar]
- 14.ICRP. Ann ICRP. 3–4. Vol. 32. Oxford: International Commission on Radiological Protection; 2002. Basic anatomical and physiological data for use in radiological protection: reference values. ICRP publication 89; pp. 1–277. [PubMed] [Google Scholar]
- 15.Jones DG, Shrimpton PC. Part 3: Normalised organ doses calculated using Monte Carlo techniques. National Radiologic Protection Board; 1991. Survey of CT Practice in the UK. [Google Scholar]
- 16.McNitt-Gray MF. AAPM/RSNA physics tutorial for residents: topics in CT. Radiographics Radiological Society of North America. 2002;22(6):1541. doi: 10.1148/rg.226025128. [DOI] [PubMed] [Google Scholar]
- 17.Geyer AM, O’Reilly S, Lee C, Long DJ, Bolch WE, OReilly S, et al. The UF/NCI family of hybrid computational phantoms representing the current U.S. population of male and female children, adolescents, and adults - application to CT dosimetry. Physics in medicine and biology. 2014 Aug;(18):5225–42. doi: 10.1088/0031-9155/59/18/5225. in press. [DOI] [PMC free article] [PubMed] [Google Scholar]
- 18.Meulepas JM, Ronckers CECM, Smets AMJB, Nievelstein RAJ, Jahnen A, Lee C, et al. Leukemia and brain tumors among children after radiation exposure from CT scans: design and methodological opportunities of the Dutch Pediatric CT Study. European journal of epidemiology. 2014 doi: 10.1007/s10654-014-9900-9. in press. [DOI] [PubMed] [Google Scholar]
- 19.Thierry-Chef I, Dabin JEREM, Friberg E, Hermen J, Istad T, Jahnen A, et al. International Journal of Environmental Research and Public Health [Internet] 2. Vol. 10. Multidisciplinary Digital Publishing Institute; 2013. Assessing Organ Doses from Paediatric CT Scans: A Novel Approach for an Epidemiology Study (the EPI-CT Study) pp. 717–28. Available from: http://www.mdpi.com/1660-4601/10/2/717. [DOI] [PMC free article] [PubMed] [Google Scholar]
- 20.Miglioretti DL, Johnson E, Williams A, Greenlee RT, Weinmann S, Solberg LI, et al. The Use of Computed Tomography in Pediatrics and the Associated Radiation Exposure and Estimated Cancer Risk. Jama Pediatrics. 2013 Aug;167(8):700–7. doi: 10.1001/jamapediatrics.2013.311. [DOI] [PMC free article] [PubMed] [Google Scholar]


