Abstract
A realistic mock circulatory system (MCS) could be a valuable in vitro testbed to study human circulatory hemodynamics. The objective of this study was to design a MCS replicating the pulmonary arterial circulation, incorporating an anatomically representative arterial model suitable for testing clinically relevant scenarios. A second objective of the study was to ensure the system's compatibility with magnetic resonance imaging (MRI) for additional measurements. A latex pulmonary arterial model with two generations of bifurcations was manufactured starting from a 3D-printed mold reconstructed from patient data. The model was incorporated into a MCS for in vitro hydrodynamic measurements. The setup was tested under physiological pulsatile flow conditions and results were evaluated using wave intensity analysis (WIA) to investigate waves traveling in the arterial system. Increased pulmonary vascular resistance (IPVR) was simulated as an example of one pathological scenario. Flow split between right and left pulmonary artery was found to be realistic (54 and 46%, respectively). No substantial difference in pressure waveform was observed throughout the various generations of bifurcations. Based on WIA, three main waves were identified in the main pulmonary artery (MPA), that is, forward compression wave, backward compression wave, and forward expansion wave. For IPVR, a rise in mean pressure was recorded in the MPA, within the clinical range of pulmonary arterial hypertension. The feasibility of using the MCS in the MRI scanner was demonstrated with the MCS running 2 h consecutively while acquiring preliminary MRI data. This study shows the development and verification of a pulmonary MCS, including an anatomically correct, compliant latex phantom. The setup can be useful to explore a wide range of hemodynamic questions, including the development of patient- and pathology-specific models, considering the ease and low cost of producing rapid prototyping molds, and the versatility of the setup for invasive and noninvasive (i.e., MRI) measurements.
Mock circulatory systems (MCS) are widely used to gather hydrodynamic data in vitro. They allow investigation of the cardiovascular system in both healthy and pathological scenarios, with the possibility of testing devices, for example, the intra-aortic balloon pump [1], centrifugal and axial pumps [2], stents [3], and heart valves [4, 5]. The pulmonary circulation in these MCS is often lumped and modeled with capillary tubes for resistance and air chambers for compliance, acting as a 2- or 3-element Windkessel [2, 6, 7].
Rigid or flexible anatomical phantoms can be incorporated in MCS for more realistic simulations. Different materials are available for manufacturing rigid models [4, 8], typically for the purpose of carrying out visualization studies, for example, particle image velocimetry [9]. However, rigid models do not replicate the compliant properties of the vasculature. Flexible elastomer arterial models with varying wall thickness have been used for investigating hemodynamics of the aortic circulation [10, 11], but a realistic compliant model of the pulmonary arteries has not been presented. In this study, we describe the manufacturing of a compliant pulmonary arterial model based on patient anatomy created with rapid prototyping. This can be used within a MCS for in vitro testing of the hemodynamics associated with various (patho)physiologies and cardiovascular devices. Examples of pathologies of interest in this context are pulmonary arterial hypertension (PAH) [12], unilateral stenosis in the pulmonary artery [13], unusual flow split following repair of transposition of the great arteries (TGA) [14], and Eisenmenger's syndrome [15]. To demonstrate the feasibility and realistic nature of the model, time-dependent flow velocity and pressure were measured under pulsatile conditions and verified, as the main objective of the study. Data were processed using wave intensity analysis (WIA), to gather additional insight into system hemodynamics and demonstrate the suitability of the in vitro data for this analytical approach. WIA indeed provides a convenient, time domain wave-to-wave alternative to Fourier or impedance analysis [16], and it has been widely utilised to study wave propagation in animals and humans [17–21]. As a secondary aim of the study, the system was tested for compatibility within the magnetic resonance imaging (MRI) setting, to demonstrate the versatility of the MCS and its suitability for imaging studies.
Materials and Methods
Pulmonary arterial model
An anatomically correct latex pulmonary arterial model was fabricated for in vitro studies of the adult pulmonary circulation. The model comprises one inlet and seven outlets. The inlet is defined as the cross-section just above the pulmonary valve on the main pulmonary artery (MPA). The outlets are defined on the downstream branches, of which five are on the right pulmonary artery (RPA) side and two are on the left pulmonary artery (LPA) side.
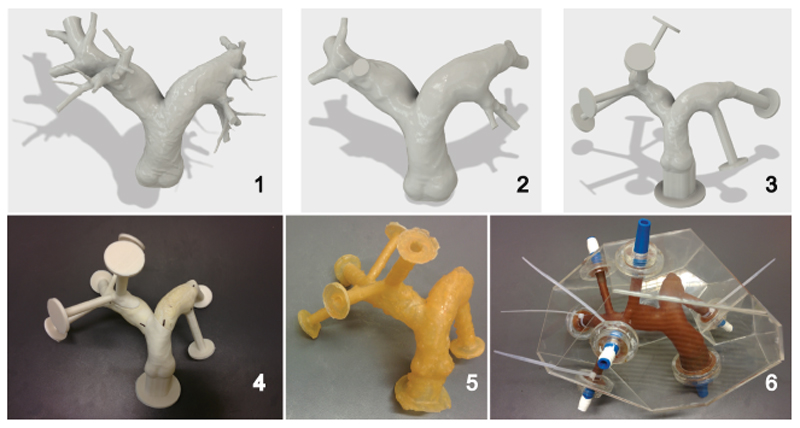
Figure 1 depicts the six steps to obtain the latex pulmonary arterial model representing the patient anatomy; these steps are:
CT images of a 72-year-old male with no known pulmonary disease were segmented for the pulmonary vessel tree and the lumen surface model was reconstructed using commercial image-processing software (Mimics, Materialise NV, Leuven, Belgium). The model was exported in IGES format and imported in computer aided design software Autodesk Fusion 360 (Autodesk, San Rafael, CA) for further elaboration as in the following 2 steps.
Arteries smaller than 5 mm were removed and surface irregularities were patched and smoothed.
The inlet and the seven outlets were extruded (30 mm length) and flanges (20 mm diameter, 3 mm thickness) were built to facilitate connections to the MCS. Outlets 1 and 2 are on the RPA side and 3–7 on the LPA side. This modified 3D model was sectioned to obtain a modular structure of 11 parts such that they can be disassembled and removed from the compliant model without damaging it.
The parts were 3D-printed in polylactic acid (PLA) using an Ultimaker 2 (Ultimaker, Geldermalsen, The Netherlands) and were used as a mold for latex brushing.
Ten layers of liquid latex (Trylon, Higham Ferrers, UK) produced a waterproof and durable latex model. After curing the latex overnight, the mold parts were removed and thus a hollow latex pulmonary arterial model was obtained. The Young's modulus was verified with a uniaxial tensile test (Zwick Roell, Ulm, Germany) and the wall thickness with a calliper.
An acrylic box was designed to contain the model, which was anchored to the box using the flanges. The placement of the model in the acrylic box was completed with custom-made 3D-printed PLA connectors to provide leak-free snug connections between the latex model and external tubing.
Figure 1.
Six steps representing the manufacturing model of a hollow pulmonary latex arterial model based on patient data: [1] CAD model from a CT scan of a 72-year-old male patient with no known pulmonary disease, [2] intermediate CAD model with simplified geometry, [3] finalised CAD model including extrudes and flanges for easy connections, [4] 3D-printed model consisting of 11 parts to act as a mold for latex brushing, [5] hollow latex model obtained after latex brushing, curing, and removal of the mold, and [6] finalized pulmonary model in an acrylic box with blue custom 3D-printed connectors for an external circulatory system. [Color figure can be viewed in the online issue, which is available at wileyonlinelibrary.com.]
Pump
A Harvard Apparatus Pulsatile Blood Pump Series 1400 (Harvard Apparatus UK, Cambridge, UK) was connected to the inlet of the model, and provided pulsatile flow with adjustable stroke volume (SV), heart rate (HR), and diastolic time fraction (DTF). For all experiments, the following settings were used SV = 50 mL, HR = 60 bpm, DTF = 50%. The “trigger signal” extracted from the pump, that is, square wave of input voltage indicating the pump action, was recorded and monitored and it helped vizualize the 50/50 systole/diastole ratio.
Downstream flow circuit
Resistance was implemented using needle-pinch valves (Sigma-Aldrich Company, Gillingham, Dorset, UK) at common outlets 1-2, 3-4, and 5-7. The valves are metered such that the parameters are easily reproducible.
Compliance was implemented by the distensible latex model and additional proximal compliance was implemented using a custom-made acrylic air chamber. The diameter and height of the chamber were 8.5 and 30 cm, and the level of water was set at 7 cm. Compliance (C) was calculated by dividing the air volume (Vair) by the atmospheric (Patm) and mean pulmonary pressure (mPAP; [21, 22]). Given a mPAP of 15 mmHg, this resulted in Eq. (1):
| (1) |
Assembly of the MCS
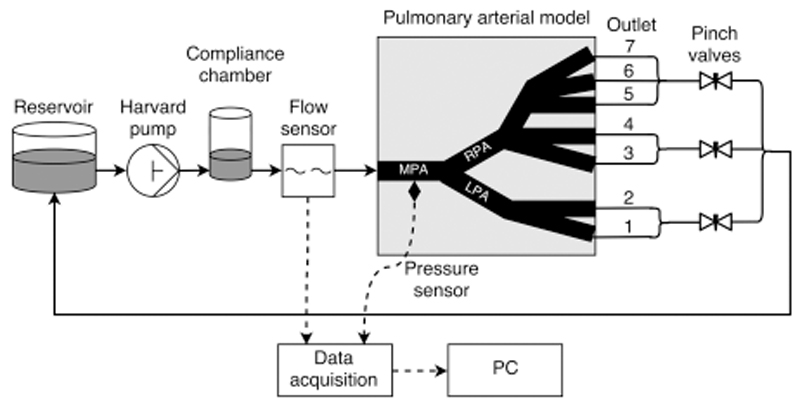
All the above components were connected as shown schematically in Fig. 2. Flexible but relatively noncompliant Tygon tubing with an inner diameter of 9.5 mm and outer diameter of 13 mm was used for connections. The outlets of the pulmonary arterial model were connected to an “atrial” reservoir providing head pressure of about 15 mm Hg. The reservoir was connected back to the Harvard pump. Water at room temperature (22°C) was used as the flowing medium.
Figure 2.
Schematic of the experimental setup including the reservoir, Harvard pump, compliance chamber, pulmonary arterial model including seven outlets, flow meter, catheter, data acquisition devices, and computer.
Data acquisition
A Transonic 9PXL perivascular ultrasound probe (Transonic Systems, Ithaca, NY) was used for flow measurements. The flow probe was calibrated (“timed collection” method) over a range of flows (0–6 L/min). The flow probe was connected to a Transonic TS410 tubing flow meter (Transonic Systems, Ithaca, NY). A high-fidelity fiber optic pressure wire (Opsens, Quebec, Quebec, Canada) was used for pressure measurements. The pressure transducer was calibrated (“column of water” method) over a range of static pressures (0–120 mm Hg). The pressure wire was inserted through a 9F catheter sheath into the pulmonary model via one of the outlets. Its position in the pulmonary model was adjusted by the “pull back” method. The pressure wire was connected to a fiber optic sensor module (Opsens). Pressure and flow tracings and the trigger signal from the pump were recorded at 250 Hz with a data acquisition device (Biopac MP150, Biopac Systems, Goleta, CA). A laptop was used for data acquisition and real-time display during the measurements (AcqKnowledge Software, Biopac Systems, Goleta, CA).
Pressure and flow were measured for two scenarios: healthy and pathological. The former investigated flows in the MCS set up as described above—“healthy scenario”—and the latter investigated flows with the same MCS setting but increased pulmonary vascular resistance—“increased pulmonary vascular resistance (IPVR) scenario.” Pulmonary vascular resistance (PVR) was calculated as follows (Eq. (2)):
| (2) |
where mean pulmonary wedge pressure (mPWP) equaled the reservoir pressure head, and cardiac output (CO) equalled SV multiplied by HR.
For the IPVR scenario, the needle-pinch valves at the outlet tubing were tightened to increase downstream resistance. All other settings were identical to the healthy scenario. For comparison purposes, measurements were performed on the same day and under the same conditions for both scenarios.
Flow was measured at the inlet, each outlet, and the common outlets, to investigate flow distribution in the model. Pressure was measured in each generation of vessels to observe pressure at different locations in the pulmonary model, inserting the catheter through the RPA and LPA. Pressure and flow were measured simultaneously to perform WIA.
Data analysis
Pressure and flow (i.e., CO) signals during systole and diastole were verified to be in a stable periodic state and within the physiological range. Data were analysed using Matlab R2015a (MathWorks, Natick, MA). Pressure and flow peak and mean values were recorded and averaged over 20 cycles. Flow splits are reported as % of the CO.
WIA [18] representing an important tool for the investigation of traveling waves, was conducted based on the method described by Parker [23], using pressure measured in the MPA and flow measured in the tubing between compliance chamber and the inlet of the pulmonary arterial model. Velocity in the MPA was calculated as input flow divided by cross-sectional area of the tube where flow was measured, see Fig. 2. Pressure (P) and velocity (U) data were shifted with respect to each other until a linear slope was observed during early systole in the P-U loop [24]. The signals were smoothed using a Savitzky-Golay filter [25] with a second order polynomial and window width of 51 data points. Ensemble averages of pressure and flow from 20 waves using the timing signal from the Harvard pump were then calculated. The P-U loop method was used for quantification of wave speed (c), as knowledge of c is required to separate net wave intensity into forward and backward components. It is important to note that the magnitude of wave intensity depends on the sampling rate [23, 26].
Calculation of net wave intensity from simultaneously acquired invasive P and U signals provides a measure of energy flux per unit area, as defined (Eq. (3)):
| (3) |
where dI is the net wave intensity difference in one sampling time, dP is the pressure difference in one sampling time, dU is the velocity difference in one sampling time. Considering the relationship between P and U based on the water hammer equation (23), forward and backward components of pressure, velocity, and wave intensity changes are defined (Eqs. (4) and (5)):
| (4) |
| (5) |
where ρ is the density of the flowing medium (i.e., water). The energy of a wave of interest was calculated as the integral of dI, that is, the area under the wave (A).
Feasibility of MRI measurements
A 1.5T clinical MR scanner (Avanto, Siemens Healthcare, Erlangen, Germany) was used to assess the feasibility of using the MCS in the MRI setting for noninvasive measurements. The experimental setup was not modified, simultaneously measuring flow and pressure as described above, but all ferromagnetic equipment (i.e., the pump and all data acquisition devices) was placed in the MRI control room, while the compliance chamber, pulmonary arterial model, and reservoir were located on the bed of the MRI scanner. The pressure wire and flow probe are both MR compatible.
The pulmonary artery model with the surrounding acrylic case was submerged in a larger water tank to provide sufficient MR signal. Furthermore, contrast was improved by the addition of 10 ml Dotarem gadoteric acid intravenous contrast agent (Guerbet, Lanester, France) at a concentration of 279.32 mg/mL, which improves contrast by reducing spin lattice relaxation (T1). A conventional multislice scout sequence was employed to test the use of the MCS for noninvasive measurements with the following settings: echo time (TE) = 1.3 ms, repetition time (TR) = 283.3 ms, flip angle = 77°, field of view = 256*256 pixels, and pixel spacing = 2.1*2.1 mm.
Results
Pulmonary arterial model
A Young's modulus of 1.18 MPa was found for 10 layers of latex. The wall thickness resulting from 10 layers, needed for durability, was 1.7 ± 0.3 mm.
Invasive measurements
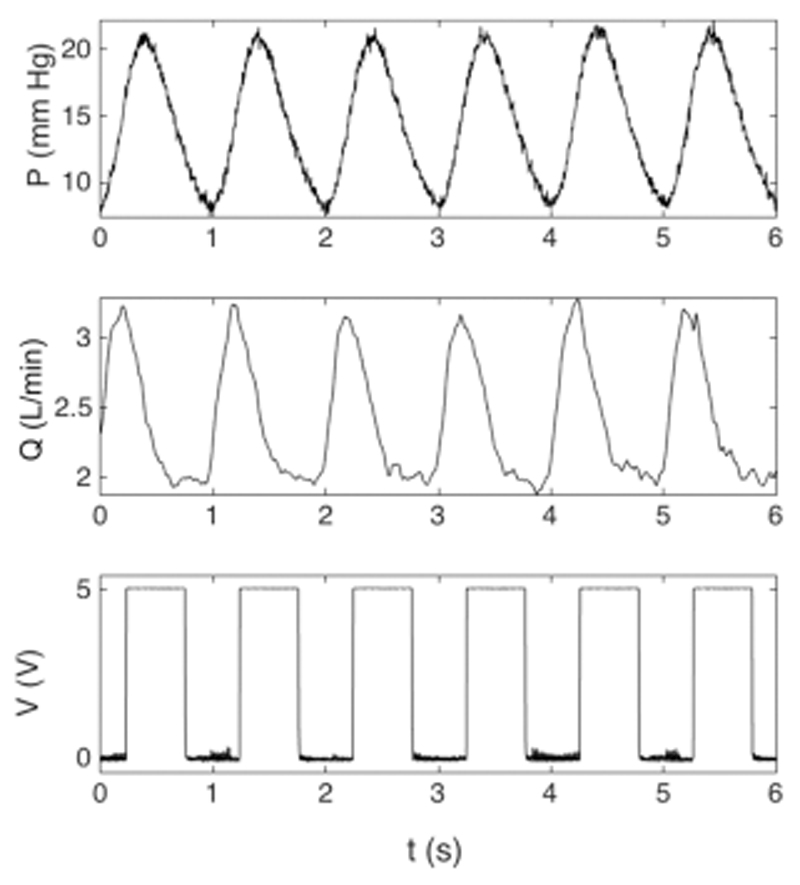
Table 1 shows the flow distribution in the pulmonary arterial model. Flow distribution between RPA and LPA in the model was 54 and 46%, respectively. Figure 3 displays typical pressure, flow waveforms in the MPA, together with the trigger signal (ECG equivalent) of the Harvard pump.
Table 1.
Flow values and percentage of total flow for the inlet and outlets. The inlet is defined as the cross-section just above the pulmonary valve on the MPA and the outlets are defined on the second or third generation of vessels on the RPA and LPA side Data are mean ± SD
| Location | Flow (L/min) | Percentage |
|---|---|---|
| Inlet | 2.56 ± 0.01 | 100 |
| LPA | (45.8) | |
| Outlet 1 | 0.55 ± 0.01 | 22.6 |
| Outlet 2 | 0.57 ± 0.002 | 23.2 |
| RPA | (54.2) | |
| Outlet 3 | 0.24 ± 0.004 | 9.7 |
| Outlet 4 | 0.17 ± 0.001 | 7.1 |
| Outlet 5 | 0.34 ± 0.003 | 13.9 |
| Outlet 6 | 0.30 ± 0.002 | 12.2 |
| Outlet 7 | 0.27 ± 0.01 | 11.2 |
Figure 3.
Example of typical pressure, flow, and trigger signals, as part of a longer acquisition. Pressure was measured in the MPA, flow at the inlet, and the trigger signal, that is, square wave, that originated from the pump. For 10 consecutive beats, mean pressure was 15.2 ± 0.1 mm Hg with peak systolic pressure of 22.4 ± 0.2 mm Hg and minimum diastolic pressure of 8.2 ± 0.2 mm Hg, mean flow rate was 2.6 ± 0.02 L/min with peak systolic flow rate of 3.3 ± 0.04 L/min and diastolic flow rate of 1.9 ± 0.03 L/min, and DTF is 50%.
Healthy scenario
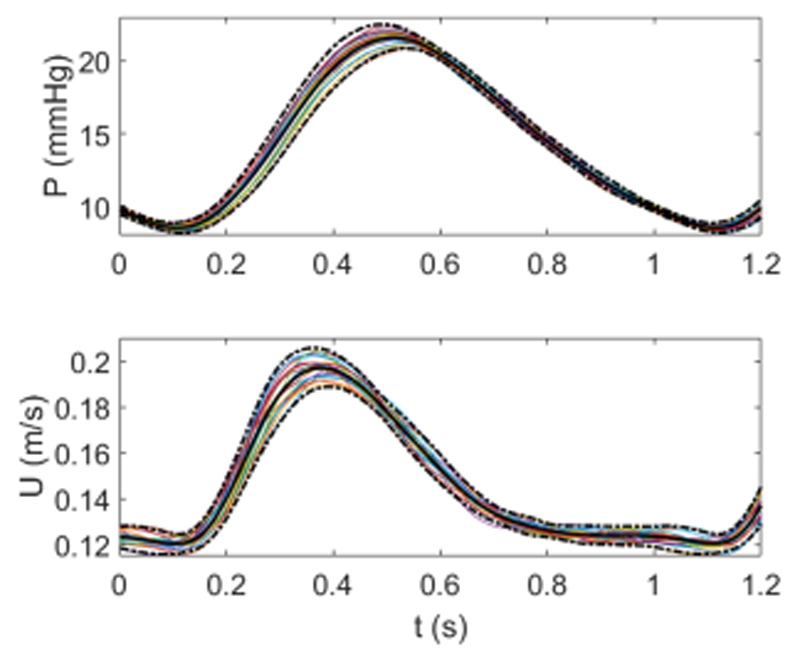
Signals in Fig. 3 are measured in the “healthy scenario.” The following values represent mean and standard deviation of 10 beats, an example of the individual traces is shown in Fig. 3. Mean pressure was 15.2 ± 0.1 mm Hg, with peak systolic pressure of 22.4 ± 0.2 mm Hg and minimum diastolic pressure of 8.2 ± 0.2 mm Hg. Mean flow rate was 2.6 ± 0.02 L/min with peak systolic flow rate of 3.3 ± 0.04 L/min and diastolic flow rate of 1.9 ± 0.03 L/min. The repeatability of the signals was investigated by computing average pressure and flow and the resulting ensemble averages of 20 beats are shown in Fig. 4. There was no substantial difference with ensemble averages of 10 beats, hence 10 beats were considered sufficient for further data analysis. WIA was carried out using the mean values and thus represents time-averaged wave intensity, as opposed to beat-to-beat wave intensity.
Figure 4.
Ensemble averages for the aligned pressure (measured in the MPA) and velocity (measured at the inlet) for 20 beats. Each beat is shown by a colored line and the solid black line and dotted black lines represent the ensemble average and 95% confidence intervals, respectively. [Color figure can be viewed in the online issue, which is available at wileyonlinelibrary.com.]
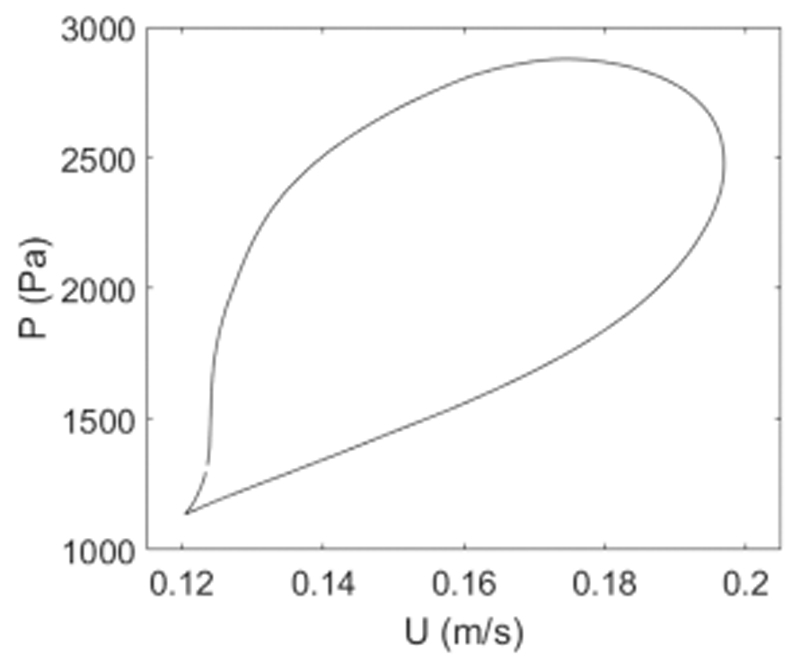
Figure 5 shows a typical P-U loop, which was used to determine wave speed. Wave speed in the MPA was c = 10.7 ± 0.1 m/s. Velocity data was generally shifted forward about 10 data points, which corresponds to 40 ms for a sampling rate of 250 Hz.
Figure 5.
Pressure-velocity (P-U) loop of ensemble averaged flow velocity and pressure data. For WIA, flow velocity data was shifted until a linear slope is observed in early systole as displayed here. Wave speed was calculated from the slope of the linear segment this graph on the basis of the water hammer equation and was 10.7 ± 0.1 m/s, based on 10 measurements for this case.
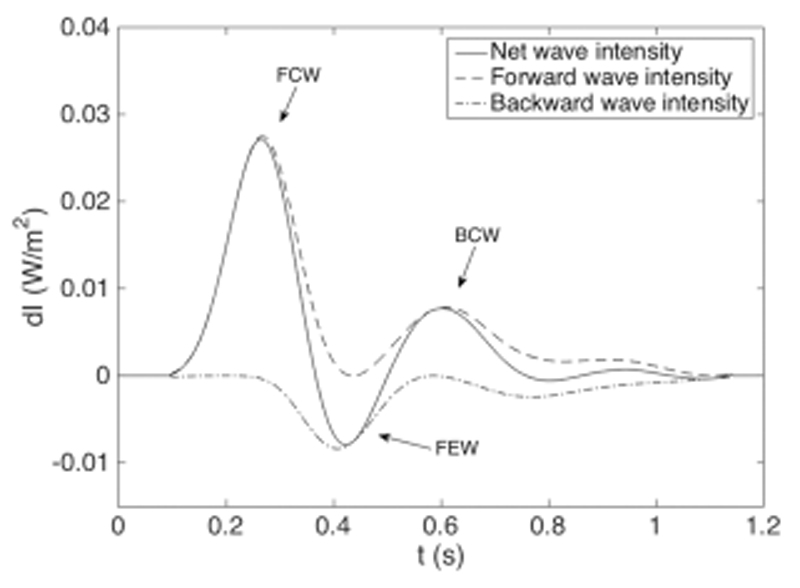
Figure 6 shows time-averaged net wave intensity with forward and backward components. Net wave intensity shows three distinct waves: a forward compression wave (FCW), a backward compression wave (BCW), and a forward ejection wave (FEW). Table 2 lists peak time tpeak, peak wave intensity dIpeak, and wave area A of the three identified waves, along with values for time-average net wave intensity for the IPVR scenario.
Figure 6.
Example of wave intensity pattern obtained in the MCS, showing net (dI), forward (dI+), and backward (dI−) wave intensity based on the ensemble averages for the healthy scenario. The wave intensity pattern contains three distinct waves: a FCW, BCW, and FEW.
Table 2.
Time of peak intensity (tpeak), magnitude of peak intensity (dIpeak), and area (a) of the FCW, BCW, and FEW. The values for the healthy scenario correspond to Fig. 6. Health and IPVR are time-averaged net wave intensities in the MPA
| tpeak (s) | dIpeak (10 W/m2) | A (10−3 J/m2) | ||||
|---|---|---|---|---|---|---|
| Healthy | IPVR | Healthy | IPVR | Healthy | IPVR | |
| FCW | 0.27 | 0.25 | 0.027 | 0.036 | 3.6 | 4.4 |
| BCW | 0.43 | 0.41 | −0.008 | −0.010 | 0.7 | 1.0 |
| FEW | 0.60 | 0.60 | 0.008 | 0.007 | 1.2 | 1.2 |
IPVR scenario
Table 3 shows the mean and peak pressure with standard deviation based on 10 beats for the healthy and IPVR scenarios. Under these conditions, with a reservoir pressure head of 11.8 mm Hg (16 cm H2O), PVR was 1.13 mm Hg·min/L for the healthy scenario and 9.11 mm Hg·min/L for the IPVR scenario. The pressure was significantly higher for IPVR than the healthy scenario (mPAP: 33.8 ± 0.2 mm Hg vs. 14.7 ± 0.1 mm Hg, P < 0.001). The MCS was successfully tested with a mean pulmonary artery pressure up to 90 mm Hg and with various flow rates and SV, indicating its suitability for exploring clinically relevant questions related to PAH.
Table 3.
Mean and peak pulmonary arterial pressure obtained in the MPA for the healthy scenario, the increased PVR scenario, and the difference between the two. Mean values ± SD are based on the average of 10 beats
| P (mm Hg) | ||
|---|---|---|
| Mean | Peak | |
| Healthy scenario | 14.65 ± 0.14 | 20.88 ± 0.21 |
| IPVR scenario | 33.82 ± 0.15 | 39.45 ± 0.16 |
| Difference | 19.17 ± 0.16 | 18.57 ± 0.29 |
Feasibility of MRI measurements
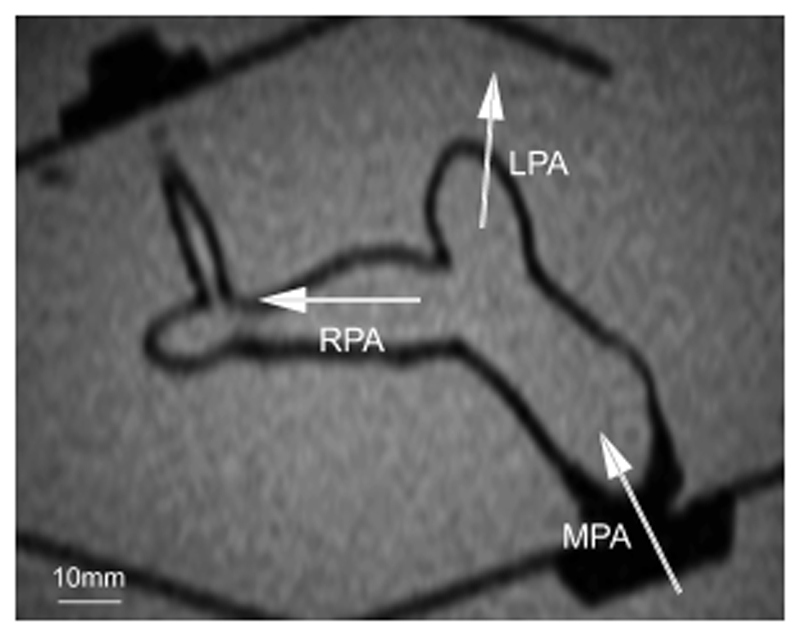
Figure 7 shows a single slice from an MR image of the pulmonary model and acrylic box submerged in a water tank. The MPA, RPA, and LPA are clearly visible, demonstrating the feasibility of acquiring MRI data with this model.
Figure 7.
A single slice from an MR image of the pulmonary arterial model submerged in an acrylic tank of water. The image is obtained with a multislice scout sequence. The MPA, RPA, LPA, and surrounding acrylic box are clearly visible. Scale is indicated.
Discussion
This study aimed to replicate the pulmonary artery circulation to test clinically relevant scenarios and to study its compatibility with MRI. An elastic, anatomically representative pulmonary arterial model based on a patient image dataset was tested in a pulmonary MCS. The advantages of the pulmonary arterial model are demonstrated: the model was successfully manufactured with a 3D-printed mold and was suitable for withstanding a wide range of pulmonary pressures; the stability of the system was demonstrated by the low standard deviations in the pressure and flow measurements; and the feasibility of MRI measurements was shown by acquiring good quality MRI images. These properties allow the setup to potentially address a wide range of hemodynamic questions on the pulmonary side, including the investigation of pathologies (e.g., PAH, unilateral stenosis in the pulmonary artery, unusual flow split in TGA, and Eisenmenger's syndrome) and intervention strategies (e.g., physically deploying stents inside the phantom). Additionally, WIA can be carried out in a controllable in vitro environment.
Highly complex and physically robust patient-specific models can be produced with an anatomically shaped mold and commercially available latex rubber. Furthermore, the modular setup of the mold allows for easy modifications of the latex model. For example, a stenotic latex model can be obtained simply by replacing one of the 11 parts by a 3D-printed stenotic part and following the same manufacturing steps as before. This method is not limited to the pulmonary arteries; compliant aortic models of health and disease can be obtained following the same principles.
Latex has been previously used for its ease of manufacturing and compliant behavior. A limitation of latex, however, is that it oxidises and the properties may change over a longer period of time. This might be reduced by adding additional preservatives and antioxidants to the liquid solution before brushing. Other materials might be used, for instance silicone. However, its high stiffness would pose a major issue for removal of the mold after curing and the influence of a stiff material on the wave speed has to be considered. Even with the latex model wave speed was high, due to the amount of layers required for durability. Fewer layers would probably achieve a more physiological wave speed; however, preference was given to producing a durable model. Among other materials and production techniques, novel rapid prototyping techniques for direct printing of silicone and latex may be employed to eliminate the need of a mold and thereby increase the complexity of the elastomer model. The wall thickness resulting from 10 layers, needed for durability, was 1.7 ± 0.3 mm, substantially higher than values found in vivo [27]. The variability in thickness can be improved by a dip-coating approach with the use of an automated robotic arm [28].
The MCS presented here focuses on hydrodynamic measurements in the pulmonary arterial model. Hence, water alone was used as the flowing medium, which is in line with work on other MCS [1, 29]. This has been done because no major viscous effects were expected in the current setting and because the study was focusing on the feasibility of the setup and pulmonary measurements. A commonly used blood analogue is a solution of water and glycerine with a volume percentage of 33.5% glycerine [2, 5, 29], which could be easily employed in this setting.
The RPA–LPA flow distribution, governed by the downstream resistances, was similar to the normal in vivo flow distribution of 55–45% [30] and the RPA/LPA ratio of 1.18 corresponds to a ratio of 1.1 ± 0.2 for the adult human pulmonary circulation at rest [31]. The pressure for the IPVR scenario (33.8 ± 0.2 mm Hg) was within the range of PAH and was significantly higher than the pressure for the healthy scenario.
The elastomer pulmonary model was used for WIA in a controllable, in vitro environment. However, the invasive nature of WIA in many arteries limits its use in vivo [26]. The forward wave pattern contains an early systolic FCW and a late diastolic FEW, which is in line with previously found patterns in human pulmonary artery. The backward wave pattern contains a late systolic BCW, whereas in vivo studies report both backward expansion waves (BEW) and BCW [17, 32, 33]. It is hypothesised that a BEW is due to the considerable branching of the pulmonary artery and the result of an increase in total cross-sectional area [17, 33], and a decrease in impedance, which is not included in our pulmonary model. Hollander et al. [22] observed a BEW in experiments in control dogs in vivo and a BCW under hypoxic conditions. They postulated that a closed-end reflection site may be present at the third or fourth generation of branches in the hypoxic state. Furthermore, Quail et al. [32] found significant differences between PAH patients and controls, where a BCW was present for PAH patients but absent for controls, and vice versa for a BEW. Since the backward waves in vivo result from reflections from the distal circulation and in our model from reflections from the distal resistances, connecting tubes, and reservoir downstream of the arterial model, further work on the distal parts of our MCS is needed to accurately mimic in vivo behavior.
Within the scope of this work of designing and testing a pulmonary model, needle-pinch valves provided a convenient and reproducible means of controlling resistance and have proven to have sufficient control over increasing pulmonary artery pressure, by approximately doubling PVR for 79% reduction of the minor axis length. However, a needle-pinch valve implements a nonlinear resistor whose resistance increases progressively with reduction of minor axis length. A bundle of capillary tubes would better mimic PVR anatomically, that is, similarity with the capillary bed, and a better resistance control could be achieved by varying its length since that is linearly related to the resistance [1].
Limitations and future work
Shifting of data, typically about 40 ms, based on the linear part of the P-U loop during systole was required mainly because of the different processing times for the pressure and flow transducers. However, a small portion of the shift is also due to the wave travel time between the sites of the two transducers. The distance between the flow transducer outside the inlet of the arterial model and the pressure transducer in the MPA was typically 4 cm. At the measured wave speed this corresponds to a time delay of 4 ms. A better way of correcting the time lag between the fiber optic wire and the ultrasound flow probe is automatic fitting using the highest correlation factor [33]. This was not implemented in the current setup, as this work focused on the feasibility of employing a latex model in a MCS. Therefore, due to the manual shifting, the P-U loop and wave speed in this work have to be considered with care. Another improvement could be replacing the fiber optic pressure wire by a combined Doppler flow and pressure wire for simultaneous pressure and velocity measurements in vivo, thereby reducing the need for shifting.
As a result of the anatomically shaped model with multiple outlets in various spatial orientations, it was difficult to incorporate large compliance chambers directly at the outlets of the model, thereby implementing the needed additional distal compliance without affecting the inflow waveform. A lumped compliance at the common outlet was tested with no effect on the pressure and flow waveforms at the inlet or elsewhere in the model. The compliance chamber between the pump and the inlet of the model successfully implemented proximal compliance and modulated the pressure in the desired range, however giving rise to diastolic flow. A proposed solution to resolve this limitation is to include 50 mL syringes as compliance chambers at each of the seven outlets of the model. This could provide a sufficient amount of additional distal compliance, and will be explored in a future modification of the MCS. It must be noted that the versatility of the MCS should not be compromised in making such modifications, and that the dimensions of the MRI scanner should be taken into account, if using the system for noninvasive/visualization measurements (i.e., 60 cm bore size in our setting).
In future experiments, additional models should be developed for clinically relevant pathologies. For example, a stenotic scenario can be simulated by introducing a narrowing of a vessel on the mold and thus on the latex model. Similarly, a mold can be made to include dilated vessels. These models should give distinct wave patterns that subsequently could be analysed using WIA. In addition, paediatric models could be developed with the challenge of retaining high complexity with small geometry, and consequently implement paediatric values.
As an alternative to invasive measurements, the MCS may also be used for noninvasive measurements. Firstly, a noninvasive WIA technique has recently been developed based on area or diameter rather than pressure [29]. Studies with high temporal resolution phase-contrast magnetic resonance (PCMR) into pulmonary hypertension were able to find significant differences in wave intensity characteristics between hypertensive patients and controls [34].
Second, these specialized and highly complex models can be particularly useful for the comparison and verification of computational fluid dynamics studies with the use of 4D cardiac magnetic resonance (CMR) flow measurements [35, 36]. The main advantages of this noninvasive technique is its ability to obtain time-dependent, 3D distribution of velocity in opaque phantoms. Therefore, MRI measurements of 4D flow are of particular interest and will be investigated in future experiments. Optimization of the imaging resolution will be necessary to accurately capture wall thickness and fluid flows.
Conclusion
A pulmonary arterial model was successfully produced with the use of a 3D-printed mold, based on a patient image dataset. Measurements of flow and pressure in two scenarios demonstrated the versatility of the MCS to investigate a wide range of hemodynamic questions. Future work will focus on further optimising the MCS and pulmonary model, and employing the model for 4D flow MRI measurements.
Acknowledgments
The authors would like to thank Ms. Wendy Norman for supporting in the MRI data acquisition and Dr. Gaetano Burriesci for providing access to the uniaxial tensile testing equipment. Furthermore, the authors would like to acknowledge generous support from a Biomedical Research Centre Award to University College London Hospital, the National Institute for Health Research (NIHR), the Royal Academy of Engineering, and Heart Research UK. The views expressed in this publication are those of the author(s) and not necessarily those of the NHS, the National Institute for Health Research, or the Department of Health.
Footnotes
Author Contributions
Conception and design of the work: PGMK, GB, ADH, SS, RT; experimental setup, data acquisition and analysis: PGMK, GB, LX; interpretation of the data: PGMK, GB, ADH, KHP, RT; drafting the manuscript: PGMK, GB, RT; all authors critically revised the manuscript, read and approved the final manuscript.
Conflict of Interest
The authors declare no conflict of interest.
References
- 1.Kolyva C, Biglino G, Pepper JR, Khir AW. A mock circulatory system with physiological distribution of terminal resistance and compliance: application for testing the intra-aortic balloon pump. Artif Organs. 2012;36:62–70. doi: 10.1111/j.1525-1594.2010.01071.x. [DOI] [PubMed] [Google Scholar]
- 2.Senage T, Fevrier D, Michel M, et al. A mock circulatory system to assess the performance of continuous-flow left ventricular assist devices (LVADs): does axial flow unload better than centrifugal LVAD? Asaio J. 2014;60:140–7. doi: 10.1097/MAT.0000000000000045. [DOI] [PMC free article] [PubMed] [Google Scholar]
- 3.Timms DL, Gregory SD, Stevens MC, Fraser JF. Haemodynamic modelling of the cardiovascular system using mock circulation loops to test cardiovascular devices. Conf Proc IEEE Eng Med Biol Soc. 2011;2011:4301–4. doi: 10.1109/IEMBS.2011.6091068. [DOI] [PubMed] [Google Scholar]
- 4.Gohean J, Figliola R, Camp T, McQuinn T. Comparative in vitro study of bileaflet and tilting disk valve behaviour in the pulmonary position. J Biomech Eng. 2006;128:631–5. doi: 10.1115/1.2206204. [DOI] [PubMed] [Google Scholar]
- 5.Vismara R, Lagana K, Migliavacca F, et al. Experimental setup to evaluate the performance of percutaneous pulmonary valved stent in different outflow tract morphologies. Artif Organs. 2009;33:46–53. doi: 10.1111/j.1525-1594.2008.00673.x. [DOI] [PubMed] [Google Scholar]
- 6.Ferrari G, De Lazzari C, Kozarski M, et al. A hybrid mock circulatory system: testing a prototype under physiologic and pathologic conditions. Am Soc Art Int Organs. 2002;48:487–94. doi: 10.1097/00002480-200209000-00009. [DOI] [PubMed] [Google Scholar]
- 7.Figliola RS, Giardini A, Conover T, et al. In vitro simulation and validation of the circulation with congenital heart defects. Prog Pediatr Cardiol. 2010;30:71–80. doi: 10.1016/j.ppedcard.2010.09.009. [DOI] [PMC free article] [PubMed] [Google Scholar]
- 8.Biglino G, Giardini A, Baker C, et al. MOCHA Collaborative Group. In vitro study of the Norwood palliation: a patient-specific mock circulatory system. Asaio J. 2012;58:25–31. doi: 10.1097/MAT.0b013e3182396847. [DOI] [PubMed] [Google Scholar]
- 9.Tanné D, Bertrand E, Kadem L, Pibarot P, Rieu R. Assessment of left heart and pulmonary circulation flow dynamics by a new pulsed mock circulatory system. Exp Fluids. 2010;48:837–50. [Google Scholar]
- 10.Stevanov M, Baruthio J, Eclancher B. Fabrication of elastomer arterial models with specified compliance. J Appl Phys. 2000;88:1291–4. doi: 10.1152/jappl.2000.88.4.1291. [DOI] [PubMed] [Google Scholar]
- 11.Biglino G, Verschueren P, Zegels R, Taylor AM, Schievano S. Rapid prototyping compliant arterial phantoms for in-vitro studies and device testing. J Cardiovasc Magn Reson. 2013;15:2. doi: 10.1186/1532-429X-15-2. [DOI] [PMC free article] [PubMed] [Google Scholar]
- 12.Simonneau G, Gatzoulis MA, Adatia I, et al. Updated clinical classification of pulmonary hypertension. J Am Coll Cardiol. 2013;62:D34–41. doi: 10.1016/j.jacc.2013.10.029. [DOI] [PubMed] [Google Scholar]
- 13.Kreutzer J, Landzberg MJ, Preminger TJ, et al. Isolated peripheral pulmonary artery stenoses in the adult. Circulation. 1996;93:1417–23. doi: 10.1161/01.cir.93.7.1417. [DOI] [PubMed] [Google Scholar]
- 14.Greiger J, Hirtler D, Bürk J, et al. Postoperative pulmonary and aortic 3D haemodynamics in patients after repair of transposition of the great arteries. Eur Radiol. 2014;24:200–8. doi: 10.1007/s00330-013-2998-4. [DOI] [PMC free article] [PubMed] [Google Scholar]
- 15.Broberg CS, Ujita M, Prasad S, et al. Pulmonary arterial thrombosis in Eisenmenger syndrome is associated with biventricular dysfunction and decreased pulmonary flow velocity. J Am Coll Cardiol. 2007;50:634–42. doi: 10.1016/j.jacc.2007.04.056. [DOI] [PubMed] [Google Scholar]
- 16.Parker KH, Jones CJH. Forward and backward running waves in the arteries: analysis using the method of characterisation. J Biomech Eng. 1990;112:322–6. doi: 10.1115/1.2891191. [DOI] [PubMed] [Google Scholar]
- 17.Jones CJ, Sugawara M, Kondoh Y, Uchida K, Parker KH. Compression and expansion wavefront travel in canine ascending aortic flow: wave intensity analysis. Heart Vessels. 2002;16:91–8. doi: 10.1007/s003800200002. [DOI] [PubMed] [Google Scholar]
- 18.Zambanini A, Khir AW, Byrd SM, Parker KH, Thom SAM, Hughes AD. Wave intensity analysis: a novel non-invasive method for determining arterial wave transmission. Comput Cardiol. 2002;29:717–20. [Google Scholar]
- 19.Sun YH, Anderson TJ, Parker KH, Tyberg JV. Wave-intensity analysis: a new approach to coronary hemodynamics. J Appl Physiol. 2000;89:1636–44. doi: 10.1152/jappl.2000.89.4.1636. [DOI] [PubMed] [Google Scholar]
- 20.Hollander EH, Wang JJ, Dobson GM, Parker KH, Tyberg JV. Negative wave reflections in pulmonary arteries. Am J Physiol Hearth Circ Physiol. 2001;281:H895–902. doi: 10.1152/ajpheart.2001.281.2.H895. [DOI] [PubMed] [Google Scholar]
- 21.Dwyer N. Pulmonary arterial wave intensity analysis in health and disease. Faculty of Health Science; University of Tasmania: 2010. PhD thesis. [Google Scholar]
- 22.Bowles CT, Shah SS, Nishimura K, et al. Development of mock circulation models for the assessment of counterpulsation systems. Cardiovasc Res. 1991;25:901–8. doi: 10.1093/cvr/25.11.901. [DOI] [PubMed] [Google Scholar]
- 23.Parker KH. An introduction to wave intensity analysis. Med Biol Eng Comput. 2009;47:175–88. doi: 10.1007/s11517-009-0439-y. [DOI] [PubMed] [Google Scholar]
- 24.Khir AW, O'Brien A, Gibbs JSR, Parker KH. Determination of wave speed and wave separation in the arteries. J Biomech. 2001;34:885–91. doi: 10.1016/s0021-9290(01)00076-8. [DOI] [PubMed] [Google Scholar]
- 25.Press WH, Teukolsky SA, Vetterling WT, Flannery BP. Numerical Recipes. 3rd Edition. New York: Cambridge University Press; 2007. [Google Scholar]
- 26.Sugawara M, Niki K, Ohte N, Okada T, Harada A. Clinical usefulness of wave intensity analysis. Med Biol Eng Comput. 2009;47:197–206. doi: 10.1007/s11517-008-0388-x. [DOI] [PubMed] [Google Scholar]
- 27.Li N, Zhang S, Hou J, Jang IK, Yu B. Assessment of pulmonary artery morphology by optical coherence tomography. Heart Lung Circ. 2012;21:778–81. doi: 10.1016/j.hlc.2012.07.014. [DOI] [PubMed] [Google Scholar]
- 28.Rahmani B, Tzamtzis S, Ghanbari H, Burriesci G, Seifalian AM. Manufacturing and hydrodynamic assessment of a novel aortic valve made of a new nanocomposite polymer. J Biomat. 2012;45:1205–11. doi: 10.1016/j.jbiomech.2012.01.046. [DOI] [PubMed] [Google Scholar]
- 29.Biglino G, Steeden JA, Baker C, et al. A non-invasive clinical application of wave intensity analysis based on ultrahigh temporal resolution phase-contrast cardiovascular magnetic resonance. J Cardiovasc Magn Reson. 2012;14:57–66. doi: 10.1186/1532-429X-14-57. [DOI] [PMC free article] [PubMed] [Google Scholar]
- 30.Fishman AP, Turino GM, Brandfonbrener M, Himmelstein A. The “effective” pulmonary collateral blood flow in men. J Clin Invest. 1958;37:1071–86. doi: 10.1172/JCI103688. [DOI] [PMC free article] [PubMed] [Google Scholar]
- 31.Cheng CP, Herfkens RJ, Taylor CA, Feinstein JA. Proximal pulmonary artery blood flow characteristics in healthy subjects measured in an upright posture using MRI: the effects of exercise and age. J Magn Reson Imaging. 2005;21:752–8. doi: 10.1002/jmri.20333. [DOI] [PubMed] [Google Scholar]
- 32.Quail MA, Kninght DS, Steeden JA, et al. Noninvasive pulmonary artery wave intensity analysis in pulmonary hypertension. Am J Physiol Heart Circ Physiol. 2015;308:H1603–11. doi: 10.1152/ajpheart.00480.2014. [DOI] [PMC free article] [PubMed] [Google Scholar]
- 33.Swalen MJP, Khir AW. Resolving the time lag between pressure and flow for the determination of local wave speed in elastic tubes and arteries. J Biomech. 2009;42:1574–7. doi: 10.1016/j.jbiomech.2009.03.038. [DOI] [PubMed] [Google Scholar]
- 34.Quail MA, Knight DS, Steeden JA, Taylor AM, Muthurangu V. Novel magnetic resonance wave intensity analysis in pulmonary hypertension. J Cardiovasc Magn Res. 2014;16:252–3. [Google Scholar]
- 35.Biglino G, Cosentino D, Steeden JA, et al. Using 4D cardiovascular magnetic resonance imaging to validate computational fluid dynamics: a case study. Front Pediatr. 2015;3:107. doi: 10.3389/fped.00107. [DOI] [PMC free article] [PubMed] [Google Scholar]
- 36.Anderson JR, Diaz O, Klucznik R, et al. Validation of computational fluid dynamics methods with anatomically exact, 3D printed MRI phantoms and 4D pcMRI. Conf Proc IEEE Eng Med Biol Soc. 2014:6699–701. doi: 10.1109/EMBC.2014.6945165. [DOI] [PubMed] [Google Scholar]


