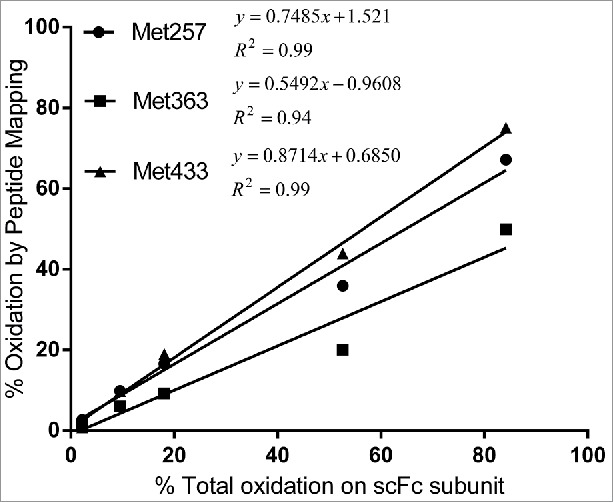
Figure 5.

Correlation of scFc oxidation results by peptide mapping and subunit mass analysis. Levels of Met257, Met363 and Met433 oxidation quantified by peptide mapping were plotted as a function of total oxidation on scFc quantified by subunit mass analysis.
