

Abstract
Spatial heterogeneity in tumors is generally thought to result from branching clonal evolution driven by random mutations that accumulate during tumor development. However, this concept rests on the implicit assumption that cancer cells never evolve to a fitness maximum because they can always acquire mutations that increase proliferative capacity. In this study, we investigated the validity of this assumption. Using evolutionary game theory, we demonstrate that local cancer cell populations will rapidly converge to the fittest phenotype given a stable environment. In such settings, cellular spatial heterogeneity in a tumor will be largely governed by regional variations in environmental conditions, e.g. alterations in blood flow. Model simulations specifically predict a common spatial pattern in which cancer cells at the tumor-host interface exhibit invasion-promoting, rapidly-proliferating phenotypic properties, while cells in the tumor core maximize their population density by promoting supportive tissue infrastructures e.g. to promote angiogenesis. We tested model predictions through detailed quantitative image analysis of phenotypic spatial distribution in histological sections of 10 patients with stage 2 invasive breast cancers. CAIX, GLUT1 and Ki67 were upregulated in the tumor edge consistent with an acid-producing invasive, proliferative phenotype. Cells in the tumor core were 20% denser than the edge, exhibiting upregulation of CAXII, HIF-1α and cleaved caspase-3, consistent with a more static and less proliferative phenotype. Similarly, vascularity was consistently lower in the tumor center compared to the tumor edges. Lymphocytic immune responses to tumor antigens also trended to higher level in the tumor edge, although this effect did not reach statistical significance. Like invasive species in nature, cancer cells at the leading edge of the tumor possess a different phenotype from cells in the tumor core. Our results suggest that at least some of the molecular heterogeneity in cancer cells in tumors is governed by predictable regional variations in environmental selection forces, arguing against the assumption that cancer cells can evolve toward a local fitness maximum by random accumulation of mutations.
Major Findings
Like invasive species in nature, cancer cells at the leading edge of the tumor possess a different phenotype from cells in the tumor core. We conclude that at least some intratumoral heterogeneity in the molecular properties of cancer cells is governed by predictable regional variations in environmental selection forces.
Keywords: Species, speciation, selection, intratumoral, heterogeneity, evolution, spatial, microenvironment
Quick Guide to Equations and Assumptions.
Darwinian dynamics of intratumoral heterogeneity
The fitness generating function is given by
The fitness of a focal individual in a habitat i = A or B of species j is a function of its strategy u and the current density of individuals within that habitat xi given by
The individuals’ strategy u within a habitat affects both the logistic growth rate and carrying capacity given by
A strategy u will converge on a distribution of individuals among habitats such that the strategy has the same per capita growth rate in each habitat. Equilibrating and substituting q = xA/xB results in
Therefore the frequency with which a strategy u will eventually experience habitat A for any fixed biotic environment is given by
The population dynamics of the size of a species within a habitat is given by
The strategy dynamics is given by
Together the population dynamics and the strategy dynamics represent the complete Darwinian dynamics of the system. The ecological and evolutionary dynamics generally converge on an “evolutionary stable strategy” (ESS). At an ESS the system becomes both ecologically [∂x/∂t = 0] and evolutionarily stable [∂G/∂v =0].
Parameters
c is a constant that scales the speed of evolutionary change;
di is an extrinsic mortality term not built into the logistic growth due to ecological properties of the habitat;
ri0 is the maximum growth rate of each habitat i = A or B;
ki0 is the maximum carrying capacity of each habitat i = A or B;
is a constant characterizing the Gaussian penalty due to strategy to ri (u) and Ki (u);
mi is the per capita migration rate of individuals from habitat i to the alternate habitat l for l ≠ i;
Major Assumptions
Species are identical in all ways except for the values of their strategies.
The strategy u represents investment along a continuum of all CAIX (u =0) and all CAXII (u =1).
A tradeoff exists between fitness in the two habitats where ∂FA/∂u>0 and ∂FB/∂u <0.
There are diminishing returns in fitness in habitat A from increasing u, and to fitness in B from decreasing u where ∂ 2FA/∂u2 <0 and ∂ 2FB/∂u2 <0.
Individuals compete with each other for limiting resources within each habitat so fitness within a habitat declines with an increase of individuals within that habitat where ∂FA/∂ xA <0 and ∂FB/∂ xB <0.
Migration rates mA and mB are passive in that we assume that mA and mB are independent of strategies, u, and species population sizes, xA and xB.
Introduction
While patient-specific, precision therapy remains an important goal in oncology, treatment strategies based on static and non-spatial data can be limited as somatic evolution continuously alters the tumor environments and cell populations over space and time (1). For example, recent studies demonstrate significant intratumoral spatial heterogeneity in the molecular properties of cancer cells in several tumor types (2–4). These regional variations are widely recognized as evidence of intratumoral evolution but the proposed dynamics typically focus on random acquisition of mutations that confer a fitness advantage resulting in a “selective sweep” (5, 6) by the new population. An important clinical implication of this conventional “clonal branching” model is that intratumoral molecular heterogeneity, because it is dependent on stochastic accumulation of mutations, must be fundamentally unpredictable.
An implicit assumption of conventional models of intratumoral evolution is that cancer cells do not achieve a fitness maximum so that cancer cells can always undergo mutations that increase their fitness allowing a new population to emerge even within a static environment. In contrast, we note that very different dynamics will results if tumor cells, like most species in nature, rapidly evolve to local fitness maximum (7) so that no heritable change can further increase its fitness. In fact, under such conditions, the population will tend converge to a single dominant phenotype resulting in decreasing heterogeneity. Thus, in this alternative model of cancer evolution, spatial variation of phenotypes must result from local variations in environmental factors that select for different phenotypic properties. For example, regions of low blood flow, a common observation in tumor imaging, will select for tumors that are optimally adapted to environmental conditions that include reduced availability of substrate and blood-derived growth factors. Importantly, in contrast to the conventional model, this approach requires molecular characteristics of cancer cells to be non-random. That is, the local phenotypic properties of cancer cells should be generally predictable with sufficient understanding of local environmental properties and Darwinian dynamics (8).
Here we frame this hypothesis using mathematical models from evolutionary game theory (9) (10). The quantitative methods extend prior work that applied classic evolutionary trade-offs between fecundity and survivorship. That is, we propose cancer cells, like all evolving organisms, can invest resources to maximize fecundity or survivorship but not both (11). This Darwinian trade-off manifests in cancer cells as two tumor cell types roughly correspond to what is known as r and K selection [12] where “r” refers to a species with maximal growth rate (capacity to grow at low population densities) as opposed to “K” referring to a species that maximizes its carrying capacity (capacity to maintain growth at high population densities).
Although based on simple evolutionary first principles, the model leads to complex and variable spatial and temporal population. However, we find that the model does consistently predict one property of the tumor ecology – that the cancer cells at the tumor-host interface will demonstrate phenotypic properties that are consistent between tumors but very different from the properties of cells deeper within the same tumor. We then examine model predictions through detailed, quantitative analysis of spatial distribution of phenotypic properties in histological sections taken from 10 patients with Stage 2 invasive breast cancers.
Materials and Methods
All clinical components of the study were completed with the approval of the University of South Florida Institutional Review Board. Participant’s written consent was not obtained because all personal health information was de-identified and analyzed anonymously. The Moffitt Scientific Review Committee and University of South Florida IRB committee both approved this protocol (MCC 16511).
Mathematical Model
We investigate a mathematical model from evolutionary game theory of habitat heterogeneity (12) in which we envision two habitats: the core of the tumor versus the tumor edge. We assume that cancer cells can evolve while normal cells do not. However, normal mesenchymal cells retain phenotypic plasticity and may be influenced and/or co-opted by the tumor cells to generate a tissue infrastructure that favors cancer growth. Within a habitat we assume that the cancer cells compete for limiting resources but do not interact directly with cells in the other habitat. Indirectly, however, they habitats do interact via migration where a fraction of the population form each habitat actively moves into the adjacent habitat or find themselves in that habitat as the edge of the tumor either recedes, expands or shifts location.
We imagine an evolutionary strategy that represents a tradeoff between capacities to produce Carbonic Anhydrase (CA): CAXII versus CAIX. CAIX and XII are extracellular enzymes that catalyze the reversible hydration of CO2 to bicarbonate and a proton:
CAIX is a transmembrane glycoprotein whose catalytic domain faces the extracellular milieu (13). CAXII has a similar overall secondary structure and orientation to CAIX, although missing the PG-like domain. CAIX sets the extracellular pH at 6.8 while CAXII sets the extracellular pH at 7.4. We use this difference in extracellular pH set point as markers for phenotypic strategy. It is also reported that CAIX is a poor prognostic indicator and CAXII is a positive prognostic indicator in breast cancer(14).
The buffering and habitat modulating properties of CAXII promotes or are associated with higher carrying capacity (K) and lower maximum proliferation rates (r) – such a species emphasizing CAXII is “K -selected”. The acid tolerating properties of CAIX promotes or are associated with resistance to the immune system, degradation of normal cells, and higher proliferation rates – such a species is “r -selected”. We scale the heritable strategy, u, to range from u = 0 (maximum carrying capacity K and minimum growth rate r) to u = 1 (minimum K and maximal r).
Via competition within habitats and migration between habitats, the tumor cells engage in an evolutionary game in which an individual’s fitness, G(u, u, xA, xB), depends upon its strategy, u, the strategies of the other tumor cells, u, and population sizes of tumor cells in the interior (A) and edge (B) of the tumor, xA and xB, respectively. The evolutionary dynamics of the cancer cell strategies can be visualized on an adaptive landscape. This landscape plots G versus the strategy of the focal individual, u. The adaptive landscape is fixed for a given tumor population with its associated strategies and population sizes. But, as the populations’ strategies evolve (evolutionary dynamics) and their associated population sizes change (ecological dynamics) the landscape also changes. Hence the landscape itself is dynamic in response to the Darwinian dynamics of strategies and population sizes (15). At any time and point along this landscape the population will evolve “uphill” until it reaches a convergent stable point – at this point, the slope of the landscape is zero (∂G/∂v = 0), and the population sizes equilibrate so that fitness is 0 (G = 0). This convergent stable point can either be at a maximum or minimum of the adaptive landscape (16) If at a maximum, then the cancer has evolved to its evolutionarily stable strategies (ESS) and such a state will be both ecologically and evolutionarily persistent. If at a minimum, then the cancer cell population is under strong disruptive selection and it should “speciate” into two distinct clades that diverge and evolve to occupy distinct niches seen as distinct peaks of the adaptive landscape (17).
Further methods, details and theories of the game theory model and image analysis strategies may be found in Supplemental material.
Case selection
Following approval by the Institutional Review Board, ten patients with formalin fixed and paraffin embedded (FFPE) blocks of diagnosed invasive ductal breast carcinoma were retrospectively examined. Cases were selected by a practicing pathologist (MMB) to include five each of the three Nottingham score grades.
Histology
Sectioning
The Tissue Core at Moffitt located each FFPE block and 4μm serial slides from each patient were sectioned using standard histotechnique.
Immunohistochemical staining
Slides were stained using a Ventana Discovery XT automated system (Ventana Medical Systems, Tucson) as per manufacturer’s protocol with proprietary reagents. Slides were deparaffinized on the automated system with EZ Prep solution (Ventana).
For the CD34 staining, the mouse monoclonal antibody CMA334 (Cell Marque, Rocklin, CA) was used at a prediluted concentration and incubated for 16 minutes. The Ventana OmniMap anti-mouse secondary antibody was incubated for 12 minutes. Ventana ChromoMap was used for detection.
For the KI67 staining, the rabbit primary antibody #790-4286 (Ventana) was applied and incubated for 16 minutes. The Ventana anti-rabbit secondary was incubated for 16 minutes. The detection system was OmniMap.
To stain for CAIX, the rabbit primary antibody #ab15086 (Abcam, Cambridge, MA) was used at a 1:500 concentration in Dako antibody diluent and incubated for 32 minutes. The OmniMap anti-rabbit secondary was used for 20 minutes. ChromoMap was used for detection.
For CAXII, the rabbit primary antibody #HPA008773 (Sigma, St. Louis, MO) was used at a 1:75 concentration in Dako antibody diluent and incubated for 32 minutes. The OmniMap anti-rabbit secondary was used for 20 minutes. The detection system was ChromoMap.
Each set was counter stained with hematoxylin then dehydrated and coverslipped per standard histological protocol.
Imaging and Analysis
Image acquisition
Stained slides were digitally scanned using the Aperio (Vista, CA, USA) ScanScope XT high-throughput slide scanning instrument (200x/0.75NA objective with a rate of 2–3 minutes per slide via Basler tri-linear array).
Segmentation
Histology pattern recognition technology used included both Aperio’s GENIE® software and Definiens (Munich, Germany) TissueStudio™ v3.0 to identify tumor regions of interest [26, 27]. Regions of the tumor edge were defined as areas within 1mm of the tumor-host interface and tumor center regions were defined as any area deeper than 1mm of the tumor-host interface. For each measurement a 500μmx500μm subregion was randomly selected using a custom Matlab (R2014b) script. Three subregions were used for each analysis of the center or edge regions for each patient sample. Furthermore, single cells were identified as tumor and mesenchymal regions, respectively, by identifying the nuclei and growing cell simulations 5μm. The classified nuclear and cytoplasmic subcellular compartments were evaluated independently for biomarkers which localize to a specific cellular region. Intensity thresholds from each biomarker were determined by the study pathologist (MMB) and retained consistently for each patient set.
Results
Cancer adaptive landscapes and Intra-tumoral evolution
While tumors likely possess a large number of ecological niches, our model simulations focused on just two: 1. The tumor-host interface in which tumor cells compete primarily interact with elements of normal tissue including the predatory effects of the immune response and normal tissue infrastructure such as intact blood vessels and 2. The interior in which tumor cells compete with each other and must actively promote formation of the mesenchymal infrastructure required to support the population.
If the population of tumor cells is well mixed between edge and interior of the tumor (high migration rate, m), then evolution promotes an ESS that is a single clone (Figure 1). This clone possesses a generalist strategy balancing the need for a higher r when facing the edge habitat and a higher K when facing the interior. No matter the starting strategy of the population, it will evolve towards the same peak of the adaptive landscape. We expect this outcome when either the spatial heterogeneity of habitat types is very fine-grained, or the cells for some reason are highly motile and frequently move from one habitat to the next, which itself could be a response to environmental selective pressures (18). For larger more advanced tumors, we would expect edge and interior habitats to be more coarse-grained, and the likelihood of a given tumor cell moving from one to the other to be relatively small on a per 8–24 hour basis (the likely unit of time in our model).
Figure 1.
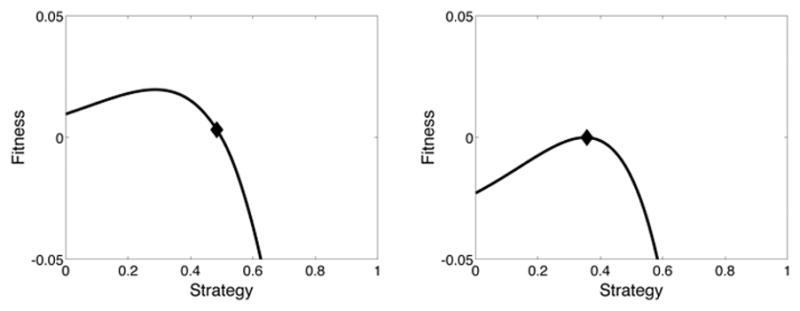
Evolution of a population of cells in an environment where the migration rate is high (m = 0.1). The initial population begins with a strategy u=0.5 (left panel). Evolutionary dynamics will cause this population’s strategy to climb the adaptive landscape. Through both the ecological and evolutionary dynamics an ESS is achieved at a strategy of u=0.3564 (right panel).
If the migration rate is small, an axis of heterogeneity describing the edge to interior of the tumor can result in the speciation of a single clonal cancer lineage into two distinct phenotypes specialized to exploit different regions of tumor heterogeneity (Figure 2). If the tumor starts with a single evolving population of cancer cells, then these cells evolve up the slope of the adaptive landscape. But instead of achieving a peak, they actually evolve to an evolutionarily stable minimum on the landscape. At this point disruptive selection should promote speciation and the divergence of separate tumor cell types. The one being K -selected (CAXII) and the other r -selected (CAIX). While some spatial overlap will occur between the two types, the former will predominate in the interior of the tumor and the latter at the tumor’s edge.
Figure 2.
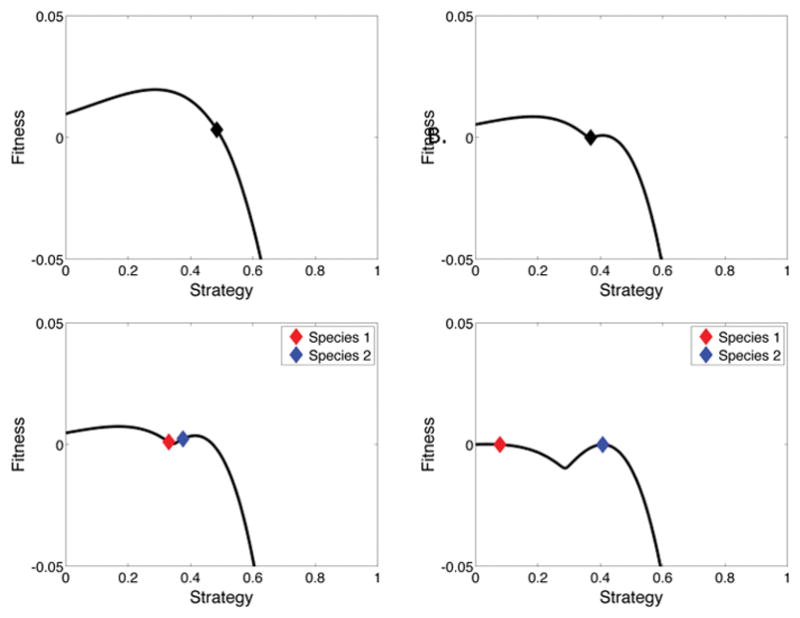
Evolution of a population of cells in an environment where the migration rate is low (m=0.001). Again, the initial population begins with a strategy of u=0.5 and begins to climb the adaptive landscape (upper left). Instead of achieving a peak, the population actually evolves to an evolutionarily stable minima of the landscape at u=0.3677 (upper right). Disruptive selection causes the single population to diverge into two separate species. The one being K-selected is shown as species 1 in red and evolves to an ESS of u=0.0774. The other being r-selected is shown as species 2 in blue and evolved to an ESS of u=0.4074 (bottom panels).
More generally the model shows how the grain-size of habitat heterogeneity and the motility of tumor cells will determine whether tumor heterogeneity promotes generalist versus more specialist tumor “species”. Figure 3 shows how low migration rates promote speciation and divergent strategies among the tumor cells. As the migration rate increases, the values of the two strategies comprising the ESS begin to converge and do so at a critical threshold value of migration. At higher rates of migration above this threshold, the ESS is a single species with a generalist strategy (Figure 3).
Figure 3.
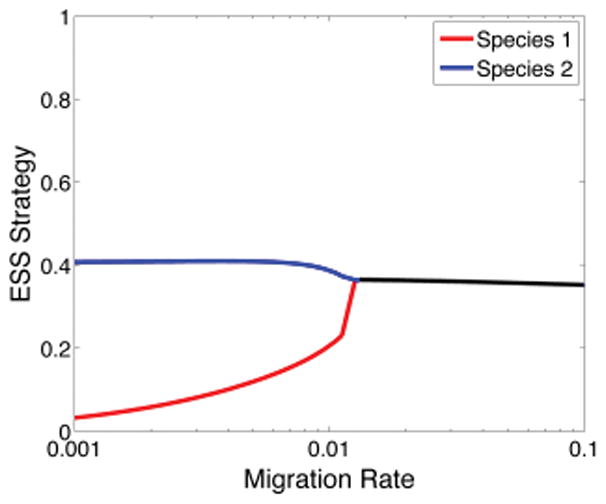
Evolutionary stable strategies vs. the migration rate m. Speciation into two distinct strategies occurs at low migration rates (m < 0.012). At high migration rates (m> 0.012) the values of the two strategies converge to a single species with a generalist strategy. The dynamics of m = 0.1 are shown in Figure 1 and the dynamics of m = 0.001 are shown in Figure 2.
In summary, the model simulations demonstrate that selection forces in the tumor core favor tumor cells with “engineering” phenotypes that maximize carrying capacity by promoting angiogenesis and aggressively competing for limited resources. Conversely, the tumor cells at the leading edge (i.e. the tumor-host interface) possess “pioneering” phenotypes that maximize their invest resources in invasive strategies that permit them to acquire resources through co-opting normal vessels and other host mesenchyma even at the expense of a potentially higher death rate due to host response. Thus, in general our models predict “engineering” phenotypes will dominate the tumor core while cells at the leading edge of tumor will exhibit phenotypes that can pioneer in a novel, and sometimes hostile environment. Interestingly, this prediction is consistent with observations in nature that “weedy” phenotypes (i.e. higher maximum proliferation rates at the expense of lower carrying capacities) predominate at the leading edge of a population invasion when compared to individuals in regions far from the propagating border(19).
Clinical Analysis
As described above, the evolutionary models predict observable changes in the neoplastic cells and the environment in both the center and edge regions of a tumor. We tested these model predictions with clinical analysis of histological sections evaluated by quantitative image analysis. Our clinical results indicate a number of consistently observed and quantified changes in cell density, cell proliferation, cell death, cell aggression, acidosis, and hypoxia in both locations (each measured in triplicate) of histological samples of ten invasive breast cancer patients. Furthermore, the presence of lymphocytes and vascular resources in the microenvironment were measured in triplicate in both locations of the same tumors (See Table 1 and Figure 4).
Table 1.
Statistical summary for each biomarker by region interaction.
| multiple r2 | F-Ratio (habitats) | F-Ratio (patients) | F-Ratio (habitats*patients) | p-Value (habitats) | p-Value (patients) | p-Value (habitats*patients) | |
|---|---|---|---|---|---|---|---|
|
|
|||||||
| Cell Density | 0.072 | 15.387 | 9.297 | 0.495 | <0.0001 | <0.0001 | n.s. |
| CAIX | 0.908 | 255.766 | 7.881 | 4.513 | <0.0001 | <0.0001 | 0.001 |
| CAXII | 0.927 | 329.297 | 12.495 | 3.318 | <0.0001 | <0.0001 | 0.006 |
| Ki67 | 0.88 | 73.58 | 21.559 | 1.516 | <0.0001 | <0.0001 | n.s. |
| CC3 | 0.838 | 45.231 | 12.036 | 5.993 | <0.0001 | <0.0001 | <0.0001 |
| Glut1 | 0.933 | 148.704 | 22.081 | 1.692 | <0.0001 | <0.0001 | n.s. |
| HIF-1α | 0.861 | 13.4 | 24.44 | 1.516 | 0.001 | 0.001 | n.s. |
| CD34 (#) | 0.797 | 22.482 | 12.661 | 2.261 | <0.0001 | <0.0001 | n.s. |
| CD34 (#) | 0.64 | 27.25 | 2.886 | 1.692 | <0.0001 | 0.014 | n.s. |
| Lymphocytes | 0.793 | 0.057 | 14.708 | 2.744 | 0.812 | <0.0001 | n.s. |
Figure 4.

H&E images of a Grade III invasive breast cancer. A) Regions were randomly selected from the whole slide image such that three regions were within 1mm of the edge of the tumor border (black boxes) and three regions were located near the center of the tumor region (yellow boxes). Scale=2mm. B) Each edge region and C) each center region are shown at 200x magnification. Scale =100μm. D) is a digitally zoomed to 1000x from the dotted black box and demonstrates the tumor cell identification (blue points) and lymphocyte identification (teal points) used to calculate both the tumor cell density and lymphocyte numbers in each of the 60 H&E and 600 total images evaluated. Scale =100μm. E) Scatter plot of the 10 patient’s (x-axis) cell density (y-axis) for the center (blue) and edge (orange) regions.
First, the tumor cell density was evaluated. We used a partially-hierarchical ANOVA (SYSTAT version 13) to test for the effects of tumor cell density (number of tumor cells per area) and habitat (tumor center versus tumor edge; each with triplicate sampling) for each of 10 patients. These analyses were calculated by quantifying the number events (as indicated as the number of tumor cells or, for each biomarker, strongly expressing tumor cells) within a 500μm by 500μm subregion. Each subregion was extracted randomly, in triplicate, from within 1mm of the mesenchymal interface for edge samples and beyond 1mm from the mesenchymal interface for center regions. The cell density model provided a good fit to the data (multiple r2=0.72). The patient (F-Ratio=0.49, not significant [n.s.]) was not found to influence the ratio of cell counts per region so that the tissue slices provided roughly the same ratio of cancer cells regardless of patient. Cancer cell abundances varied significantly by center and edge region (F-Ratio=15.39, P<0.001) for all patients (F-Ratio=9.20, P<0.001). This indicates that cells in the tumor center out-numbered cells at the tumor edge consistently across all patients with statistical significance.
Second, the tumor cell proliferation was evaluated by evidence of Ki-67 expression across tumor cells in triplicate for both regions for the same 10 patients. The model also provided a good fit to the data (multiple r2=0.88). Again the patient (F-Ratio=2.74, not significant [n.s.]) was not found to influence the ratio of Ki67 positive cells per region so that the tissue slices provided roughly the same ratio of Ki67 positivity regardless of patient. Proliferation varied very significantly by center and edge region (F-Ratio=73.58, P<0.001) for all patients (F-Ratio=21.56, P<0.001). This indicates that proliferative cells in the tumor edge consistently out-numbered cells in the tumor center across all patients with statistical significance.
Next, the tumor cell death by apoptosis was evaluated by evidence of cleaved caspase 3 (CC3) expression across tumor cells in triplicate for both regions for the same 10 patients. The model also provided a good fit to the data (multiple r2=0.84). Here CC3 expression varied very significantly by center and edge region (F-Ratio=45.23, P<0.001) for all patients (F-Ratio=12.04, P<0.001). This indicates that apoptosis in the tumor center consistently out-numbered cells in the tumor edge across all patients with statistical significance.
Then, a number of additional metabolomic biomarkers which indicate tumor cell aggression, acidosis, glycolysis and hypoxia were tested. Aggressive, acid producing cells should be consistently observed in the tumor edge while cells in vascularized regions of the remainder of the tumor should be functioning in normal pHe. To test model predictions, we examined the spatial distribution of Carbonic Anhydrase IX and XII (CAIX and XII) as biomarkers for regional high and low acidity respectively.
The model provided a good fit to the CAIX data (multiple r2=0.91) and the CAXII data (multiple r2=0.93). CAIX expression varied very significantly by center and edge region (F-Ratio=255.77, P<0.001) for all patients (F-Ratio=7.88, P<0.001) whereas CAXII expression varied very significantly by center and edge region (F-Ratio=329.27, P<0.001) for all patients (F-Ratio=12.50, P<0.001). This indicates that CAIX expressing cells in the tumor edge consistently out-numbered cells in the tumor center across all patients with statistical significance when the converse is true of CAXII which consistently has higher expression in the tumor center across all patients with statistical significance. This matched with the predictions of the evolutionary mathematical models (Figure 5).
Figure 5.
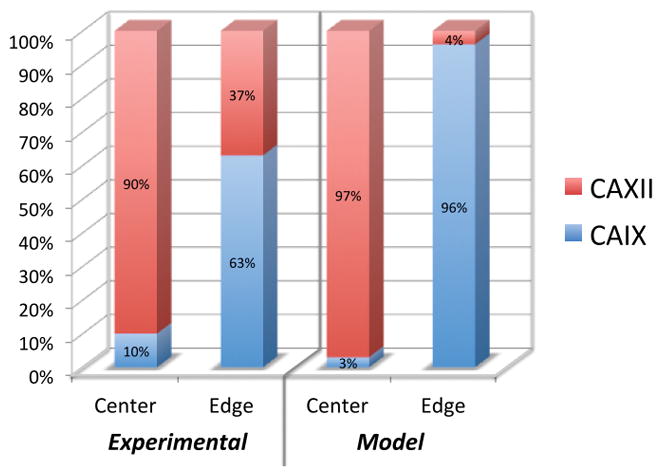
Experimental and mathematical model results showing the percentage of total cells counted in the center and edge that expressed either CAIX or CAXII. Experimental results showed that 90% of the cells in the center of the tumors expressed CAXII while only 10% expressed CAIX. Conversely 63% of the cells in at the edge of the tumors expressed CAIX. The mathematical model showed that 97% of the cells in the center would express CAXII and 96% of the cells at the edge would express CAIX.
Glycose transporter 1 (GLUT1), also known as solute carrier family 2 facilitated glucose transporter member 1 (SLC2A1) (multiple r2=0.93) and hypoxia-inducible factor 1-alpha (HIF1α) (multiple r2=0.86) measurements were similarly modeled. GLUT1 expression varied very significantly by center and edge region (F-Ratio=148.70, P<0.001) for all patients (F-Ratio=22.08, P<0.001) whereas HIF1α expression varied very significantly by center and edge region (F-Ratio=13.40, P=0.001) for all patients (F-Ratio=24.44, P<0.001). This indicates that GLUT1 expressing cells in the tumor edge consistently out-numbered cells in the tumor center across all patients with statistical significance when the converse is true of HIF1α which consistently has higher expression in the tumor center across all patients with statistical significance.
Finally, two aspects of the environment were quantified- the vascular density (number and area of vasculature) and the density of lymphocytes per region area. The number of blood vessels per area (multiple r2=0.80), the area of vascular involvement (multiple r2=0.77) and the density of lymphocytes (multiple r2=0.79) were modeled. The number of blood vessel per area varied significantly by center and edge region (F-Ratio=22.48, P<0.001) for all patients (F-Ratio=12.66, P<0.001) whereas the area of vascular involvement varied significantly by center and edge region (F-Ratio=16.85, P<0.001) for all patients (F-Ratio=11.62, P<0.001) whereas lymphocytic density did not vary significantly by center and edge region (F-Ratio=0.057, n.s.) but was consistent for all patients (F-Ratio=14.71, P<0.001). This indicates that the number and area of vasculature was statistically greater at the tumor edge than in the tumor center across all patients however the lymphocytes were statistically similar in both the edge and center regions across all patients. Non-specific staining of one of the patients may have resulted in an artificially high patient interaction effect. When this patient’s samples were removed the trend remained constant for the center to edge effect (F-Ratio=27.25, P<0.001) and the patient effect was reduced to (F-Ratio=2.89, n.s.). The lymphocytic response, taken together with the tumor cell density does however indicate that the ratio of lymphocytes to tumor cells is consistently high at the tumor edge (where the tumor cell density is lower than the center).
Overall, the biomarker measures of tumor cells are strikingly segregated by center and edge regions. This species by habitat interaction contributes most to the explained variation within the statistical model (see Table 1 for a statistical summary for each biomarker by region interaction). See Figure 6 for a graphical representation of each data point.
Figure 6.

Comparison of tumor cell molecular properties at the invasive edge compared to the tumor core. A) An image panel of center (top) and; B) edge (bottom) regions are displayed to demonstrate examples of each biomarker staining within each area of interest. Scale =100μm. C) Scatter plot of the 10 patient’s (x-axis) CAIX, CXII, Ki67, CC3, GLUT1, HIF-1α and CD34 biomarkers for the center (blue) and edge (orange) regions.
Discussion
The conventional model of intratumoral evolution allows new “driver” mutations to accumulate indefinitely resulting in branching clonal evolution. This conceptual model implicitly assumes that tumor cells never achieve a local fitness maximum so that new mutations can always generate a novel (and fitter) genotype and phenotype. Here we explore an alternative model in which cancer cells may evolve to an evolutionary stable state (ESS) and, thus, cannot be displaced by new strategies if the environment remains stable. This would lead to local phenotypic convergences so that regional molecular variations, rather than the result of random mutations, would represent reasonably predictable phenotypic adaptations to changes in environment conditions such as blood flow, as described in the results, and via conventional clinical imaging such as MRI. This model would be supported by identification of a simple, consistent spatial variation in tumor molecular properties that emerged directly from fundamental evolutionary dynamics.
Here, we framed this hypothesis mathematically using evolutionary game theory. Although built on a simple conceptual model, computer simulations demonstrate the ecological dynamics within cancers can be quite complex and highly variable from tumor to tumor. However, a common pattern emerged as our models predicted cancer cells at the invasive front of the tumor will consistently possess distinct phenotypic properties when compared to the cells in the core. Interestingly, similar patterns of distinctive phenotypes at the leading edge have been observed in biological invasions such as the cane toad in Australia (20) and the house sparrow in Kenya (21).
Detailed analysis of spatial molecular heterogeneity in ten clinical breast cancers demonstrates a consistent regional distribution in which proliferation, the ratio of tumor cells to lymphocytes, GLUT1 and CAIX expression were higher at the tumor edge. Conversely, tumor cell density, apoptosis, HIF1α and CAXII expression were observed to be greater in the tumor center. We also investigated the location of increased vascularity and cell death. While the number of clinical tumors is small, we note that the results are highly statistically significant. Furthermore, other clinical studies have observed changes in gene expression in the edge of cutaneous squamous cell carcinoma (22, 23) and colon cancer (24).
Our results are similar to the variations in favorable and unfavorable gene signatures within the same tumor reported in prior studies [1,3]. For example, our results show that positive prognostic (CAXII) and negative prognostic (CAIX) biomarkers are routinely observed in the same tumor but different regions. Importantly, however, we can clearly identify the Darwinian dynamics that produced this spatial variation and thus place this regional heterogeneity within an ecological and evolutionary context. This may have clinical implications because it supports the hypothesis that at least some intratumoral heterogeneity in the molecular properties of cancer cells can be predicted based on the local environmental selection forces, which can be defined by clinical imaging(25–27).
Our results suggest a number of important avenues for future investigation. Since clinical cancer imaging can depict spatial variations in perfusion, it should be possible to estimate some molecular variations based on imaging. In addition, it seems clear that some current prognostic and predictive molecular biomarkers that can be observed in different regions of the same tumor, such as CAIX and CAXII, can be accurately evaluated and reported only in a spatial context.
Acknowledgments
The authors would like to extend their most sincere thanks to all of those who discussed, reviewed and provided edits for this manuscript; especially Tamir Epstein and the Brown lab. We would like to thank the Moffitt Tissue Core and the Analytic Microscopy Core for their expertise. This work sponsored in part by the Moffitt Cancer Center PSOC, NIH/NCI U54CA143970.
Footnotes
Conflict of Interest: The authors declare no conflict of interest
References
- 1.Longo DL. Tumor heterogeneity and personalized medicine. N Engl J Med. 2012;366:956–7. doi: 10.1056/NEJMe1200656. [DOI] [PubMed] [Google Scholar]
- 2.Gerlinger M, Swanton C. How Darwinian models inform therapeutic failure initiated by clonal heterogeneity in cancer medicine. Br J Cancer. 2010;103:1139–43. doi: 10.1038/sj.bjc.6605912. [DOI] [PMC free article] [PubMed] [Google Scholar]
- 3.Sottoriva A, Spiteri I, Piccirillo SG, Touloumis A, Collins VP, Marioni JC, et al. Intratumor heterogeneity in human glioblastoma reflects cancer evolutionary dynamics. Proc Natl Acad Sci U S A. 2013;110:4009–14. doi: 10.1073/pnas.1219747110. [DOI] [PMC free article] [PubMed] [Google Scholar]
- 4.Yachida S, Jones S, Bozic I, Antal T, Leary R, Fu B, et al. Distant metastasis occurs late during the genetic evolution of pancreatic cancer. Nature. 2010;467:1114–7. doi: 10.1038/nature09515. [DOI] [PMC free article] [PubMed] [Google Scholar]
- 5.Greaves M, Maley CC. Clonal evolution in cancer. Nature. 2012;481:306–13. doi: 10.1038/nature10762. [DOI] [PMC free article] [PubMed] [Google Scholar]
- 6.Merlo LM, Pepper JW, Reid BJ, Maley CC. Cancer as an evolutionary and ecological process. Nat Rev Cancer. 2006;6:924–35. doi: 10.1038/nrc2013. [DOI] [PubMed] [Google Scholar]
- 7.Gatenby RA, Gillies RJ, Brown JS. Of cancer and cave fish. Nat Rev Cancer. 2011;11:237–8. doi: 10.1038/nrc3036. [DOI] [PMC free article] [PubMed] [Google Scholar]
- 8.Alfarouk KO, Ibrahim ME, Gatenby RA, Brown JS. Riparian ecosystems in human cancers. Evol Appl. 2013;6:46–53. doi: 10.1111/eva.12015. [DOI] [PMC free article] [PubMed] [Google Scholar]
- 9.Michelson S, Miller BE, Glicksman AS, Leith JT. Tumor micro-ecology and competitive interactions. J Theor Biol. 1987;128:233–46. doi: 10.1016/s0022-5193(87)80171-6. [DOI] [PubMed] [Google Scholar]
- 10.Aktipis CA, Boddy AM, Gatenby RA, Brown JS, Maley CC. Life history trade-offs in cancer evolution. Nat Rev Cancer. 2013;13:883–92. doi: 10.1038/nrc3606. [DOI] [PMC free article] [PubMed] [Google Scholar]
- 11.Gatenby RA, Cunningham JJ, Brown JS. Evolutionary triage governs fitness in driver and passenger mutations and suggests targeting never mutations. Nat Commun. 2014;5:5499. doi: 10.1038/ncomms6499. [DOI] [PMC free article] [PubMed] [Google Scholar]
- 12.Brown JS, Pavlovic NB. Evolution in heterogeneous environments: effecs of migration on habitat specialization. Evolutionary Ecology. 1992;6:360–82. [Google Scholar]
- 13.Morgan PE, Pastorekova S, Stuart-Tilley AK, Alper SL, Casey JR. Interactions of transmembrane carbonic anhydrase, CAIX, with bicarbonate transporters. Am J Physiol Cell Physiol. 2007;293:C738–48. doi: 10.1152/ajpcell.00157.2007. [DOI] [PubMed] [Google Scholar]
- 14.Potter CP, Harris AL. Diagnostic, prognostic and therapeutic implications of carbonic anhydrases in cancer. Br J Cancer. 2003;89:2–7. doi: 10.1038/sj.bjc.6600936. [DOI] [PMC free article] [PubMed] [Google Scholar]
- 15.Vincent TL, BJS . Evolutionary game theory, natural selection, and Darwinian dynamics. Cambridge, UK: Cambridge University Press; 2005. [Google Scholar]
- 16.Apaloo J, Brown JS, Vincent TL. Evolutionary game theory: ESS, convergence stability, and NIS. Evol Ecol Res. 2009;11:489–515. [Google Scholar]
- 17.Cohen YV, TL, Brown JS. A G-function approach to fitness minima, fitness maxima, evolutionarily stable strategies and adaptive landscapes. Evol Ecol Res. 1999;1:923–43. [Google Scholar]
- 18.Aktipis CA, Maley CC, Pepper JW. Dispersal evolution in neoplasms: the role of disregulated metabolism in the evolution of cell motility. Cancer Prev Res (Phila) 2012;5:266–75. doi: 10.1158/1940-6207.CAPR-11-0004. [DOI] [PMC free article] [PubMed] [Google Scholar]
- 19.Vigueira CC, Olsen KM, Caicedo AL. The red queen in the corn: agricultural weeds as models of rapid adaptive evolution. Heredity. 2013;110:303–11. doi: 10.1038/hdy.2012.104. [DOI] [PMC free article] [PubMed] [Google Scholar]
- 20.Brown GP, Shilton C, Phillips BL, Shine R. Invasion, stress, and spinal arthritis in cane toads. Proceedings of the National Academy of Sciences of the United States of America. 2007;104:17698–700. doi: 10.1073/pnas.0705057104. [DOI] [PMC free article] [PubMed] [Google Scholar]
- 21.Liebl AL, Martin LB. Living on the edge: range edge birds consume novel foods sooner than established ones. Behav Ecol. 2014;25:1089–96. [Google Scholar]
- 22.Mitsui H, Suarez-Farinas M, Gulati N, Shah KR, Cannizzaro MV, Coats I, et al. Gene expression profiling of the leading edge of cutaneous squamous cell carcinoma: IL-24-driven MMP-7. J Invest Dermatol. 2014;134:1418–27. doi: 10.1038/jid.2013.494. [DOI] [PMC free article] [PubMed] [Google Scholar]
- 23.Pourreyron C, Reilly L, Proby C, Panteleyev A, Fleming C, McLean K, et al. Wnt5a is strongly expressed at the leading edge in non-melanoma skin cancer, forming active gradients, while canonical Wnt signalling is repressed. PLoS One. 2012;7:e31827. doi: 10.1371/journal.pone.0031827. [DOI] [PMC free article] [PubMed] [Google Scholar]
- 24.Georgiou L, Minopoulos G, Lirantzopoulos N, Fiska-Demetriou A, Maltezos E, Sivridis E. Angiogenesis and p53 at the invading tumor edge: prognostic markers for colorectal cancer beyond stage. J Surg Res. 2006;131:118–23. doi: 10.1016/j.jss.2005.10.002. [DOI] [PubMed] [Google Scholar]
- 25.Gatenby RA, Grove O, Gillies RJ. Quantitative imaging in cancer evolution and ecology. Radiology. 2013;269:8–15. doi: 10.1148/radiol.13122697. [DOI] [PMC free article] [PubMed] [Google Scholar]
- 26.Zhou M, Hall L, Goldgof D, Russo R, Balagurunathan Y, Gillies R, et al. Radiologically defined ecological dynamics and clinical outcomes in glioblastoma multiforme: preliminary results. Transl Oncol. 2014;7:5–13. doi: 10.1593/tlo.13730. [DOI] [PMC free article] [PubMed] [Google Scholar]
- 27.Gill BJ, Pisapia DJ, Malone HR, Goldstein H, Lei L, Sonabend A, et al. MRI-localized biopsies reveal subtype-specific differences in molecular and cellular composition at the margins of glioblastoma. Proc Natl Acad Sci U S A. 2014;111:12550–5. doi: 10.1073/pnas.1405839111. [DOI] [PMC free article] [PubMed] [Google Scholar]