Abstract
Purpose
To optimize the production of hyperpolarized 13C-bicarbonate from the decarboxylation of hyperpolarized [1-13C]pyruvate and use it to image pH in the lungs and heart of rats with acute lung injury.
Methods
Two forms of catalysis are compared calorimetrically to maximize the reaction rate of decarboxylation and rapidly produce hyperpolarized bicarbonate from pyruvate while minimizing signal loss. Rats are injured using an acute lung injury model combining VILI and acid aspiration. Carbon images are obtained from both healthy (n=4) and injured (n=4) rats using a slice-selective CSI sequence with low flip angle. pH is calculated from the relative HCO3− and CO2 signals using the Henderson-Hasselbalch equation.
Results
It is demonstrated that base-catalysis is more effective than metal-ion catalysis for this decarboxylation reaction. Bicarbonate polarizations up to 17.2% are achieved using the base-catalyzed reaction. A mean pH difference between lung and heart of 0.14 pH units is measured in the acute lung injury model. A significant pH difference between injured and uninjured lungs is also observed.
Conclusions
It is demonstrated that hyperpolarized 13C-bicarbonate can be efficiently produced from the base-catalyzed decarboxylation of pyruvate. This method is used to obtain the first regional pH image of the lungs and heart of an animal.
Keywords: pH Mapping, Hyperpolarized 13Carbon, Lung Injury, Bicarbonate, Pyruvate
Introduction
Many pathological conditions that can occur in lung tissue are associated with changes in endogenous pH. It is well known that the microenvironment surrounding tumors is more acidic than similar healthy tissue [1]. Inflammation has also been shown to cause a local reduction in pH [2]. Abnormal tissue stretch, similar to that occurring in lung parenchyma during ventilator-induced lung injury (VILI), has been shown to cause acidification of extracellular space independent of inflammation [3]. Idiopathic Pulmonary Fibrosis (IPF) is a particularly interesting pH-related lung disorder that involves a feed forward loop in which depressed pH causes the activation of latent TGF-β, which increases lactic acid production, further lowering the pH and exacerbating fibrosis [4]. In order for lung tissue pH to be used as a diagnostic measurement, a translatable and noninvasive method to obtain regional pH information is needed.
The potential for diagnostically useful techniques is clear from the observed acidification of exhaled breath condensate (EBC) in inflammatory disease [5] However, because the condensate consists of a mixture of aerosolized particles from the airway walls and alveolar surface, diluted with condensed water vapor, correspondence to the pH of any specific cellular compartment is unclear [6,7]. Furthermore, the lack of regional discrimination limits both clinical utility and sensitivity.
Currently, there are no clinically available imaging tools to non-invasively measure regional pH. Several preclinical techniques have been investigated, including pH-sensitive fluorescent probes [8], MRI methods based on the chemical shift of protons [9] or phosphorus [10], pH-sensitive gadolinium agents [11] and chemical exchange saturation transfer [12]. A new, particularly promising technique makes use of hyperpolarized 13C-bicarbonate MRI. First demonstrated in 2008 by Gallagher et al. [13], the technique utilizes Dynamic Nuclear Polarization (DNP) to achieve 10,000-fold enhancement of the NMR signal in order to quantify the relative concentrations of bicarbonate and CO2. The regional pH can then be calculated using the Henderson-Hasselbalch equation, . The main impediments to clinical translation of this technique are the relatively low polarizations achievable with bicarbonate compared to pyruvate, and the poor solubility of biologically compatible bicarbonate salts. Improved solubility, and therefore hyperpolarized bicarbonate concentration, has been achieved using the cesium salt, but this raises toxicity concerns in translational studies.
These limitations were addressed independently by Ghosh et al. & Lee et al. [14,15]. In their modified version of hyperpolarized 13C-bicarbonate MRI, the hyperpolarized bicarbonate is produced by the decarboxylation of hyperpolarized pyruvate via hydrogen peroxide according to the following chemical equation:
It was demonstrated that the spin-order is conserved over the course of this reaction [14], so bicarbonate polarizations comparable to those achieved with pyruvate should be possible. Nonetheless, these modified polarization procedures have their drawbacks as well; Ghosh et al. use toxic concentrations of Ca2+ to catalyze the reaction, and Lee et al. use a toxic excess of hydrogen peroxide to make the reaction kinetics pseudo-first order.
In this paper, we demonstrate further improvement of the polarization procedure. We first use a calorimetric method to compare metal-ion catalysis with base catalysis to determine the best method for rapidly producing hyperpolarized bicarbonate through the decarboxylation of pyruvate. We then use the improved polarization procedure to obtain pH images of the lungs and heart of rats with an acute lung injury (ALI) model [16] that selectively creates inflammation, and therefore acidification, in the lungs of the subjects. The benefit of this model is that it provides sufficient contrast between the lung and heart/blood that a pH difference can be reliably observed. Furthermore, in observing this difference we verify that the hyperpolarized signal arising from lung tissue does not simply reflect the pH of vascular blood, but provides sensitivity to the local tissue pH. We demonstrate that this polarization method provides sufficient SNR to measure pH in the lungs, and we show that the lung pH is significantly lower than heart pH in the acute lung injury model. We also show that in a subject where one lung is injured while the other is non-injured, we measure a considerable difference in their respective pH. Finally, we demonstrate that significant CO2/bicarbonate polarization is lost in the lung due to exchange with the gas-phase in the alveolar space, and that this loss is reduced by compromised gas exchange in the disease model.
Methods
Kinetics
For exothermic reactions, calorimetric methods can be used to accurately estimate the kinetic rate constants [17–19]. Because pyruvate decarboxylation via hydrogen peroxide has a large enthalpy of reaction of −390 kJ/mol, a calorimetric method was used to compare the effects of metal-ion catalysis and base catalysis on the reaction rate. In each calorimetric trial, 1mL of 80mM pyruvate and 1 mL of 80mM H2O2 were mixed in a Pyrex tube enclosed in an insulated Styrofoam container. The temperature was continuously monitored using a Resistive Temperature Device (RTD) starting before and continuing until at least 200 seconds after the reaction was initiated. For the Ca2+-catalyzed trials, various concentrations between 0 and 60mM of calcium chloride hexahydrate were added to the pyruvate solution before the hydrogen peroxide was added to initiate the reaction. For the base-catalyzed trials, varying concentrations of NaOH were added to the pyruvate to reach target initial pH values between 7 and 11.
The temperature data from each trial was fitted to a mathematical model consisting of the coupled differential equations:
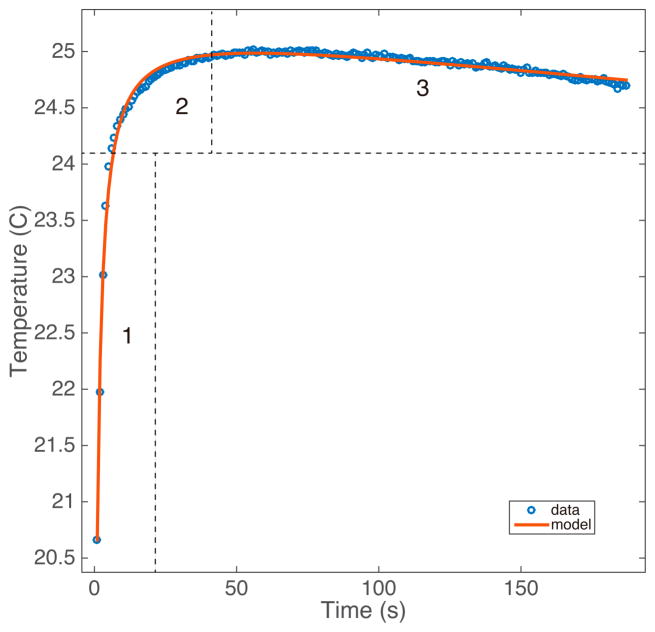
in which k is the second-order kinetic rate constant, is the conversion rate, and Tenv is the ambient temperature inside the insulated container. The fit was performed using a least squares approach with custom MATLAB software. An example of the fit is shown in figure 1.
Figure 1.
A representative dataset from the calorimetric kinetic experiments. The steepness of region 1 and curvature of region 2 are the main factors determining k, region 3 determines c2, which dictates the rate at which the temperature of the solution reaches thermal equilibrium.
Phantoms
Phantom experiments were performed in a 9.4T vertical magnet (Varian Inc., Palo Alto, CA) to measure the polarization level of each hyperpolarized species. 28.5mg of [1-13C]pyruvate was polarized for approximately one hour in a Hypersense DNP system (Oxford Instruments, Oxford, UK), then rapidly dissolved in 4mL of buffer solution containing 80mM NaOH, 40mM of pH 7.6 preset Trizma crystals (Sigma-Aldrich, St. Louis, MO), 3.4mM ethylenediaminetetraacetic acid (EDTA), and 50mM NaCl to produce 80mM of neutral, isotonic, hyperpolarized pyruvate solution. While the pyruvate was polarizing, A mixture of 80mM H2O2 and 42mM of NaOH was prepared, making the initial reaction pH 12.3. After dissolution, 2.5mL of the HP pyruvate solution was mixed with 2.5mL of the H2O2 / NaOH solution. The mixture was allowed to react for 8 seconds before being neutralized with HCl. A Pasteur pipette was used to transfer 1mL of the neutralized solution to a 5mm NMR tube that was quickly inserted into the magnet. The total time between dissolution and acquisition of the first spectrum was about 20 seconds.
Spectra were acquired with 20kHz bandwidth, 800ms acquisition time, 15° flip angle, and 1 second repetition time for 300 seconds. The spectra were analyzed using custom MATLAB software to determine bicarbonate polarization and the pH from each phantom. The phantom data reported is from one series of six individual phantoms where no obvious contamination was present.
Animal Studies
All in vivo experiments were carried out in accordance with protocols approved by the Institutional Animal Care and Use Committee of the University of Pennsylvania. Eight Sprague-Dawley rats (n=4 healthy, n=4 injured) of weight 400±100g were used in these experiments. The rats were raised in identical environments and fed identical diets. Animals were anesthetized by an intraperitoneal pentobarbital injection (40–60mg/kg) and kept anesthetized with 1/3 the original dose (15–20mg/kg) every 60–90 minutes. After intubation with a 2- inch long, 14-gauge angiocatheter (BD, Franklin Lakes, NJ), a sealant (UHU Tac adhesive putty; Saunders Mfg. Co., Readfield, ME) was placed around the glottis to prevent gas leakage. Animals were then connected to a custom built, MR compatible, small animal ventilator and placed in the bore of the magnet. An MR compatible pressure sensor was used to monitor the animals’ tracheal pressure throughout the study. Heart rate and oxygen saturation levels were monitored using an optical probe placed on the animals’ foot. The animals were maintained at 37° C by flowing warm air through the bore of the magnet, and temperature was monitored using a rectal probe.
The injured cohort’s lungs were injured in accordance with an acute lung injury model utilizing tracheal hydrochloric acid instillation and subsequent ventilator-induced lung injury [16]. The rats were ventilated with tidal volume of 12mL/kg and positive end-expiratory pressure (PEEP) of 3 cmH2O for t = 180 minutes. After 70 minutes, the rats were injured via a 2.0mL/kg tracheal instillation of pH 1.25 HCl. Carbon imaging was preformed during the late injury stages, when inflammation is expected to be severe [16]. One of the subjects in the injured cohort was selectively injured in the left lung only to compare injured and uninjured lungs with a single injection.
Hyperpolarized sample preparation
The hyperpolarized agent for the injured subjects was produced by polarizing 100.1mg of [1-13C]pyruvate (Cambridge Isotopes, Cambridge, MA) in a Hypersense DNP system. The HP pyruvate was dissolved in 4mL of dissolution buffer containing 280mM NaOH, 40mM of pH 7.6 preset Trizma crystals, 3.4mM EDTA, and <1mM phenol red to produce 4mL of 280mM neutral, isotonic, hyperpolarized pyruvate solution. While the pyruvate was being polarized, a 280mM H2O2 solution was prepared and raised to pH>12 by the addition of NaOH. This highly elevated pH ensures that the reaction will proceed rapidly until completion. For the healthy subjects, 28.6mg of [1-13C]pyruvate was polarized in the same system. The HP pyruvate was dissolved in 4mL of dissolution buffer containing 80mM NaOH, 40mM of pH 7.6 preset Trizma crystals, 3.4mM EDTA, and <1mM phenol red. For these subjects, 80mM H2O2 solution was used in place of the 280mM solution and the pH was raised the same amount as in the recipe for the injured subjects.
Immediately following dissolution, 2.5mL of the hyperpolarized pyruvate solution was mixed with 2.5mL of the high pH H2O2. The mixture was given 8 seconds to react and was then neutralized with HCl. The red color of the phenol red pH indicator present in the dissolution buffer ensures that the solution has been neutralized to a safe pH. 12mL/kg of the neutralized solution was withdrawn into a syringe and injected into the animal through a tail vein catheter. The entire process from dissolution to injection takes 30–40 seconds.
Imaging
All imaging experiments were performed with a dual-tuned 1H/13C quadrature transmit/receive birdcage coil (m2m) in a 4.7T horizontal magnet (Varian Inc.). Anatomical proton images were acquired after the HCl instillation using a multislice gradient-echo sequence (TR/TE = 80/1.5 ms, α = 20°) with a field of view of 70x70mm2 and 2-mm slice thickness over the region of lungs and heart.
The hyperpolarized carbon images of the animals’ lungs and heart were obtained using a slice-selective phase-encoded FID-CSI sequence with an outward spiral k-space trajectory. The 16x16 images had an in-plane FOV of 70x70 mm2 over a 30-mm axial slice to cover the entire lungs (TR/TE = 70/0.38ms, SW = 6.0kHz, α = 12°). For the injured subjects, the imaging sequence was initiated 15 seconds after the beginning of injection and required 17 seconds to complete. The images were acquired during two 10-second breath holds to minimize lung motion For the healthy subjects, the imaging sequence was further optimized and was initiated 8 seconds after the beginning of injection and required just 6 seconds to complete during a single breath hold. One injured subject was imaged using the updated imaging sequence and the lower concentration bicarbonate recipe to ensure that the different procedures had no significant effect on the pH measurements.
Data Analysis
All data was analyzed using custom MATLAB software. Polarization of the phantoms was calculated by comparing the hyperpolarized signal with the averaged thermal signal. The pH of each of the hyperpolarized phantoms was calculated using the Henderson-Hasselbalch equation, where the relevant pKa = 6.17, and metabolite signal is used in place of concentration.
For the in vivo experiments, spectroscopic images were obtained by applying a Fourier transform to the line-broadened FIDs. Global first-order and local zero-order phase corrections were applied to the spectra in each voxel followed by a 4th-order polynomial baseline correction. Lorentzian functions were then fit to each peak individually, and the total signal from each molecular species in each voxel was calculated from the integral under the peak fits. The pH of each voxel was calculated using the Henderson-Hasselbalch equation using the same procedure that was used for the phantoms. This application of the Henderson-Hasselbalch equation is appropriate because rapid, carbonic anhydrase-mediated exchange between CO2 and HCO3− assures that concentrations are proportional to their respective peak integrals [20]. pH maps were generating by interpolating the 16x16 pH array to 128x128 and applying a transparency filter based on the total carbon signal in each voxel. The resultant image was overlaid on an axial proton image of the injured subject. Heart and lung voxels were manually segmented based on the overlay of the carbon images on their respective anatomical proton images.
The effect of CO2 exchange was qualitatively assessed by comparing pyruvate to bicarbonate ratios in voxels covering the two ventricles of the heart. Because left ventricle blood has passed through the lung, relative loss of bicarbonate/CO2 signal in this chamber of the heart is indicative of gas-phase relaxation particular to that species.
Error Calculation
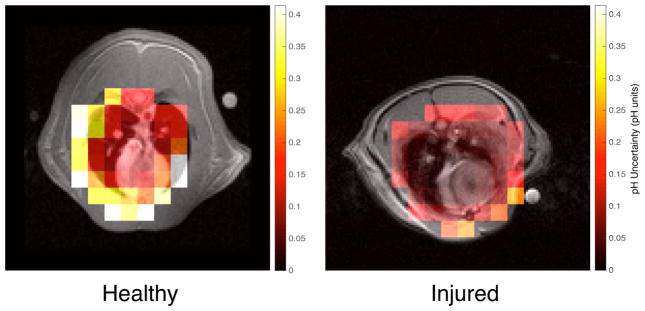
To estimate the uncertainty in pH on a voxel-by-voxel basis, the effect of SNR on the bicarbonate and CO2 signals was modeled. Random Gaussian noise with the same amplitude as was present in our experimental data was added to the Lorentzian fits of the peaks in each voxel and then re-fitted using the same methodology. The pH of each voxel was recalculated from the integrals under the new fits. The simulation was repeated 3,000 times to obtain the standard deviation in the pH of each voxel based on the uncertainties in measuring the bicarbonate and CO2 signals. pH uncertainty maps were obtained for one injured dataset and one healthy dataset.
Results
Reaction Kinetics Experiments
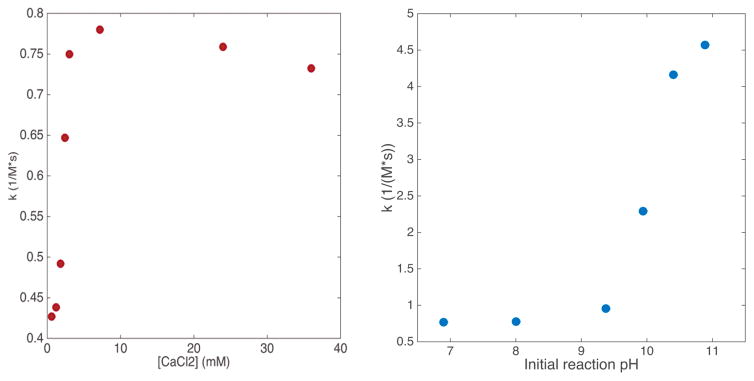
Calcium chloride was found to increase the second-order kinetic rate constant, k, of the decarboxylation of pyruvate by 80% at a concentration of 6.0mM (figure 2a). Increasing the concentration of CaCl2 beyond this point showed no further increase in the reaction rate.
Figure 2.
Figure 2a: Plot of initial second order rate constant, k, vs. CaCl2 concentration. Figure 2b: Plot of k vs initial reaction pH. >5x increase in k is achieved when initial pH > 10.5.
Calorimetric studies of base catalysis (figure 2b) demonstrated a rapid increase in k at initial pH values above 9.5. At an initial pH of 10.8, a maximum rate increase of 530% was observed. No further increase in k was observed at higher pH values. In addition, the pyruvate was subject to increasingly rapid dimerization under extremely alkaline conditions, introducing the potential for inaccurate decarboxylation rate measurement.
Phantom Experiments
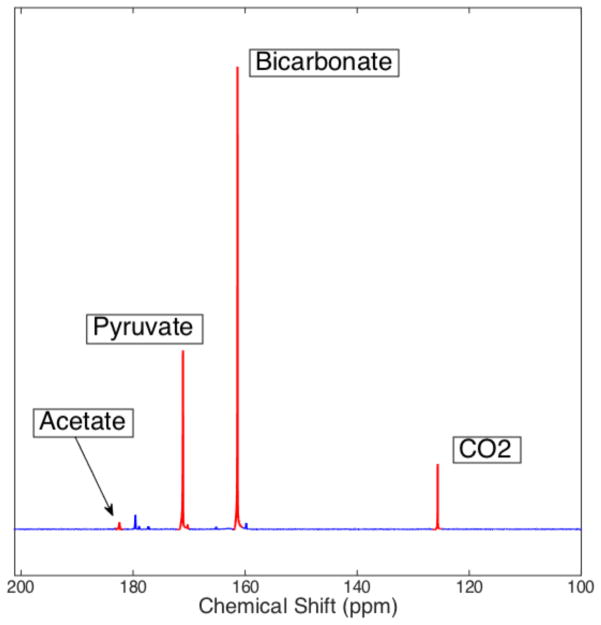
Bicarbonate polarizations up to 17.2% were achieved in phantoms using the base-catalyzed decarboxylation of pyruvate. The mean final pH value of all the phantoms was calculated to be 7.02 ± 0.41. The variation in pH is due to small differences in the amounts of NaOH and HCl used in the recipe, rather than uncertainty in the calculation method. Calculated pH values were constant within 0.1 pH units over the 300-second acquisition time, and were always within 0.1 pH units of the value measured after the NMR acquisition using a pH electrode. Average conversion, measured as the ratio between thermal bicarbonate + CO2 signal and total thermal signal, was found to be 84.3 ± 3.2%. A sample phantom spectrum is shown in figure 3.
Figure 3.
Spectrum obtained from a hyperpolarized pyruvate/bicarbonate phantom 36 seconds after dissolution. The actual conversion from pyruvate to bicarbonate/CO2 is significantly higher than it appears here as bicarbonate/CO2 have a shorter T1 than pyruvate/acetate and are therefore subject to additional attenuation. The calculated pH from the bicarbonate and CO2 peaks in this spectrum is 7.20 +/− 0.03. The relatively weak signal of [1-13C]acetate is explained by it being present at natural 13C abundance; the actual acetate concentration is equal to that of bicarbonate + CO2.
In Vivo Experiments
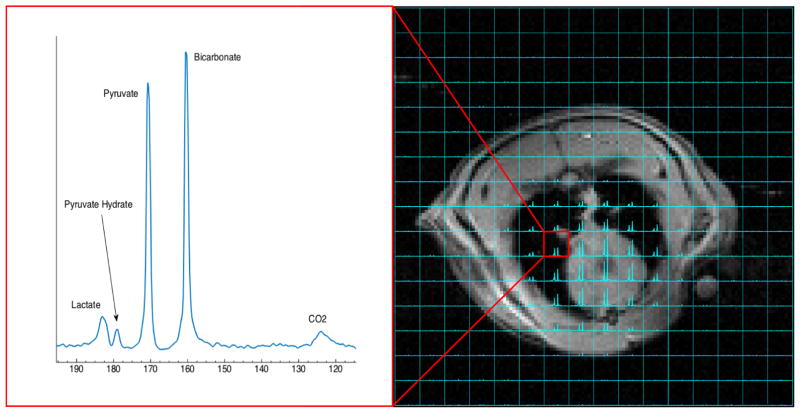
The recipe outlined in this paper results in a roughly 1:1 ratio of bicarbonate signal to pyruvate signal in vivo in the region covering the lungs and heart. This ratio is far lower than was observed in the phantom studies because the animal procedure takes longer than the phantom procedure and bicarbonate has a considerably shorter T1 than pyruvate. SNR of over 20 is observed in both the CO2 and lactate peaks in the majority of the voxels covering the lungs and heart, making the pH and lactate to pyruvate ratio easily quantifiable. The spectrum obtained from a sample voxel in the lungs is shown in figure 4.
Fig 4.
Overlay of 13C spectra on an axial proton image. A sample spectrum from a voxel in the lung is shown on the left. Pyruvate and bicarbonate are present in roughly a 1:1 ratio, and the CO2 and lactate peaks both have high enough SNR to be easily quantifiable. The pH in this voxel is 7.05 and the lactate to pyruvate ratio is 0.16.
The axial pH map from one subject is shown in figure 5. It is plainly apparent that the measured pH in the region covering the heart is more basic than the regions covering the lung parenchyma. This is consistent with the acute acid aspiration injury model used in these experiments, which selectively injures the lungs.
Fig 5.
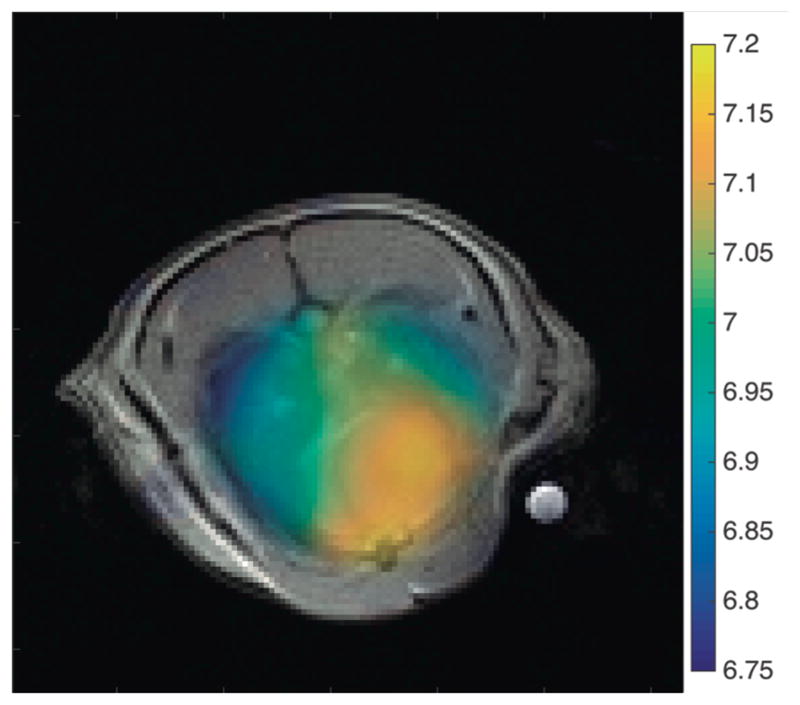
Fig 5a: pH map of rat heart and lungs overlaid on an axial proton image. 16x16 data interpolated to 128x128 image. The heart appears to be more basic than the injured lung parenchyma.
The measured pH values of lung and heart regions from injured subjects are shown in Table 2. The reported values are given as the mean pH in each organ +/− the standard deviation of the set of voxels in that organ. Each animal was observed to have a more acidic pH in the lungs than in the heart, although individual differences were not always statistically significant. The mean pH difference between heart and lungs is 0.14 ± 0.04.
Table 2.
Summary of measured pH values in lung and heart regions of injured subjects. Measured pH values in the heart were consistently more basic than in the lung. Subject 4 was imaged using the updated recipe and imaging sequence
| Subject | Lung pH | Heart pH | Difference |
|---|---|---|---|
| 1 | 6.96 ± 0.05 | 7.14 ± 0.04 | 0.18 |
| 2 | 7.09 ± 0.08 | 7.17 ± 0.09 | 0.08 |
| 3 | 7.05 ± 0.13 | 7.21 ± 0.10 | 0.16 |
| 4 | 7.05 ± 0.16 | 7.20 ± 0.08 | 0.15 |
| Averages | 7.04 | 7.18 | 0.14 |
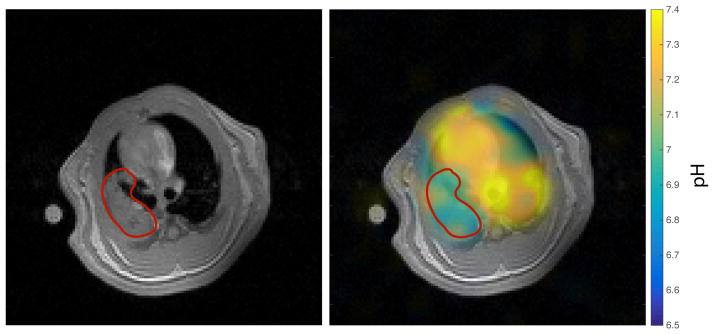
In the subject in which the left lung was selectively injured, a clear difference is observed between the pH of the left lung and that of the right lung and heart. The calculated pH of the left lung in this subject was 6.94 ± 0.09, the pH in the right lung was 7.14 ± 0.13, and the pH of the heart was 7.20 ± 0.08.
pH maps of the lungs of healthy subjects proved difficult to obtain due to the rapid CO2 exchange which occurs as blood passes through the lung parenchyma. Only one of four healthy subjects displayed any discernable CO2 signal; the pH map of this subject is shown in figure 7. The mean calculated pH in the region covering the lungs in this subject was 7.27 ± 0.10 and the mean calculated pH in the heart was 7.49 ± 0.13.
Figure 7.
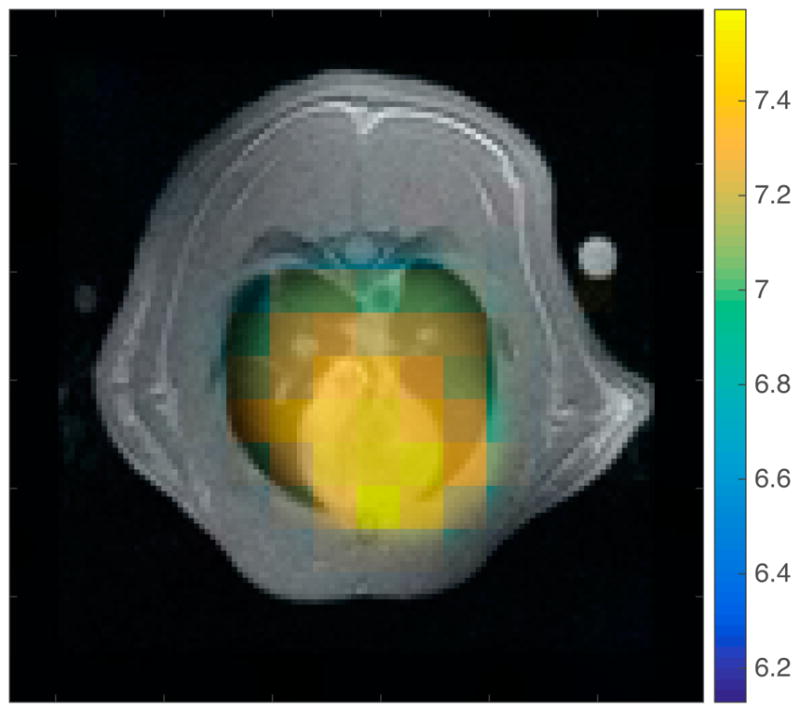
pH map overlaid on axial proton image for the one healthy subject in which a CO2 resonance was observed in the lungs. The calculated pH is higher overall than in the injured subjects, and no obvious difference is seen in the pH of heart and lung tissue.
As can be seen from the box plot in figure 8, the pyruvate to bicarbonate ratio in the left ventricle of healthy subjects is significantly higher than in the right ventricle, indicating that most of the bicarbonate/CO2 signal has been lost due to gas exchange. No such effect is seen in the injured lungs.
Figure 8.
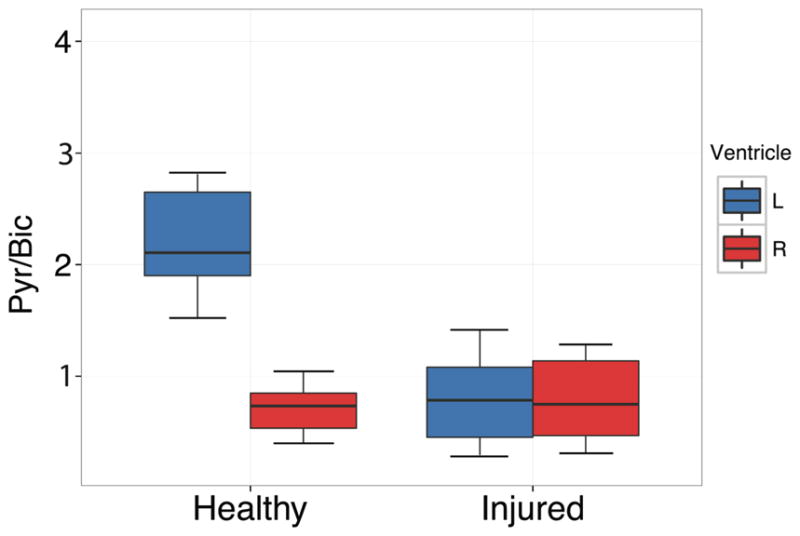
A comparison of the pyruvate signal to bicarbonate signal ratio in the left and right ventricles of the heart in both healthy and injured lungs. The significantly higher ratio in the healthy subjects indicates that a majority of the bicarbonate/CO2 is lost to gas exchange.
Error Calculation
The results of the pH error simulation for both an injured subject and a healthy subject are shown in figure 9. The mean uncertainty in the voxels that contain only lung tissue, heart, and vasculature was 0.023 ± 0.008 in the injured subject, and 0.183 ± 0.106 in the healthy subject, with uncertainty increasing as SNR decreases, as expected.
Fig 9.
Fig 9a: Calculated pH uncertainty map for an injured subject overlaid on its axial proton image. Based on SNR alone, the uncertainty in every voxel in the region containing lung and heart was well below 0.1 pH units. Fig 9b: Calculated pH uncertainty map for a healthy subject overlaid on its axial proton image. The SNR-based uncertainty in each voxel is significantly higher than in its injured counterpart.
Discussion
This study provides the first reported in vivo pH map obtained from the lungs of an animal. The key findings are the development of a polarization scheme that allows for high bicarbonate polarizations, simultaneous measurement of pH and pyruvate metabolism, and the avoidance of toxic cesium, calcium, or extreme excesses of H2O2 used in other schemes. These improvements allow us to safely obtain sufficient 13C MR signal to quantify the amount of pyruvate, bicarbonate, CO2, and lactate present in the acutely injured lungs and heart of a rat following the injection of our hyperpolarized substrates.
The crucial difference between our method of utilizing the decarboxylation of pyruvate by H2O2 to produce hyperpolarized bicarbonate and those previously described is the use of base catalysis rather than Ca2+ catalysis or excess H2O2 in order to achieve pseudo-first order kinetics. Until recently, there were no adequate theories explaining the mechanism of base catalysis in this decarboxylation reaction. Lopalco et al. suggest that it may proceed through a nucleophilic attack of HOO− on the α-carbonyl group resulting in a hydroperoxide adduct reaction intermediate. The presence of this reaction intermediate was confirmed with low temperature NMR studies by Asmus et al. [21], although the conditions of this experiment are different enough that the reaction mechanism may not be identical.
The maximum bicarbonate polarizations achieved in these studies are in the same range as those achieved through the direct polarization of Cs-bicarbonate (16% [13] and 19% [2] have been reported), and significantly higher than those achieved by the calcium-catalyzed decarboxylation of pyruvate (10% [14]), or the decarboxylation of pyruvate with excess H2O2 (5% [15]). A major deficiency of all chemical reaction based polarization schemes is the additional time needed for the reaction to occur before imaging. Therefore, the transit time from polarizer to magnet is longer for our method than for the Cs-bicarbonate polarization schemes, so the polarization remaining at the time of imaging will be significantly reduced due to T1 relaxation.
Although no cesium or calcium is used in our method, there is still the possibility of toxicity from excessively high or low pH of the hyperpolarized solution, or from the presence of unreacted peroxide. Based on the results of our phantom studies, the variation in pH of our injected solution is minimal, making difficulties related to pH very unlikely. As an additional precaution, phenol red pH indicator is present in the dissolution buffer. The solution will only be injected if it appears red, indicating a pH between 6.8 and 8.2. The reported LD50 of intravenous hydrogen peroxide is 21 mg/kg [22]. Assuming that the decarboxylation reaction goes to 84% completion as measured in the phantom experiments, the solution would contain approximately 90 μmol of unreacted hydrogen peroxide, corresponding to 7.65 mg/kg in a 400g rat. This concentration of hydrogen peroxide is potentially harmful to the animal but is unlikely to be fatal. . If necessary, left over peroxide could easily be removed using an excess of pyruvate, or by adding sulfite to the solution [23].
A major limitation of all hyperpolarized bicarbonate based pH imaging techniques is the solubility limit of bicarbonate/CO2. The maximum solubility of bicarbonate in water is ~1M, and for CO2 it is approximately 35mM. At pH 7.0, bicarbonate and CO2 equilibrate at a ratio of ~7:1 according to the Henderson-Hasselbalch equation. Therefore the maximum concentration of bicarbonate that could be produced at neutral pH without significant loss of labeled compound due to effervescence of CO2 is 245mM. However, even at concentrations near this limit, significant bubbling may occur during neutralization because the instantaneous local pH near the HCl droplet immediately after it is added will be much lower than 7.0, causing the local CO2 concentration to surpass its solubility limit. To avoid these issues, the maximum pyruvate concentration used in our reactions is 280mM. Assuming 84% conversion through decarboxylation as measured from our phantom experiments, we calculate that 119 ± 3.8mM of bicarbonate/CO2 is produced, resulting in 17mM CO2 dissolved in solution after neutralization, which is safely below the solubility limit.
Although some inconsistency in published values exists, and different measurement techniques are almost certainly sensitive to different fluid compartments in both the heart and lungs, the pH values reported here are largely consistent with those previously reported. In the heart, the majority of the signal in these studies arises from blood inside the chambers. The heart contains both oxygenated and deoxygenated blood which have a pH of 7.40 and 7.37 respectively [24]. The remaining signal in the heart comes from cardiac muscle in the heart wall, where the intracellular pH has been reported to be 7.06 ± 0.02 [25]. In previous studies done by our group using the same acute lung injury model used in this study, we measured reductions in arterial pH of 0.10 pH units. The mean heart pH of 7.17 that we measure is therefore within the expected range when one considers that the signal is coming partially from the relatively acidic cardiac muscle, and that the blood pH is likely reduced to approximately 7.27–7.30 based on our previous observations of rats with the same lung injury model.
pH is poorly understood in both healthy and diseased lungs. A number of studies have been performed on a variety of animal models to investigate the pH of the different components of lung tissue. One study measured the alveolar fluid pH of rabbits using microelectrodes and reported a value of 6.92 [26]. In another study, nicotine concentration was used as a pH indicator to measure the pH in the lung extravascular space and a value of 6.69 was reported [27]. A third study measured the cytosolic pH of microvascular epithelial cells and found it to be 6.92 [28]. Yet another study summarizes the results of numerous papers in which the pH of alveolar epithelial cells was investigated and values ranging from 7.07 to 7.50 were reported [29]. The relatively acidic value of 7.04 for injured lungs reported here is therefore entirely plausible, although improved methods are needed to non-invasively obtain global lung pH. The results of our error simulations indicate that the pH uncertainty in injured lungs due to noise is not likely to cause significant error in our calculations.
It is important to note that the measurements in this study are unable to distinguish between intracellular and extracellular pH due to the rapid diffusion of CO2 across cell membranes. For this reason, we do not expect a significant alteration of pH measurements due to uptake of the coadministered pyruvate. Although the sudden increase in monocarboxylate transport lowers the intracellular pH because of the cotransport of a proton, there is no net change in pH in the region being imaged. The accuracy of the measurement does, however, depend on the presence of carbonic anhydrase in all compartments being imaged to ensure rapid equilibration of bicarbonate and CO2. Carbonic anhydrase is heterogeneously distributed throughout the lungs, with the enzyme being found in the cytoplasm, mitochondria, and endothelial membranes of the cells in the lungs [28]. Although its concentration in lung tissue is just 1% of that found in blood, it is still more than enough to maintain equilibrium of bicarbonate and CO2 during the blood transit through the lung [29].
Clinical patients’ airway acidity is often measured through exhaled breath condensate (EBC) measurements. The mean reported value for healthy subjects is 7.70 ± 0.49 [5], which is significantly higher than the pH measured by the more direct methods mentioned above. A study comparing airway pH in subjects with COPD and healthy subjects using EBC found that COPD subjects had a mean airway pH of 7.16 versus 7.57 in healthy subjects [6]. Researchers have called into question the reliability of using EBC to measure pulmonary pH for two main reasons: (1) the pH of EBC is significantly affected by the degree of oxidative stress, and airway acidification is strongly correlated with the underlying inflammatory process [6], and (2) it was found that there was significant contamination of the condensate from volatile salivary acids and bases [30]. All of these facts make it difficult to provide a thorough comparison of the lung pH we measure with previously published results.
The pH of healthy lungs proved extremely difficult to quantify due to the rapid exchange of CO2 that occurs in well-ventilated lungs. This was measured by comparing the pyruvate/bicarbonate ratio in the right and left ventricles. As the blood passes through the healthy lungs from the right to left ventricle, CO2 diffuses out of the blood and into the airspaces where the hyperpolarized signal rapidly decays due to the extremely short T1 of gas-phase CO2 [31]. This causes a significant reduction in the bicarbonate signal due to the rapid carbonic anhydrase mediated exchange between bicarbonate and CO2. Pyruvate is not subject to this process, leading to an increased pyruvate/bicarbonate ratio in the left ventricle relative to the right ventricle. This in turn can be used as an indirect indicator of the quality of CO2 exchange in the lung and may have important implications for future HP bicarbonate-based pH imaging experiments; any bicarbonate injections that pass through healthy lungs before reaching the target organ are subject to substantial signal loss. Therefore arterial injections should be favored wherever possible. The fact that there is no significant change in the pyruvate/bicarbonate ratio between the two ventricles in the injured subjects indicates that the level of lung injury is severe, and there is likely significant edema in the lung parenchyma, which is preventing efficient gas exchange. This allows CO2 to become trapped in the injured lung tissue, and allows better measurement of the pH in these subjects. The large differences in bicarbonate and CO2 signal available for imaging in the lungs of injured and healthy subjects is reflected in the results of our error simulations shown in figure 9. Because there is significantly lower bicarbonate/CO2 SNR in the healthy lungs, the uncertainty is far higher.
The fact that we were able to measure the pH of the uninjured lung from the selectively injured subject shown in figure 7 would seem to contradict the information above. However, it has been shown that pulmonary blood flow increases significantly following acute lung injury [32], and in hyperpolarized pyruvate experiments performed by our group (data not shown) significantly increased pyruvate signal in uninjured regions of the lung was observed following acute injury to other parts of the lung. Given these observations, we believe that significantly higher hyperpolarized signal should be present in all regions of the lungs despite the injury being heterogeneously distributed.
Future studies should focus on obtaining pH maps of healthy lungs to determine the baseline pH of lung parenchyma. In order to obtain sufficient SNR to quantify the pH in healthy lungs, chemical-shift selective imaging sequences may be required. More advanced imaging methods such as diffusion imaging or chemical exchange saturation transfer may be useful in determining what proportion of signal is coming from intracellular vs. extracellular compartments. Lung cancer and IPF models should then be explored with pH imaging to better quantify the metabolic changes that may precede structural changes in these diseases.
Conclusions
We have obtained the first pH map of lungs in vivo. This was achieved using a modified polarization scheme whereby hyperpolarized bicarbonate is produced through the base-catalyzed decarboxylation of pyruvate by H2O2. We show that our pH mapping method is sensitive to pH differences on the order of 0.10 pH units by showing the pH difference between heart and lung, as well as the pH difference between injured and uninjured lung tissue in an acute lung injury model. We have also demonstrated that future pH imaging experiments using hyperpolarized bicarbonate should keep in mind the considerable loss of bicarbonate/CO2 signal that occurs when the HP solution passes through the lungs.
Figure 6.
Figure 6a: Axial proton image of one subject where the injury was localized to the left lung, the injured region is outlined in red. Figure 6b: The interpolated pH map obtained from this subject overlaid on the axial proton image. The pH is lower in the injured region than in the heart or the uninjured lung.
References
- 1.Tannock IF, Rotin D. Acid pH in Tumors and Its Potential for Therapeutic Exploitation. Cancer Res. 1989 Aug;49(16):4373–4384. [PubMed] [Google Scholar]
- 2.Scholz DJ, Janich MA, Köllisch U, Schulte RF, Ardenkjaer-Larsen JH, Frank A, Haase A, Schwaiger M, Menzel MI. Quantified pH imaging with hyperpolarized 13C-bicarbonate. Magn Reson Med. 2015 Jun;73(6):2274–2282. doi: 10.1002/mrm.25357. [DOI] [PubMed] [Google Scholar]
- 3.Pugin J, Dunn-Siegrist I, Dufour J, Tissières P, Charles PE, Comte R. Cyclic Stretch of Human Lung Cells Induces an Acidification and Promotes Bacterial Growth. Am J Respir Cell Mol Biol. 2008 Mar;38(3):362–370. doi: 10.1165/rcmb.2007-0114OC. [DOI] [PubMed] [Google Scholar]
- 4.Kottmann RM, Kulkarni AA, Smolnycki KA, Lyda E, Dahanayake T, Salibi R, Honnons S, Jones C, Isern NG, Hu JZ, Nathan SD, Grant G, Phipps RP, Sime PJ. Lactic Acid Is Elevated in Idiopathic Pulmonary Fibrosis and Induces Myofibroblast Differentiation via pH-Dependent Activation of Transforming Growth Factor-β. Am J Respir Crit Care Med. 2012 Oct;186(8):740–751. doi: 10.1164/rccm.201201-0084OC. [DOI] [PMC free article] [PubMed] [Google Scholar]
- 5.Vaughan J, Ngamtrakulpanit L, Pajewski TN, Turner R, Nguyen TA, Smith A, Urban P, Hom S, Gaston B, Hunt J. Exhaled breath condensate pH is a robust and reproducible assay of airway acidity. Eur Respir J. 2003 Dec;22(6):889–894. doi: 10.1183/09031936.03.00038803. [DOI] [PubMed] [Google Scholar]
- 6.Kostikas K, Papatheodorou G, Ganas K, Psathakis K, Panagou P, Loukides S. pH in Expired Breath Condensate of Patients with Inflammatory Airway Diseases. Am J Respir Crit Care Med. 2002 May;165(10):1364–1370. doi: 10.1164/rccm.200111-068OC. [DOI] [PubMed] [Google Scholar]
- 7.Effros RM, Dunning MB, Biller J, Shaker R. The promise and perils of exhaled breath condensates. Am J Physiol - Lung Cell Mol Physiol. 2004 Dec;287(6):L1073–L1080. doi: 10.1152/ajplung.00069.2004. [DOI] [PubMed] [Google Scholar]
- 8.Mordon S, Devoisselle JM, Maunoury V. In vivo pH MEASUREMENT AND IMAGING OF TUMOR TISSUE USING A pH-SENSITIVE FLUORESCENT PROBE (5,6–CARBOXYFLUORESCEIN): INSTRUMENTAL AND EXPERIMENTAL STUDIES. Photochem Photobiol. 1994 Sep;60(3):274–279. doi: 10.1111/j.1751-1097.1994.tb05104.x. [DOI] [PubMed] [Google Scholar]
- 9.Vermathen P, Capizzano AA, Maudsley AA. Administration and 1H MRS detection of histidine in human brain: Application to in vivo pH measurement. Magn Reson Med. 2000 May;43(5):665–675. doi: 10.1002/(sici)1522-2594(200005)43:5<665::aid-mrm8>3.0.co;2-3. [DOI] [PubMed] [Google Scholar]
- 10.Moon RB, Richards JH. Determination of Intracellular pH by 31P Magnetic Resonance. J Biol Chem. 1973 Oct;248(20):7276–7278. [PubMed] [Google Scholar]
- 11.Zhang S, Wu K, Sherry AD. A novel pH-sensitive MRI contrast agent. Angew Chem Int Ed. 1999;38(21):3192–3194. [PubMed] [Google Scholar]
- 12.Sheth VR, Liu G, Li Y, Pagel MD. Improved pH measurements with a single PARACEST MRI contrast agent. Contrast Media Mol Imaging. 2012 Jan;7(1):26–34. doi: 10.1002/cmmi.460. [DOI] [PMC free article] [PubMed] [Google Scholar]
- 13.Gallagher FA, Kettunen MI, Day SE, Hu D-E, Ardenkjær-Larsen JH, in ‘t Zandt R, Jensen PR, Karlsson M, Golman K, Lerche MH, Brindle KM. Magnetic resonance imaging of pH in vivo using hyperpolarized 13C-labelled bicarbonate. Nature. 2008 Jun;453(7197):940–943. doi: 10.1038/nature07017. [DOI] [PubMed] [Google Scholar]
- 14.Ghosh RK, Kadlecek SJ, Pourfathi M, Rizi RR. Efficient production of hyperpolarized bicarbonate by chemical reaction on a DNP precursor to measure pH. Magn Reson Med. 2015 Nov;74(5):1406–1413. doi: 10.1002/mrm.25530. [DOI] [PubMed] [Google Scholar]
- 15.Lee Y, Zacharias NM, Piwnica-Worms D, Bhattacharya PK. Chemical reaction-induced multi-molecular polarization (CRIMP) Chem Commun. 2014;50(86):13030–13033. doi: 10.1039/c4cc06199c. [DOI] [PMC free article] [PubMed] [Google Scholar]
- 16.Cereda M, Xin Y, Meeder N, Zeng J, Jiang Y, Hamedani H, Profka H, Kadlecek S, Clapp J, Deshpande CG, Wu J, Gee JC, Kavanagh BP, Rizi RR. Visualizing the Propagation of Acute Lung Injury. Anesthesiology. 2016 Jan;124(1):121–131. doi: 10.1097/ALN.0000000000000916. [DOI] [PMC free article] [PubMed] [Google Scholar]
- 17.Glasser D, Williams DF. The Study of Liquid-Phase Kinetics Using Temperature as a Measured Variable. Ind Eng Chem Fundam. 1971 Aug;10(3):516–519. [Google Scholar]
- 18.Ferretti AC, Mathew JS, Blackmond DG. Reaction Calorimetry as a Tool for Understanding Reaction Mechanisms: Application to Pd-Catalyzed Reactions. Ind Eng Chem Res. 2007 Dec;46(25):8584–8589. [Google Scholar]
- 19.Blackmond DG, Rosner T, Pfaltz A. Comprehensive Kinetic Screening of Catalysts Using Reaction Calorimetry. Org Process Res Dev. 1999 Jul;3(4):275–280. [Google Scholar]
- 20.Schroeder MA, Swietach P, Atherton HJ, Gallagher FA, Lee P, Radda GK, Clarke K, Tyler DJ. Measuring intracellular pH in the heart using hyperpolarized carbon dioxide and bicarbonate: a 13C and 31P magnetic resonance spectroscopy study. Cardiovasc Res. 2010 Apr;86(1):82–91. doi: 10.1093/cvr/cvp396. [DOI] [PMC free article] [PubMed] [Google Scholar]
- 21.Asmus C, Mozziconacci O, Schöneich C. Low-Temperature NMR Characterization of Reaction of Sodium Pyruvate with Hydrogen Peroxide. J Phys Chem A. 2015 Feb;119(6):966–977. doi: 10.1021/jp511831b. [DOI] [PMC free article] [PubMed] [Google Scholar]
- 22.World Health Organization International Agency for Research on Cancer. IARC Monographs on the Evaluation of the Carcinogenic Risk of Chemicals to Humans. Lyon, France: WHO; 1985. [Google Scholar]
- 23.Hoffmann MR, Edwards JO. Kinetics of the oxidation of sulfite by hydrogen peroxide in acidic solution. J Phys Chem. 1975 Sep;79(20):2096–2098. [Google Scholar]
- 24.Lumb AB. Nunn’s Applied Respiratory Physiology. 6. Elsevier Limited; 2005. [Google Scholar]
- 25.Whalley DW, Hemsworth PD, Rasmussen HH. Regulation of intracellular pH in cardiac muscle during cell shrinkage and swelling in anisosmolar solutions. Am J Physiol - Heart Circ Physiol. 1994 Feb;266(2):H658–H669. doi: 10.1152/ajpheart.1994.266.2.H658. [DOI] [PubMed] [Google Scholar]
- 26.Nielson DW, Goerke J, Clements JA. Alveolar subphase pH in the lungs of anesthetized rabbits. Proc Natl Acad Sci. 1981 Nov;78(11):7119–7123. doi: 10.1073/pnas.78.11.7119. [DOI] [PMC free article] [PubMed] [Google Scholar]
- 27.Effros RM, Chinard FP. The in vivo pH of the extravascular space of the lung. J Clin Invest. 1969 Nov;48(11):1983–1996. doi: 10.1172/JCI106164. [DOI] [PMC free article] [PubMed] [Google Scholar]
- 28.Rojas JD, Sennoune SR, Maiti D, Bakunts K, Reuveni M, Sanka SC, Martinez GM, Seftor EA, Meininger CJ, Wu G, Wesson DE, Hendrix MJC, Martínez-Zaguilán R. Vacuolar-type H+-ATPases at the plasma membrane regulate pH and cell migration in microvascular endothelial cells. Am J Physiol - Heart Circ Physiol. 2006 Sep;291(3):H1147–H1157. doi: 10.1152/ajpheart.00166.2006. [DOI] [PubMed] [Google Scholar]
- 29.Lubman RL, Crandall ED. Regulation of intracellular pH in alveolar epithelial cells. Am J Physiol - Lung Cell Mol Physiol. 1992 Jan;262(1):L1–L14. doi: 10.1152/ajplung.1992.262.1.L1. [DOI] [PubMed] [Google Scholar]
- 30.Effros RM, Casaburi R, Su J, Dunning M, Torday J, Biller J, Shaker R. The Effects of Volatile Salivary Acids and Bases on Exhaled Breath Condensate pH. Am J Respir Crit Care Med. 2006 Feb;173(4):386–392. doi: 10.1164/rccm.200507-1059OC. [DOI] [PMC free article] [PubMed] [Google Scholar]
- 31.Jameson CJ, Jameson AK, Smith NC, Jackowski K. Cross sections for transfer of rotational angular momentum in CO2 from 13C spin relaxation studies in the gas phase. J Chem Phys. 1987 Mar;86(5):2717–2722. [Google Scholar]
- 32.Richter T, Bergmann R, Knels L, Hofheinz F, Kasper M, Deile M, Pietzsch J, Ragaller M, Koch T. Pulmonary Blood Flow Increases in Damaged Regions Directly after Acid Aspiration in Rats. Anesthesiology. 2013 Oct;119(4):890–900. doi: 10.1097/ALN.0b013e3182a17e5b. [DOI] [PubMed] [Google Scholar]


