

Summary
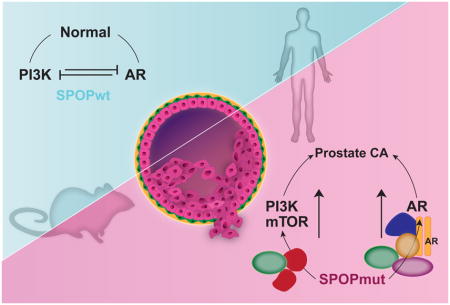
Recurrent point mutations in SPOP define a distinct molecular subclass of prostate cancer. Here, we describe a mouse model showing that mutant SPOP drives prostate tumorigenesis in vivo. Conditional expression of mutant SPOP in the prostate dramatically altered phenotypes in the setting of Pten loss, with early neoplastic lesions (high-grade prostatic intraepithelial neoplasia) with striking nuclear atypia, and invasive poorly differentiated carcinoma. In mouse prostate organoids, mutant SPOP drove increased proliferation and a transcriptional signature consistent with human prostate cancer. Using these models and human prostate cancer samples, we show that SPOP mutation activates both PI3K/mTOR and androgen receptor (AR) signaling, effectively uncoupling the normal negative feedback between these two pathways.
eTOC Blurb
Blattner et al. develop a mouse model and use it to demonstrate that human SPOP mutation can drive prostate tumorigenesis through coordinate deregulation of both PI3K/mTOR and AR pathways. The study provides insights to both unique and common features of molecular subtypes of human prostate cancer.
Introduction
Recurrent missense mutations in SPOP are the most common point mutations in primary prostate cancer, occurring in about 10% of both clinically localized and metastatic disease (Barbieri et al., 2012; Berger et al., 2011; Blattner et al., 2014; Cancer Genome Atlas Research, 2015; Robinson et al., 2015). SPOP mutations define a distinct and key molecular class of prostate cancer, with characteristic genomic alterations, patterns of genomic rearrangements, gene expression profiles and methylation patterns (Barbieri et al., 2012; Blattner et al., 2014; Boysen et al., 2015; Cancer Genome Atlas Research, 2015). SPOP mutations occur early in the natural history of prostate cancer solely as heterozygous missense mutations with dominant negative, selective loss of function towards the remaining wild-type allele (Baca et al., 2013; Boysen et al., 2015; Prandi et al., 2014; Theurillat et al., 2014). To date, no models have established the role of SPOP mutation as a driver of prostate neoplasia in vivo, and studies exploring the downstream effects of SPOP mutations have largely relied on overexpression of mutant SPOP protein in cell lines with alterations outside the genetic context of SPOP mutant prostate cancer (Geng et al., 2013; Geng et al., 2014; González-Billalabeitia et al., 2014; Pierce et al., 2015; Theurillat et al., 2014). Here, we report development of a conditional mouse model to define the role of SPOP mutation as a driver of prostate tumorigenesis in vivo.
Results
SPOP mutation drives prostate neoplasia in vivo in combination with Pten loss
To determine the impact of SPOP mutation in the prostate, we developed a transgenic mouse with prostate-specific conditional expression of SPOP-F133V, a common missense mutation found in human prostate cancer (Figure 1) (Barbieri et al., 2012; Berger et al., 2011; Cancer Genome Atlas Research, 2015). Specifically, we utilized a lox-STOP-lox strategy with the human SPOP-F133V transgene knocked into the Rosa26 locus (hereafter R26F133V) (Figures 1A, S1A and S1B). These mice were crossed with PbCre4 mice to express mutant SPOP specifically in the prostate. Immunohistochemistry (IHC) against IRES-linked eGFP confirmed consistent expression of the transgene in the ventral, dorsolateral and anterior lobes of the prostate with Cre expression (Figures S1C and S1D), and cell lines derived from these prostates confirmed physiological levels of SPOP-F133V protein expression compared to endogenous Spop protein (Figure S1C). We observed minimal alterations in prostate glandular architecture and histology due to SPOP-F133V expression (Figure S1D), no differences in proliferation as measured by Ki67 expression, and no differences in overall androgen receptor (AR) expression based on IHC (Figure S1E). However, rare areas in the SPOP mutant prostate showed outlier levels of AR expression (Figure 1B and S1F), and rare cells showed cytologic atypia with enlarged nuclei (Figure 1B and S1G) in a majority of mice ≥12 months (3 of 5 examined). These findings were absent in age-matched control mice. These data suggest that SPOP mutation may affect specific cytologic phenotypes, but like many other known alterations in human prostate cancer (e.g., ERG, ETV1, TP53), alone it is insufficient to drive tumorigenesis in the mouse prostate, at least in the specific genetic context of this model.
Figure 1. SPOP mutation induces a distinct phenotype of early HGPIN with nuclear atypia in PtenL/+ mice.

(A) Schematic of conditional SPOP-F133V construct in the Rosa26 (R26) locus (top) and of the expressed targeted transgenic transcript after Cre expression driven by probasin (Pb) promoter (bottom).
(B) Left graph: Percentage of cells per gland with high AR expression across all lobes. Each point indicates one gland. Right graph: Nuclear size of the 20 largest nuclei on H&E section of WT mice (control) (n=3) and PbCre;R26F133V (SPOPmut) mice (n=4) at 12 months of age. H&E shows representative nuclei of SPOPmut and control mice. (Scale Bar = 50μM).
(C–H): control = PbCre;PtenL/+ and SPOPmut = PbCre;PtenL/+;R26F133V.
(C) Percentage of PtenL/+ control and PtenL/+;R26F133V mice, with HGPIN at 3,6 and 12 month of age. Number on top indicates HGPIN-positive/total number of mice.
(D) Percentage of PtenL/+ control and PtenL/+;R26F133V mice showing moderate or strong nuclear atypia at 3, 6 and 12 months of age. Number on top of bar indicates mice with atypia/total number of mice.
(E) H&E, p-AKT and AR IHC of representative glands of 6 month old CreNeg (WT), PtenL/+ control and PtenL/+;R26F133V mice (Scale Bar = 50μM).
(F–G) Percentage of cells per gland with positive Ki67 staining (F) and AR staining (G) divided into glands with histologically normal and HG-PIN phenotype.
(H) Examples of HG-PIN in PtenL/+ (Control) and PtenL/+;R26F133V (SPOPmut) mice at 6 Month and 12 Month of age. (Scale bar: 50 μM).
(I) H&E of PtenL/+;R26F133V mouse with invasive cancer. (Scale bar: 50 μM).
See also Figure S1.
PTEN is a key tumor suppressor in prostate cancer. Conditional heterozygous Pten loss (PtenL/+) in the mouse prostate has been reported to show minimal histologic phenotype (Trotman et al., 2003; Wang et al., 2003). To determine if SPOP mutation accelerated or alters prostate phenotypes in other genetic backgrounds, we generated mice expressing mutant SPOP in a conditional Pten heterozygous background (PbCre; PtenL/+; R26F133V). In the PtenL/+ setting, mice expressing mutant SPOP displayed a highly penetrant phenotype with focal areas of high-grade prostatic intraepithelial neoplasia (HG-PIN) by 6 months of age (Figures 1C, 1E and S1I). Importantly, the histologic phenotype of HG-PIN in PtenL/+; R26F133V mice was distinct, characterized by a striking degree of nuclear atypia compared to the rarer HG-PIN with minimal atypia in PtenL/+ control mice (Figures 1D, 1E, 1H, and S1J). Areas of HG-PIN in SPOP-F133V mice showed high levels of phosphorylated Akt and AR as determined by IHC (Figures 1E, 1G and S1H), and increased Ki-67 positive cells (Figure 1F). At advanced age (>12 months), areas of invasive cancer were observed in one out of five PtenL/+;R26F133V mice (Figure 1I and S1K). We conclude from these data that in the context of heterozygous Pten loss, SPOP mutation drives a distinct phenotype of HG-PIN with atypia and the potential to transition to invasive carcinoma.
PTEN deletions and mutations, while rare in the early phases of the SPOP mutant subtype of human prostate cancer (Barbieri et al., 2012; Cancer Genome Atlas Research, 2015), become more frequent in advanced prostate cancer (Figure S2A) (Grasso et al., 2012; Robinson et al., 2015) suggesting that PTEN deletion may contribute to progression of SPOP mutant prostate cancer (Barbieri et al., 2014; Haffner et al., 2013). We therefore next examined the impact of SPOP mutation in the setting of conditional homozygous Pten loss. PbCre; PtenL/L mice developed diffuse, highly proliferative HG-PIN without evidence of invasive cancer, but with cystic enlargement of the anterior prostate grossly (Figures 2A–D). In contrast, by 12 months of age PbCre; PtenL/L; R26F133V mice displayed severely enlarged prostates with areas of solid tumor (Figure 2A, S2B). Histologically, 80% of mice expressing mutant SPOP displayed invasive, poorly differentiated carcinomas (Figures 2C, 2D and S2C). These tumors were highly proliferative, with transitional sarcomatoid differentiation and maintained expression of AR (Figures 2D, S2D). We conclude from these data that SPOP mutation is able to cooperate with loss of Pten to drive invasive prostate cancer in vivo.
Figure 2. SPOP mutation leads to invasive adenocarcinoma in PtenL/L mice.

(A–D): control = PbCre;PtenL/L and SPOPmut = PbCre;PtenL/L;R26F133V
(A) Left panel: Gross image of the prostate and seminal vesicle of 12 month old mice. Top: SPOPmut (PbCre;PtenL/L;R26F133V), Middle: Control (PbCre;PtenL/L), Bottom: WT. Right panel: Higher magnification H&E showing solid cellular (SPOPmut) versus cystic enlargement (Control). (Scale bar = 500 μM).
(B) Weight of prostate and seminal vesicle of 12 month old mice.
(C) Graph bar indicating percentage of control mice and SPOPmut mice developing HG-PIN only or invasive carcinoma.
(D) Representative H&E showing phenotypic progression over time (3 month, 6 month and 12 month) in PtenL/L (control) and PtenL/L;SPOPF133V mice (SPOPmut). Inset right corner of high magnification image of control HG-PIN and SPOPmut tumor shows AR expression. SPOP-F133V tumor shows poorly differentiated carcinoma. (Scale Bar = 50μM).
See also Figure S2.
SPOP mutant prostate organoids show increased proliferation without AR upregulation
Previous reports studying the biology and downstream effects of SPOP mutations in prostate cancer have relied on ectopic overexpression of SPOP proteins in cell lines with multiple preexisting genetic alterations (An et al., 2015; An et al., 2014; Gan et al., 2015; Geng et al., 2014; Theurillat et al., 2014), making the physiologic relevance of these models for normal prostate cells difficult to interpret. SPOP mutation occurs early in the natural history of prostate cancer and defines a distinct genetic subtype not represented by prostate cancer cell lines, therefore it may be necessary to study its effects in benign prostate cells. Organoid platforms represent an opportunity to study the effect of cancer-associated alterations in genetically normal cells that can recapitulate the cell biology and epithelial architecture of the prostate (Chua et al., 2014; Gao et al., 2014; Karthaus et al., 2014). To establish models to study the underlying biology affected by SPOP mutation in prostate cells, organoid lines from the prostates of R26F133V mice (Pten WT background) were isolated and engineered to expressed tamoxifen inducible Cre (Cre-ERT2) (Figure 3A). After treatment with 4-hydroxytamoxifen or vehicle, cells were sorted for GFP and physiologically relevant levels of mutant SPOP protein expression was confirmed by Western blot (Figure 3A). Organoid lines were then grown as 2D monolayer cultures or 3D cultures in Matrigel. As previously described (Chua et al., 2014; Gao et al., 2014; Karthaus et al., 2014), in 3D cultures organoids recapitulated features of prostate histology, including growth as multilayered structures with nuclear AR and expression of CK5 and CK8 in basal and luminal cells, respectively (Figure 3B).
Figure 3. SPOP mutation drives altered phenotype and increased proliferation without AR upregulation in mouse prostate organoids.

(A) Schematic overview of generating inducible SPOP-F133V murine prostate organoids. From left to right: Dissecting of prostate of 6–10 weeks old mouse harboring conditionally expressing SPOP-F133V. Stable lines with tamoxifen-inducible Cre were generated either by infecting the organoids with CreERT2 retrovirus (Line A) or crossing SPOP-F133V mice with TMPRSSS2-CreERT2 mice (Line B). Cells were treated with 4-Hydroxytamoxifen or vehicle for 48H followed by cell sorting and epitope-tagged SPOP-F133V expression was confirmed on immunoblot.
(B) Basic characterization of 3D organoid lines with Bright-field microscopy, H&E staining, GFP, AR, Ki67 IHC and Ck5 and Ck8 IF (Scale Bar = 50μM).
(C) 3D Organoid formation assay: Manual count of fully formed organoids within one well 14 days post plating (10 cells per well, 48 wells per line).
(D) Quantification of ki67 positive cells per organoid shown in percent [%].
(E) 2D growth assay: Shown are the relative changes in DNA content over a period of 72h for stable control and SPOPmut cell lines.
(F) Quantification of AR positive cells per organoid shown in percent [%].
(G) Left: Representative western blot showing protein levels of control and SPOPmut cell lines. Right: Shown are the fold changes between Control and SPOPmut organoids for AR, DEK and SRC3 protein level across five independently generated cell lines.
All data are means ± SEM. p values were calculated by one sample t test. See also Figure S3.
Compared to controls, SPOP mutant organoids showed a higher rate of organoid formation capability and resulting organoids showed more irregular borders with no differences in size (Figures 3B, 3C and S3A), and increased Ki-67 expression enriched in the basal layer (Figures 3B and 3D). 2D proliferation assays showed increased proliferation of mutant cells (Figure 3E). Increased cell growth was confirmed in multiple SPOP mutant organoid lines, including those with Cre expressed under control of the probasin promoter (Figure S3B). SPOP mutation also resulted in protein upregulation of previously reported SPOP substrates Dek and Src3 (Figure 3G and S3C) (Geng et al., 2013; Theurillat et al., 2014). We saw no consistent increased expression of AR by either IHC or Western blot (Figures 3B, 3F and 3G), however, rare individual biological replicates showed increased AR protein (Figure S3C). We did not observe any alterations in Pten expression, although both AR and PTEN have been reported to be SPOP substrates (Figure 2G) (An et al., 2014; Geng et al., 2014; Li et al., 2014). Taken together, these data support that physiologic levels of mutant SPOP expression alone is sufficient to confer features of transformed cells.
Transcriptional profiling of SPOP mutant organoids shows relevance to human prostate cancer and nominates PI3K/mTOR activation
To provide further insight to the signaling pathways deregulated by SPOP mutation and determine the relevance of these models to human prostate cancer, we performed RNA-seq on SPOP mutant organoids and controls. RNA-seq reads mapped to human and mouse SPOP confirmed appropriate expression of the F133V transgenic transcript without overexpression compared to endogenous mouse Spop (Figures S1C and S4A). We defined differentially expressed genes, with robust clustering according to SPOP status (Figure 4A and Table S1). Interrogating the gene space nominated by SPOP mutant mouse organoids in the transcriptomes of clinically localized human prostate cancer samples (TCGA) revealed significant clustering of known SPOP mutant tumors (P = 2.57 × 10⁻¹⁰, Figure 4B). SPOP mutations at F133 and other amino acids (e.g. Y87, F102, W131) were well represented in the cluster, as were genomic features known to be associated with SPOP mutant prostate cancer (including genomic deletions at 5q21, 6q15, and 2q21)(Barbieri et al., 2012; Boysen et al., 2015) indicating that SPOP-F133V in mouse prostate engaged a transcriptional program consistent with SPOP mutant human prostate cancer (Figure 4B). Differentially expressed genes in SPOP mutant mouse prostate organoids showed significant overlap with differentially expressed genes in human prostate cancer (Figure 4C). Molecularly, human prostate cancers can be classified into those harboring rearrangements in ETS transcription factors (e.g., TMPRSS2-ERG) and those lacking ETS rearrangements (Rubin et al., 2011). SPOP mutant prostate cancers are exclusively ETS rearrangement negative, and differentially expressed genes in SPOP mutant mouse prostate organoids overlapped specifically with ETS rearrangement negative human prostate cancer (Figure 4C). Together, these data suggest that expression of SPOP-F133V in mouse prostate epithelium recapitulates transcriptional features of human SPOP mutant prostate cancer.
Figure 4. SPOP mutant mouse organoids represent human SPOP mutant subtype, and multiple pathways deregulated by SPOP mutation.

(A) Hierarchical clustering and heatmap of significantly differentially expressed genes between mouse SPOPmut organoids and control (FDR≤0.2). Enriched GO terms shown in the right panel.
(B) Hierarchical clustering and heatmap of significantly differentially expressed genes between SPOPmut and SPOP wild-type from both mouse organoids and human prostate cancer samples (TCGA). Significant enrichment of SPOP mutant tumors and known copy number alterations related to SPOP mutations shown within red rectangle. Enriched GO terms shown in the right panel.
(C) Overlap of differentially expressed genes between mouse prostate organoids and human prostate cancer samples, ETS+ samples (ETS rearrangement) and ETS- samples (lacking ETS rearrangement), when comparing to normal samples.
(D) Unbiased gene set enrichment analysis (GSEA) for all mouse organoid pairs (SPOPmut vs. control). The y-axis represents the sum of normalized enrichment score (NES) of MSigDB oncogenic signatures. Red dots represent highly enriched signatures as deregulated by SPOP mutation, and grey dots represent lowly enriched signatures.
(E) Significant enrichment of gene sets involving PI3K/mTOR signaling in mouse prostate organoids expressing mutant SPOP in 5 independent replicates. Reverse enrichment of mouse ERG signature in mouse SPOP mutant organoids shown as negative control. Each dot represents enrichment score between SPOP mutant and control from one pair.
(F) GSEA of the SPOP mutant profiling in mouse prostate organoids showing that a gene set defined by genes up-regulated upon PTEN inactivation (PTEN_DN.V1_UP) and a gene set defined by genes deregulated in mouse prostate by transgenic expression of AKT1 (AKT1_UP.V1_DN) are positively enriched.
Having established the relevance of the mutant SPOP organoid model to human SPOP mutant prostate cancer, we next explored the signaling pathways deregulated by SPOP mutation. Unbiased gene set enrichment analysis (GSEA) nominated multiple pathways as deregulated by SPOP mutation (Figure 4D and Table S2). Multiple independently derived organoid lines with induction of SPOP mutation showed strong concordance across prostate gene sets (Figure S4B). We previously reported that SPOP mutation affects genomic stability similar to BRCA1 inactivation (Boysen et al., 2015) and saw evidence of this in the transcriptional response to SPOP-F133V in mouse organoids (Figure S4C). Despite previous reports that SPOP mutation drives AR transcriptional output in vitro (Geng et al., 2014), and that SPOP mutant human prostate cancer is associated with increased AR transcriptional output in TCGA data (Cancer Genome Atlas Research, 2015), we saw no evidence that gene sets defined by androgen regulation in either mouse or human prostates were enriched in SPOP mutant mouse organoids (Figure S4D). Instead, we saw enrichment of multiple pathways associated with activation of PI3K/mTOR signaling, including signatures of KRAS activation, PTEN inactivation, and AKT dysregulation (Figure 4D and Table S2). GSEA focused specifically on gene sets involving PI3K/mTOR signaling showed significant enrichment in prostate cells expressing mutant SPOP (Figure 4E and 4F). These data nominate SPOP mutation as a lesion activating PI3K/mTOR signaling in mouse and human prostate.
SPOP mutation activates PI3K/mTOR signaling
Previous studies exploring downstream signaling effects of SPOP mutations have not identified activation of PI3K/mTOR signaling, but have utilized cell lines with multiple genetic alterations, which could mask pathway activation (An et al., 2015; An et al., 2014; Gan et al., 2015; Geng et al., 2014; Theurillat et al., 2014). We therefore hypothesized that in genetically normal prostate epithelial cells, SPOP mutation resulted in deregulation of PI3K/mTOR signaling. IHC using antibodies against phosphorylated S6 (pS6), a marker of mTOR pathway activation, in prostates of PbCre; R26F133V mice showed focal areas of intense pS6 staining, particularly in areas with nuclear atypia, that were absent in controls (Figures 5A and S5A). Mouse prostate organoids expressing mutant SPOP alone showed increased levels of both pS6 (Figure 5B) and phosphorylated 4eBP1 (p4eBP1) (Figure S5B), another marker of mTOR pathway activation; this was observed in multiple organoid lines, with Cre expressed under the control of different promoters (Figure 5C and S5C). Increased activation of mTOR signaling by SPOP-F133V was maintained in prostate tissue from PbCre; PtenL/L; R26F133V mice (Figure 5D). Finally, treatment of organoids with Torin1, a potent inhibitor of both mTORC1 and mTORC2, again revealed increased mTOR output in SPOP mutant organoids (Figure 5E).
Figure 5. SPOP mutation leads to activation of the PI3K/mTOR signaling.

(A) pS6 staining in representative glands of one year old mice with Pten+/+ background (Scale Bar = 50μM). SPOPF133V mice show focally increased staining over control.
(B) Left panel: Representative pS6 staining of control organoids (left) and SPOP-F133V expressing organoids (right) (Scale Bar = 50μM). Right panel: Quantitative comparison of organoids positive for pS6 expression on IHC
(C) Western blot for pAKT and pS6 in mouse prostate organoids. PtenL/L (control); PtenL/L;R26F133V (SPOPmut).
(D) Left panel: Western blot for pAKT, p4EBP1 and pS6, from prostate tissue lysates of one year old wild-type (WT), PbCre;PtenL/L mice (control) and PbCre;PtenL/L;R26F133V mice (SPOPmut). Right panel: Relative protein expression across multiple samples from WT, control and SPOPmut prostate lysates.
(E) Treatment with decreasing concentration of mTOR inhibitor for 1h leads to gradual release of mTOR activity (Left to right: 100, 50, 10, 5,0 nM Torin1). SPOPmut organoids show higher mTOR activation based on p4EBP1 and pS6 protein level than control organoids.
(F) Shown is mutually exclusivity between mutated SPOP and alterations in PI3K pathway components (PTEN deletions/mutations or PIK3CA and AKT amplification/mutation) across 3 independent cohorts with a total number of 498 samples (SPOPwt= 440, SPOPmut= 58).
(G) PTEN and pAKT IHC for prostate glands in PbCre;Pten+/L (Control) and PbCre;Pten+/L;R26F133V (SPOPmut) mice. (Scale bar: 50 μM).
See also Figure S5.
To determine if activation of PI3K signaling by SPOP mutation was supported by genomic events observed in human prostate cancer samples, we examined three publicly available datasets comprising 498 tumors (Baca et al., 2013; Barbieri et al., 2012; Cancer Genome Atlas Research, 2015). Analysis showed mutual exclusivity between SPOP mutations and genomic alterations in components of PI3K signaling that are significantly recurrently altered in clinically localized prostate cancer, including deletions and mutations in PTEN, and amplification and mutations in PIK3CA and AKT1 (Figures 5F and S5D), consistent with previous data (Barbieri et al., 2012). Consistent with this, in PtenL/+ mice, all prostate glands expressing p-AKT showed loss of Pten protein expression, while PtenL/+; R26F133V prostates showed activation of Akt despite persistent Pten expression (Figures 5G and S5E). Finally, in reverse-phase protein array data from 250 clinically localized human prostate cancer samples, SPOP mutant human prostate cancers had significantly higher expression of phospho-T37 and phospho-T70 4eBP1, consistent with PI3K/mTOR activation (Figure S5F). In human prostate cancer samples and mouse organoids, we did not identify gene expression changes in components of PI3K signaling in SPOP mutant tumors (Figure S5G), suggesting that pathway activation was not due to transcriptional upregulation of PI3K components. Taken together, these data suggest that SPOP mutation is associated with activation of PI3K/mTOR signaling in mouse prostate tissue and in human prostate cancer samples.
Activation of PI3K/mTOR signaling by mutant SPOP is mediated by SRC3
SRC3, encoded by NCOA3, is a bona fide substrate of SPOP and has been shown to be stabilized by prostate cancer specific SPOP mutants (Geng et al., 2013). We confirmed that Src3 protein was upregulated by SPOP-F133V in mouse organoids (Figure 3G and S3C) and prostate tissue (Figure 6A). SRC3 has also been reported to activate PI3K signaling through transcriptional upregulation of IGF-1 (Torres-Arzayus et al., 2004). We confirmed in prostate organoids that mutant SPOP was associated with increased Igf1 mRNA in both Pten WT and Pten deleted backgrounds (Figure 6B), and knockdown of Src3 with siRNA abrogated the increase in Igf1 expression by mutant SPOP (Figure 6C). Furthermore, inhibition of IGF1R abrogated the increase in pS6 and pAkt protein levels in SPOP mutant prostate cells (Figure S6A), and stimulation with IGF1 ligand increased pS6 and pAkt in SPOP WT controls to levels comparable to SPOP mutant cells (Figure S6B). We therefore hypothesized that activation of PI3K/mTOR signaling by mutant SPOP could be mediated by SRC3. Knockdown of Src3 in mouse prostate organoids reduced the increase in pS6 protein levels seen with mutant SPOP, in both Pten WT (Figure 6D) and Pten deleted (Figure 6E) backgrounds. These data support that activation of PI3K/mTOR signaling by SPOP mutation is mediated in part through the SPOP substrate SRC3.
Figure 6. Activation of PI3K/mTOR signaling by mutant SPOP is mediated by SRC3.

(A) IHC for GFP (left), indicating SPOP-F133V expression, as well as SRC3 (right) in prostate tissue from PbCre;R26F133V mice mouse. (Scale bar: 50 μM).
(B) Relative mRNA level of IGF1 in control and SPOPmut cells in either Pten+/+ (left) or PtenL/L (right) background. Data are means ± SEM.
(C) Relative mRNA level of SRC3 (blue) and IGF1 (orange) in control and SPOPmut cells transfected with control siRNA or siRNA targeting SRC3, 48h post transfection.
(D) Western blot for SRC3, pS6, and SPOP protein from control and SPOP-F133V mouse prostate organoids, with control siRNA or SRC3 knockdown (200(+++), 100(++), 50(+)nM).
(E) Western blot for SRC3, pS6, and SPOP protein from PtenL/L (control) and two distinct PtenL/L;SPOP-F133V (SPOPmut) mouse prostate organoids, with control siRNA or SRC3 knockdown (100nM).
See also Figure S6.
SPOP mutation maintains AR activity against PI3K mediated feedback inhibition
PI3K and AR signaling have significant reciprocal negative feedback, with PI3K activation resulting in downregulation of AR signaling (Carver et al., 2011; Lee et al., 2015; Mulholland et al., 2011; Thomas et al., 2013). We therefore hypothesized that in our model systems, previously reported upregulation of AR signaling by mutant SPOP could be masked by the concomitant activation of PI3K/mTOR signaling. We examined the impact of SPOP mutation on AR protein level in mouse organoids with inactivation of PI3K/mTOR signaling. Treatment with Torin1 resulted in a relative increase in AR protein expression with SPOP-F133V (Figure 7A). In addition, modulation of mTOR activity with various doses of Torin1 led to an expected inverse relationship between AR protein levels and mTOR activity (as measured with pS6 and p4eBP1) in control cells (Figure 7A). In contrast, organoids expressing SPOP-F133V maintained AR expression in the face of higher mTOR activity (Figure 7A). We next examined the consequences of SPOP mutation on expression of AR in mouse organoids with activation of PI3K/mTOR signaling. Prostate organoids cultured in low (5 ng/mL) or high (50 ng/mL) EGF conditions were examined for AR and pS6 protein levels by IHC. As expected, control cells responded to increased EGF with increased pS6 levels, increased Ki67 staining and a dramatic decrease in AR protein expression (Figures 7B and S6A), In contrast, SPOP mutant organoids maintained higher AR levels with increased EGF exposure (Figure 7B).
Figure 7. SPOP mutation stabilizes AR and maintains AR transcription in the setting of activated PI3K/mTOR signaling.

(A) Quantitative western blot analysis. Decreasing Torin 1 concentration leads to increase p4eBP1 expression (Bars) and either decrease AR expression (blue line – control) or stable AR expression (red line – SPOPmut). AR normalized to 100nM Torin-Control and pS6 normalized to 0nM Torin-SPOPmut.
(B) Left panel: Relative AR expression in control organoids (blue) and SPOP-F133V expressing organoids (red) with either 5 or 50ng/ml EGF culture condition. Right panel: AR staining of control and SPOPmut organoids in 5 or 50ng/ml EGF culture condition. (Scale bar: 50 μM).
(C–E) organoids generated from the whole prostate of one year old PbCre,WT; PbCre,PtenL/L, and PbCre,PtenL/L,R26F133V mice
(C) Western blot showing AR, pAKT, SPOP and PTEN expression
(D) Relative RNA expression measured by quantitative PCR for AR targets, FKBP5, PSCA, NKX3.1. Data are means ± SEM.
(E) IHC staining for AR (left) and pS6 (right) in control (Top) and SPOP mutant (bottom) expressing organoids. Control organoids show exclusive AR (arrow) or high pS6 (star) staining on a gland to gland basis. SPOPmut organoid have coexisting high expression of AR and pS6. (Scale bar: 50 μM).
(F) Phospho-4EBP1 levels and AR transcriptional score from human prostate cancer samples (TCGA), divided into SPOP mutant and SPOP WT tumors. Top: distribution of phospho-4EBP1 levels in RPPA data from human prostate cancer samples. Bottom: AR transcriptional score in RNA-seq data from human prostate cancer samples. Increasing phospho-4EBP1 and AR score from left to right. Only PTEN WT tumors were considered in this analysis.
See also Figure S7.
Prostate organoids derived from PtenL/L mice showed expected increase in pAkt, and downregulation of AR expression (Figure 7C), consistent with previous results (Carver et al., 2011). In contrast, SPOP-F133V in the PtenL/L background resulted in upregulation of AR protein and increased expression of AR target genes (Figure 7C and 7D). This has been confirmed in prostate tissue from one year old PbCre,PtenL/L and PbCre,PtenL/L,R26F133V mice compared to age matched wild-type mice (Figure S7B). Furthermore, areas of AR and pS6 expression showed clear mutual exclusivity at the individual cell level in PtenL/L prostate organoids, while combination with SPOP-F133V resulted in co-expression of AR and pS6 (Figure 7E).
Next, we examined the impact of SPOP mutation on AR transcriptional output in human prostate cancer samples, using RNA-seq data from TCGA. When considered in isolation, SPOP mutation had a strong association with higher AR transcriptional score (p = 3.65×10⁻⁵, Figure S7C). However, when molecular subtype (ETS and PTEN status) was considered, we observed an attenuation of this phenomenon (Figure S7D). As previously reported, PTEN deletion showed a strong association with decreased AR transcriptional activity (Carver et al., 2011), particularly in cancers harboring ETS rearrangements (p < 0.001, Figure S7D). When compared to tumors of the same PTEN and ETS background, SPOP mutant tumors showed both an increase in PI3K/mTOR activity (as measured by p4EBP1, p = 0.019) and an increase in AR transcriptional activity (p = 0.047, Figure 7F), consistent with the concomitant activation of PI3K and AR signaling in these cancers. Together, these data support that SPOP mutation maintains AR transcriptional output in the setting of PI3K activation, thereby activating two major pathways in the pathogenesis of prostate cancer.
Proteome-wide analysis shows activation of PI3K/mTOR signaling and coordinate upregulation of an AR-centric protein network
To gain further insight to the proteins deregulated by expression of physiologic levels of mutant SPOP, we performed unbiased proteome-wide profiling of control and SPOP mutant mouse prostate cells (Pten WT) using label-free MS/MS. We observed significant differential expression in 300 proteins (≥1.5 fold, p < 0.05), with mutant SPOP resulting in upregulation of 187 and downregulation of 113 proteins (Figure 8A, Table S3). Consistent with hyperactivation of PI3K/mTOR signaling in response to SPOP-F133V, the most altered protein was IRS1 (down 15.9 fold, p = 0.002), known to be degraded in response to mTOR activation (Harrington et al., 2005). Furthermore, Ingenuity Pathway Analysis of altered proteins highlighted AKT1 as one of the top upstream regulators (Figure 8B, Table S4). These unbiased proteomic data reinforce the conclusion that SPOP mutation results in activation of PI3K/mTOR signaling.
Figure 8. Proteome-wide analysis of SPOP-F133V expression in mouse prostate cells: activation of PI3K/mTOR signaling and upregulation of a network of AR transcriptional partners.

(A) Volcano plot of differentially abundant proteins in control vs. SPOPmut mouse prostate cells (three independent biological replicates, Pten WT) determined by label-free MS/MS. Log2 (fold change) of SPOP-F133V/control is plotted on x-axis;-Log10 (p value) is plotted on y-axis. Non-axial vertical dashed lines represent ±1.5-fold change, non-axial horizontal dashed line represents p = 0.05. Each circle denotes a single detected protein; larger circles represent higher confidence in differential abundance based on peptide counts and variability.
(B) Ingenuity Pathway Analysis upstream regulator analysis was performed on all significantly differentially abundant proteins. Top predicted upstream regulators are displayed with -Log10 (p value) for overlap.
(C) The known SPOP Binding Consensus motif (SBC) motif was searched against significantly upregulated and downregulated proteins. Percent of significantly upregulated and downregulated proteins, as well as random sequences, harboring motif is shown.
(D) De novo motif analysis was performed on the top 100 SPOP-F133V upregulated proteins. Alignment of selected upregulated proteins with the top-ranked sequence (S-S-S-x-x-S) is shown. Bottom: Percent of significantly upregulated proteins, as well as random sequences, harboring motif is shown.
(E) Top inset: Protein-protein interaction (PPI) enrichment score for proteins with significantly decreased expression (blue) and significantly increased expression (green), plotted as -Log10 (p value). Lower inset: network statistics for presented network. Right: Network analysis of SPOP-F133V upregulated proteins from STRING database (string-db.org). Network nodes represent proteins with increased expression; edges represent protein-protein associations, including physical and functional interactions. Network hub centered around Androgen receptor (Ar) and involving associated transcriptional factors and co-activators is highlighted.
(F) Immunoblot showing p300 level in mouse prostate cells with Cre-inducible SPOP-F133V (left), and Hoxb13 level in mouse prostate cells with Cre-inducible SPOP-F133V (right).
See also Figure S8 and Table S3 – S6.
Under these assay conditions and higher level of resolution, several previously established SPOP substrates showed significantly increased expression (Table S3), including TRIM24 (up 3.9 fold, p = 0.002) and AR (up 2.24 fold, p = 0.016). Others demonstrated trends of increased expression, but did not meet proteome-wide significance, such as Dek (up 1.36 fold, p = 0.036) and SRC3 (up 2.02 fold, p = 0.12).
We next determined the frequency of the established SPOP binding consensus (SBC) amino acid motif (nonpolar [ϕ] – polar [π] – S/T – S/T – S/T) in all significant altered proteins. Upregulated proteins were significantly more likely to harbor a SBC than downregulated proteins (Figure 8C, Table S5), consistent with the hypothesis that SPOP-F133V acts as a dominant negative. We next performed de novo motif analysis on the top upregulated proteins to determine if there were amino-acid sequences specifically associated with increased expression in response to SPOP-F133V. This revealed a number of serine-rich motifs distinct from the canonical SBC (Figure S8A). The amino acid sequence S-S-S-x-x-S was the top enriched motif in upregulated proteins, and was present in established SPOP substrates such as Trim24 and AR, AR cofactors such as Rnf14 and other upregulated proteins with potential relevance to transcriptional control and prostate cancer pathogenesis, such as Brd2, Atr and Setb1 (Figure 8D, Table S6). Interestingly, another highly enriched amino acid sequenced contained the L-x-x-L-L motif (Figure S8A, Table S6) known to mediate the interaction of transcriptional coactivators with nuclear hormone receptors (McInerney et al., 1998).
Finally, to gain insight to the associations among proteins deregulated by SPOP-F133V, we performed a network analysis of up- and down-regulated proteins using STRING, a database of known and predicted protein-protein interactions (Szklarczyk et al., 2015). Consistent with the hypothesis that mutant SPOP acts as a dominant negative to coordinately upregulate networks of functionally related proteins, we observed a robust network among proteins upregulated by mutant SPOP (Figure 8E); in contrast, there was minimal network structure in downregulated proteins (Figure S8B). In particular, there was a subnetwork of upregulated proteins centered around AR, including the AR-associated transcription factor HOXB13 (Norris et al., 2009), and AR coactivators EP300 (Debes et al., 2002), DNA-PK (Goodwin et al., 2015), SRC3 (Xu et al., 2009) and TRIM24 (Groner et al.). Using immunoblots, we confirmed increased expression of HoxB13 and p300, using both mouse and human prostate cells expressing mutant SPOP (Figure 8F, Figure S8C and D). Taken together, these data suggest that mutant SPOP acts as a dominant negative to coordinately deregulate networks of functionally related proteins, and in particular may effect upregulation of transcriptional complexes consisting of AR and associated transcription factors and co-activators.
Discussion
Comprehensive molecular characterization of prostate cancer has revealed numerous molecular alterations with the potential to act as drivers of cancer development and progression. These include several genes previously not implicated in carcinogenesis, making their functional significance unclear. SPOP mutations are the most common point mutations in clinically localized prostate cancer, yet SPOP was only recently implicated as a cancer gene. This study shows that SPOP mutation promotes prostate tumorigenesis in vivo, clearly defining it as a cancer driver (vs. passenger) and reinforcing its importance in human prostate cancer.
AR and PI3K signaling represent two critical signaling pathways in the pathogenesis of human prostate cancer. Recent data has exposed reciprocal negative feedback between AR and PI3K signaling (Carver et al., 2011; Lee et al., 2015; Mulholland et al., 2011; Thomas et al., 2013). Here we show that SPOP mutation disrupts this feedback, allowing coordinate activation of both pathways, supporting prostate carcinogenesis. In human prostate cancer, separate genomic events leading to independent activation of these pathways are common. For instance, ERG rearrangement and PTEN inactivation commonly co-occur in primary prostate cancer (Barbieri et al., 2012; Cancer Genome Atlas Research, 2015; Taylor et al., 2010); PTEN loss drives PI3K activation while ERG maintains AR transcription in this setting (Carver et al., 2009; Chen et al., 2013). In human prostate cancer, the SPOP mutant subclass has been associated with increase AR activity (Cancer Genome Atlas Research, 2015). However, single events resulting in coordinate regulation of these pathways have not been described. Our report of SPOP mutation as a single genomic event activating both AR and PI3K signaling provides insight to biology underlying this unique subclass of prostate cancer, and potentially suggests signaling convergence that underlies the mutual exclusivity between SPOP mutation and ERG rearrangement. Furthermore, these findings reinforce the critical nature of AR and PI3K signaling across prostate cancer classes, and may suggest opportunities for therapeutic intervention upstream of these two critical pathways. In addition, activation of AR signaling may confer dependency on this pathway in SPOP mutant prostate cancers and increased sensitivity to androgen targeting therapy. Unlike other genomic alterations, SPOP mutation is not increased in prevalence in castration resistant prostate cancer (Robinson et al., 2015), and may even be depleted in these cancers, suggesting preferential response to ADT. However, understanding the full extent of mechanisms responsible for the effect of SPOP mutation on these signaling pathways, the interaction between them, and the impact on therapeutic sensitivity, requires additional investigation.
Genetically engineered mouse models have played a key role in understanding the biology of prostate cancer, defining the impact of critical alterations observed in human disease, and developing effective treatment strategies. Interestingly, key alterations observed in human prostate cancer (such as overexpression of ERG or ETV1 and deletion of TP53) are insufficient for prostate neoplasia in mice, but show neoplastic phenotypes in combination with other alterations (Baena et al., 2013; Carver et al., 2009; Chen et al., 2013; Chen et al., 2005). Here, we show this is the case with SPOP mutation as well, at least in the specific genetic context of this model – one caveat is that mice of the C57BL/6 background are often considered relatively tumor resistant (Svensson et al., 2011), and we cannot speculate on the consequences of SPOP mutation in other backgrounds. The cytologic abnormalities with prostate-specific conditional expression of SPOP-F133V alone may reflect activation of underlying oncogenic pathways, which result in robust neoplastic phenotypes in combination with Pten deletion. This spectrum of genetic alterations provides the opportunity to study the role of SPOP mutation as an early event in cancer initiation (Pten+/+), a key driver in cancer progression (PtenL/+) and its role in more advanced disease (PtenL/L).
The study of early alterations in a relatively genetically normal context may be crucial for defining the biological effects on prostate cancer development. SPOP mutation occurs early in the natural history of prostate cancer (Boysen et al., 2015), and ectopic introduction of SPOP mutations in cell lines with multiple alterations may mask oncogenic effects. We observed that conditional expression of mutant SPOP alone in mouse prostate organoids results in transcriptional changes consistent with human prostate cancer, reinforcing the relevance of our model and the important role of mutated SPOP in prostate cancer pathogenesis. In addition, all SPOP mutations observed in human prostate cancer are heterozygous, with roughly equal expression of the wild-type and mutant alleles (Barbieri et al., 2012). Our conditional mouse model systems show nearly 1:1 expression of endogenous and mutant SPOP proteins, recapitulating physiologically relevant expression levels in human disease.
SPOP encodes the substrate recognition component of a CUL3-based E3 ubiquitin ligase, and prostate cancer derived SPOP mutants appear to act as dominant negatives with selective loss of function (Boysen et al., 2015). Known substrates of SPOP are numerous, and the specific substrates that are deregulated by SPOP mutations are starting to be defined. These include the chromatin-associated oncogene DEK (Theurillat et al., 2014), the oncogenic co-activator TRIM24 (Groner et al.; Theurillat et al., 2014) and the androgen receptor itself (An et al., 2014) (Geng et al., 2014). We show that SRC3 (NCOA3), another SPOP substrate stabilized by SPOP mutation (Geng et al., 2013), mediates, at least in part, the activation of PI3K/mTOR signaling by SPOP mutation. Furthermore, an unbiased proteomics approach revealed additional candidate proteins regulated by SPOP mutation. Most importantly, it showed increased expression of not only AR, but a network of multiple AR-associated transcription factors and co-activators. Consistent with this, proteins upregulated by mutant SPOP are enriched for the L-x-x-L-L motif, a key mediator of interaction between co-activators and nuclear receptors (Heery et al., 1997; McInerney et al., 1998). This raises the possibility that SPOP mutation can coordinately deregulate multiple components of transcriptional complexes rather than a single substrate, therefore amplifying its impact on prostate cancer pathogenesis. Given the ability of ubiquitin ligases to coordinate networks of signaling events, it is highly likely that no single substrate of SPOP is responsible for all downstream oncogenic phenotypes. Further investigation will continue to define which SPOP substrates, individually or in combination, are critical for prostate tumorigenesis.
The relationship between SPOP mutations and other genomic alterations in the PI3K pathway (such as PTEN deletions) in prostate cancer is likely complex. Here, we show that the histologic phenotypes observed in the prostate when SPOP mutation is combined with Pten loss are distinct from the histology with Pten loss alone, rather than acceleration of the Pten deleted phenotype. In addition, SPOP mutation primarily affects readouts of mTOR activity, with less effect on Akt activation driven by Pten loss, consistent with parallel signaling rather than truly redundant pathways. SPOP mutations occur early in the natural history of prostate cancer, while PTEN deletions are generally later events. As we and others have shown, SPOP mutations are mutually exclusive with genomic alterations in PI3K pathway components in early, clinically localized disease states, but these alterations co-occur in more advanced cancers, particularly in castration-resistant prostate cancer. Whether the emergence of PTEN alterations in advanced SPOP mutant cancers represents natural biological progression or a mechanism of resistance to therapy will require additional investigation.
In summary, we report that mutation of SPOP, the most common missense mutations in prostate cancer, results in neoplasia in the mouse prostate. Physiologic expression of mutant SPOP activates PI3K/mTOR signaling in vitro and in vivo and upregulates a network of AR-associated transcription factors and co-activators. SPOP mutation maintains AR transcriptional activity against PI3K/mTOR mediated negative feedback, effectively activating two pathways critical for the pathogenesis of prostate cancer.
Experimental Procedures
Gene Targeting and mouse breeding
All mouse studies are approved by Weill Cornell Medicine Institutional Care and Use Committee under protocol 2015-0022. Gene targeting was performed as previously described (Chen et al., 2013). To generate prostate specific SPOP-F133V expression Rosa26SPOP/SPOP mice were crossed with previously described PbCre4, PtenL/+ mice (Trotman et al., 2003; Wu et al., 2001). Only male PbCre4 positive mice were used to carry the PbCre4 allele. All described mice are in a C57BL/6 background.
Mouse prostate harvest
Prostate tissue was harvested from euthanized mice using Co2 and samples were either prepared using liquid nitrogen for fresh frozen samples or fixed in 4% formalin over night and embedded in paraffin. Sectioning of the prostate was performed as described (Shappell et al., 2004).
Pathological review
All sections were reviewed by two independent board certified genitourinary pathologists specific expertise in mouse models of human prostate cancer (B.D.R., M.I.). All review was performed blinded to genotype.
Protein analysis
Tissue paraffin embedding, sectioning, H&E as well as IHC staining were performed by the translational research program at WCM pathology and laboratory medicine. Full list of all antibodies used in this study and conditions please see supplemental experimental procedures.
Mouse prostate organoid generation and experiments
Prostate tissue was extracted from euthanized mice and digested as previously described (Lukacs et al., 2010). Cells were plated in Matrigel (Corning, BD 356231) and covered by mouse media containing 5–50ng/ml EGF. Media and culture condition as previously described (Karthaus et al., 2014). Inducible organoid systems: Mouse prostate cells were virally infected with a CreERT2 construct and selected with puromycin (Line_A) or generated from a mouse containing transgenic TMPRSS2-CreERT2 construct (Line_B, (Gao et al., 2016)). CreERT2 was activated by adding 1μM 4-Hydroxytamoxifen (Sigma-Aldrich, T176) into the media over night. Either GFP or blind (for control cells) sorting was performed on the BD FACSAria – II. Non-inducible organoid system: Organoid lines with Cre expression under the control Probasin promoter were generated by taking tissue from PbCre negative and PbCre;R26F133V mice. Cell growth was measured in a 96 well format by using PicoGreen (Invitrogen, P7581). For “organoid formation assay” 10 single cells were plated per well (total of 48) on day 1. Number of formed organoids was counted on day 7 as well as day 14 post plating. Size of organoid was measured on day 14 with cellSens software by Olympus.
Please see supplemental experimental procedure for further details.
Supplementary Material
Significance.
Recurrent point mutations in SPOP occur early in 10% of prostate cancers defining a distinct molecular subclass. Our findings show that SPOP mutation drives prostate neoplasia in vivo through coordinate deregulation of both PI3K/mTOR and AR pathways. The discovery that SPOP mutation can activate two of the major pathways in prostate cancer exposes not only the biology of the SPOP mutant subclass, but the central importance of these pathways and their context across the spectrum of prostate cancer. These findings provide insight to both the unique and common features of molecular subtypes of human prostate cancer and highlight potential opportunities for precision therapy.
Highlights.
Mutations in SPOP are driver events that result in prostate tumorigenesis in the mouse.
SPOP mutation activates PI3K/mTOR signaling in vitro and in vivo through upregulation of its substrate SRC3 (NCOA3).
SPOP mutation maintains AR signaling against PI3K/mTOR mediated negative feedback.
Proteome-wide analysis reveals upregulation of a network of AR-associated transcription factors and co-activators by mutant SPOP.
Acknowledgments
We are grateful to the individuals with prostate cancer and their families for contributing to this study. We thank the MSKCC Gene Targeting (C. Yang), Mouse Genetics Core (W. Mark and P. Romanienko), Genomics Core (A. Viale), Molecular Cytogenetics (M. Leversha) and Molecular Cytology (K. Manova) core facilities, as well as the Weill Cornell Medicine Flow Cytometry core facility (J. McCormick) and the translational research program at WCM pathology and laboratory medicine especially Leticia Dizon and Yifang Liu. We thank Dr. Gunther Boysen for many helpful discussions and Dr. Wouter Karthaus for help with organoid culture. We thank Dr. Klaas van Wijk for contributions to statistical analysis of proteomic data. This work was supported by: SPORE (P50CA186786 A.M.C.), EDRN (U01 CA214170 A.M.C.), US NCI (K08CA187417-01, C.E.B., 2R01CA125612-05A1, M.A.R., K08CA140946, Y.C., R01CA193837, Y.C. P50CA092629, Y.C., P30CA008748, Y.C.), Starr Cancer Consortium (Y.C.), Geoffrey Beene Cancer Research Center (Y.C.), Gerstner Family Foundation (Y.C.), Bressler Scholars Fund (Y.C.), Stand Up To Cancer - Prostate Cancer Foundation Prostate Dream Team Translational Cancer Research Grant (SU2C-AACR-DT0712, M.A.R.), Prostate Cancer Foundation Challenge Award (C.E.B., M.A.R.), Prostate Cancer Foundation Young Investigator Award (C.E.B.), Urology Care Foundation Rising Star in Urology Research Award (C.E.B.), and Damon Runyon Cancer Research Foundation MetLife Foundation Family Clinical Investigator Award (C.E.B.).
Footnotes
Accession number
The mass spectrometry proteomics data have been deposited to the ProteomeXchange Consortium via the PRIDE (Vizcaino et al., 2016) partner repository with the dataset identifier PXD005309.
The RNA-Seq data has been uploaded to Gene Expression Omnibus (GEO) with the accession number: SRP070525. (https://www.ncbi.nlm.nih.gov/geo/)
Author Contributions
M.B., C.E.B., M.A.R. and Y.C. developed the concept and designed experiments. M.B., D.H. M.A.A., D.G., S.N. and L.D. oversaw and carried out experiments. A.S. and D.L. conducted bioinformatics analyses. B.R., M.I., and V.S. were study pathologists. A.P., A.M.C. performed and coordinated proteomic experiments and analysis. L.P. developed statistical methods for proteomic analyses. M.B. and C.E.B. wrote the manuscript, all authors critically reviewed and revised. M.A.R. and C.E.B. jointly directed this work.
Publisher's Disclaimer: This is a PDF file of an unedited manuscript that has been accepted for publication. As a service to our customers we are providing this early version of the manuscript. The manuscript will undergo copyediting, typesetting, and review of the resulting proof before it is published in its final citable form. Please note that during the production process errors may be discovered which could affect the content, and all legal disclaimers that apply to the journal pertain.
References
- An J, Ren S, Murphy SJ, Dalangood S, Chang C, Pang X, Cui Y, Wang L, Pan Y, Zhang X, et al. Truncated ERG Oncoproteins from TMPRSS2-ERG Fusions Are Resistant to SPOP-Mediated Proteasome Degradation. Molecular cell. 2015;59:904–916. doi: 10.1016/j.molcel.2015.07.025. [DOI] [PubMed] [Google Scholar]
- An J, Wang C, Deng Y, Yu L, Huang H. Destruction of full-length androgen receptor by wild-type SPOP, but not prostate-cancer-associated mutants. Cell reports. 2014;6:657–669. doi: 10.1016/j.celrep.2014.01.013. [DOI] [PMC free article] [PubMed] [Google Scholar]
- Baca SC, Prandi D, Lawrence MS, Mosquera JM, Romanel A, Drier Y, Park K, Kitabayashi N, MacDonald TY, Ghandi M, et al. Punctuated evolution of prostate cancer genomes. Cell. 2013;153:666–677. doi: 10.1016/j.cell.2013.03.021. [DOI] [PMC free article] [PubMed] [Google Scholar]
- Baena E, Shao Z, Linn DE, Glass K, Hamblen MJ, Fujiwara Y, Kim J, Nguyen M, Zhang X, Godinho FJ, et al. ETV1 directs androgen metabolism and confers aggressive prostate cancer in targeted mice and patients. Genes Dev. 2013;27:683–698. doi: 10.1101/gad.211011.112. [DOI] [PMC free article] [PubMed] [Google Scholar]
- Barbieri CE, Baca SC, Lawrence MS, Demichelis F, Blattner M, Theurillat JP, White TA, Stojanov P, Van Allen E, Stransky N. Exome sequencing identifies recurrent SPOP, FOXA1 and MED12 mutations in prostate cancer. Nature genetics. 2012;44:685–689. doi: 10.1038/ng.2279. [DOI] [PMC free article] [PubMed] [Google Scholar]
- Barbieri CE, Demichelis F, Rubin MA. The lethal clone in prostate cancer: redefining the index. European urology. 2014;66:395–397. doi: 10.1016/j.eururo.2013.12.052. [DOI] [PubMed] [Google Scholar]
- Berger MF, Lawrence MS, Demichelis F, Drier Y, Cibulskis K, Sivachenko AY, Sboner A, Esgueva R, Pflueger D, Sougnez C, et al. The genomic complexity of primary human prostate cancer. Nature. 2011;470:214–220. doi: 10.1038/nature09744. [DOI] [PMC free article] [PubMed] [Google Scholar]
- Blattner M, Lee DJ, O’Reilly C, Park K, MacDonald TY, Khani F, Turner KR, Chiu YL, Wild PJ, Dolgalev I, et al. SPOP mutations in prostate cancer across demographically diverse patient cohorts. Neoplasia. 2014;16:14–20. doi: 10.1593/neo.131704. [DOI] [PMC free article] [PubMed] [Google Scholar]
- Boysen G, Barbieri CE, Prandi D, Blattner M, Chae SS, Dahija A, Nataraj S, Huang D, Marotz C, Xu L, et al. SPOP mutation leads to genomic instability in prostate cancer. eLife. 2015;4 doi: 10.7554/eLife.09207. [DOI] [PMC free article] [PubMed] [Google Scholar]
- Cancer Genome Atlas Research N. The Molecular Taxonomy of Primary Prostate Cancer. Cell. 2015;163:1011–1025. doi: 10.1016/j.cell.2015.10.025. [DOI] [PMC free article] [PubMed] [Google Scholar]
- Carver BS, Chapinski C, Wongvipat J, Hieronymus H, Chen Y, Chandarlapaty S, Arora VK, Le C, Koutcher J, Scher H, et al. Reciprocal feedback regulation of PI3K and androgen receptor signaling in PTEN-deficient prostate cancer. Cancer cell. 2011;19:575–586. doi: 10.1016/j.ccr.2011.04.008. [DOI] [PMC free article] [PubMed] [Google Scholar]
- Carver BS, Tran J, Gopalan A, Chen Z, Shaikh S, Carracedo A, Alimonti A, Nardella C, Varmeh S, Scardino PT, et al. Aberrant ERG expression cooperates with loss of PTEN to promote cancer progression in the prostate. Nature genetics. 2009;41:619–624. doi: 10.1038/ng.370. [DOI] [PMC free article] [PubMed] [Google Scholar]
- Chen Y, Chi P, Rockowitz S, Iaquinta PJ, Shamu T, Shukla S, Gao D, Sirota I, Carver BS, Wongvipat J, et al. ETS factors reprogram the androgen receptor cistrome and prime prostate tumorigenesis in response to PTEN loss. Nature medicine. 2013;19:1023–1029. doi: 10.1038/nm.3216. [DOI] [PMC free article] [PubMed] [Google Scholar]
- Chen Z, Trotman LC, Shaffer D, Lin HK, Dotan ZA, Niki M, Koutcher JA, Scher HI, Ludwig T, Gerald W. Crucial role of p53-dependent cellular senescence in suppression of Pten-deficient tumorigenesis. Nature. 2005;436:725–730. doi: 10.1038/nature03918. [DOI] [PMC free article] [PubMed] [Google Scholar]
- Chua CW, Shibata M, Lei M, Toivanen R, Barlow LJ, Bergren SK, Badani KK, McKiernan JM, Benson MC, Hibshoosh H, Shen MM. Single luminal epithelial progenitors can generate prostate organoids in culture. Nature cell biology. 2014;16:951–961. 951–954. doi: 10.1038/ncb3047. [DOI] [PMC free article] [PubMed] [Google Scholar]
- Debes JD, Schmidt LJ, Huang H, Tindall DJ. p300 mediates androgen-independent transactivation of the androgen receptor by interleukin 6. Cancer research. 2002;62:5632–5636. [PubMed] [Google Scholar]
- Gan W, Dai X, Lunardi A, Li Z, Inuzuka H, Liu P, Varmeh S, Zhang J, Cheng L, Sun Y, et al. SPOP Promotes Ubiquitination and Degradation of the ERG Oncoprotein to Suppress Prostate Cancer Progression. Molecular cell. 2015;59:917–930. doi: 10.1016/j.molcel.2015.07.026. [DOI] [PMC free article] [PubMed] [Google Scholar]
- Gao D, Vela I, Sboner A, Iaquinta PJ, Karthaus WR, Gopalan A, Dowling C, Wanjala JN, Undvall EA, Arora VK, et al. Organoid cultures derived from patients with advanced prostate cancer. Cell. 2014;159:176–187. doi: 10.1016/j.cell.2014.08.016. [DOI] [PMC free article] [PubMed] [Google Scholar]
- Gao D, Zhan Y, Di W, Moore AR, Sher JJ, Guan Y, Wang S, Zhang Z, Murphy DA, Sawyers CL, et al. A Tmprss2-CreERT2 Knock-In Mouse Model for Cancer Genetic Studies on Prostate and Colon. PloS one. 2016;11:e0161084. doi: 10.1371/journal.pone.0161084. [DOI] [PMC free article] [PubMed] [Google Scholar]
- Geng C, He B, Xu L, Barbieri CE, Eedunuri VK, Chew SA, Zimmermann M, Bond R, Shou J, Li C. Prostate cancer-associated mutations in speckle-type POZ protein (SPOP) regulate steroid receptor coactivator 3 protein turnover. Proceedings of the National Academy of Sciences. 2013;110:6997–7002. doi: 10.1073/pnas.1304502110. [DOI] [PMC free article] [PubMed] [Google Scholar]
- Geng C, Rajapakshe K, Shah SS, Shou J, Eedunuri VK, Foley C, Fiskus W, Rajendran M, Chew SA, Zimmermann M, et al. Androgen receptor is the key transcriptional mediator of the tumor suppressor SPOP in prostate cancer. Cancer research. 2014;74:5631–5643. doi: 10.1158/0008-5472.CAN-14-0476. [DOI] [PMC free article] [PubMed] [Google Scholar]
- González-Billalabeitia E, Seitzer N, Song SJ, Song MS, Patnaik A, Liu XS, Epping MT, Papa A, Hobbs RM, Chen M, et al. Vulnerabilities of PTEN-p53-deficient prostate cancers to compound PARP/PI3K inhibition. Cancer discovery. 2014;4:896–904. doi: 10.1158/2159-8290.CD-13-0230. [DOI] [PMC free article] [PubMed] [Google Scholar]
- Goodwin JF, Kothari V, Drake JM, Zhao S, Dylgjeri E, Dean JL, Schiewer MJ, McNair C, Jones JK, Aytes A, et al. DNA-PKcs-Mediated Transcriptional Regulation Drives Prostate Cancer Progression and Metastasis. Cancer cell. 2015;28:97–113. doi: 10.1016/j.ccell.2015.06.004. [DOI] [PMC free article] [PubMed] [Google Scholar]
- Grasso CS, Wu YM, Robinson DR, Cao X, Dhanasekaran SM, Khan AP, Quist MJ, Jing X, Lonigro RJ, Brenner JC, et al. The Mutational Landscape of Lethal Castrate Resistant Prostate Cancer. Nature. 2012;487:239–243. doi: 10.1038/nature11125. [DOI] [PMC free article] [PubMed] [Google Scholar]
- Groner Anna C, Cato L, de Tribolet-Hardy J, Bernasocchi T, Janouskova H, Melchers D, Houtman R, Cato Andrew CB, Tschopp P, Gu L, et al. TRIM24 Is an Oncogenic Transcriptional Activator in Prostate Cancer. Cancer cell. doi: 10.1016/j.ccell.2016.04.012. [DOI] [PMC free article] [PubMed] [Google Scholar]
- Haffner MC, Mosbruger T, Esopi DM, Fedor H, Heaphy CM, Walker DA, Adejola N, Gurel M, Hicks J, Meeker AK, et al. Tracking the clonal origin of lethal prostate cancer. The Journal of clinical investigation. 2013;123:4918–4922. doi: 10.1172/JCI70354. [DOI] [PMC free article] [PubMed] [Google Scholar]
- Harrington LS, Findlay GM, Lamb RF. Restraining PI3K: mTOR signalling goes back to the membrane. Trends in Biochemical Sciences. 2005;30:35–42. doi: 10.1016/j.tibs.2004.11.003. [DOI] [PubMed] [Google Scholar]
- Heery DM, Kalkhoven E, Hoare S, Parker MG. A signature motif in transcriptional co-activators mediates binding to nuclear receptors. Nature. 1997;387:733–736. doi: 10.1038/42750. [DOI] [PubMed] [Google Scholar]
- Karthaus WR, Iaquinta PJ, Drost J, Gracanin A, van Boxtel R, Wongvipat J, Dowling CM, Gao D, Begthel H, Sachs N, et al. Identification of multipotent luminal progenitor cells in human prostate organoid cultures. Cell. 2014;159:163–175. doi: 10.1016/j.cell.2014.08.017. [DOI] [PMC free article] [PubMed] [Google Scholar]
- Lee SH, Johnson D, Luong R, Sun Z. Crosstalking between androgen and PI3K/AKT signaling pathways in prostate cancer cells. The Journal of biological chemistry. 2015;290:2759–2768. doi: 10.1074/jbc.M114.607846. [DOI] [PMC free article] [PubMed] [Google Scholar]
- Li G, Ci W, Karmakar S, Chen K, Dhar R, Fan Z, Guo Z, Zhang J, Ke Y, Wang L, et al. SPOP promotes tumorigenesis by acting as a key regulatory hub in kidney cancer. Cancer cell. 2014;25:455–468. doi: 10.1016/j.ccr.2014.02.007. [DOI] [PMC free article] [PubMed] [Google Scholar]
- Lukacs RU, Goldstein AS, Lawson DA, Cheng D, Witte ON. Isolation, cultivation and characterization of adult murine prostate stem cells. Nature protocols. 2010;5:702–713. doi: 10.1038/nprot.2010.11. [DOI] [PMC free article] [PubMed] [Google Scholar]
- McInerney EM, Rose DW, Flynn SE, Westin S, Mullen TM, Krones A, Inostroza J, Torchia J, Nolte RT, Assa-Munt N, et al. Determinants of coactivator LXXLL motif specificity in nuclear receptor transcriptional activation. Genes Dev. 1998;12:3357–3368. doi: 10.1101/gad.12.21.3357. [DOI] [PMC free article] [PubMed] [Google Scholar]
- Mulholland DJ, Tran LM, Li Y, Cai H, Morim A, Wang S, Plaisier S, Garraway IP, Huang J, Graeber TG, Wu H. Cell autonomous role of PTEN in regulating castration-resistant prostate cancer growth. Cancer cell. 2011;19:792–804. doi: 10.1016/j.ccr.2011.05.006. [DOI] [PMC free article] [PubMed] [Google Scholar]
- Norris JD, Chang CY, Wittmann BM, Kunder RS, Cui H, Fan D, Joseph JD, McDonnell DP. The Homeodomain Protein HOXB13 Regulates the Cellular Response to Androgens. Molecular Cell. 2009;36:405–416. doi: 10.1016/j.molcel.2009.10.020. [DOI] [PMC free article] [PubMed] [Google Scholar]
- Pierce WK, Grace CR, Lee J, Nourse A, Marzahn MR, Watson ER, High AA, Peng J, Schulman BA, Mittag T. Multiple weak linear motifs enhance recruitment and processivity in SPOP-mediated substrate ubiquitination. Journal of molecular biology. 2015 doi: 10.1016/j.jmb.2015.10.002. [DOI] [PMC free article] [PubMed] [Google Scholar]
- Prandi D, Baca SC, Romanel A, Barbieri CE, Mosquera JM, Fontugne J, Beltran H, Sboner A, Garraway LA, Rubin MA, Demichelis F. Unraveling the clonal hierarchy of somatic genomic aberrations. Genome biology. 2014;15:439. doi: 10.1186/s13059-014-0439-6. [DOI] [PMC free article] [PubMed] [Google Scholar]
- Robinson D, Van Allen EM, Wu YM, Schultz N, Lonigro RJ, Mosquera JM, Montgomery B, Taplin ME, Pritchard CC, Attard G, et al. Integrative clinical genomics of advanced prostate cancer. Cell. 2015;161:1215–1228. doi: 10.1016/j.cell.2015.05.001. [DOI] [PMC free article] [PubMed] [Google Scholar]
- Rubin MA, Maher CA, Chinnaiyan AM. Common gene rearrangements in prostate cancer. Journal of clinical oncology: official journal of the American Society of Clinical Oncology. 2011;29:3659–3668. doi: 10.1200/JCO.2011.35.1916. [DOI] [PMC free article] [PubMed] [Google Scholar]
- Shappell SB, Thomas GV, Roberts RL, Herbert R, Ittmann MM, Rubin MA, Humphrey PA, Sundberg JP, Rozengurt N, Barrios R, et al. Prostate pathology of genetically engineered mice: definitions and classification. The consensus report from the Bar Harbor meeting of the Mouse Models of Human Cancer Consortium Prostate Pathology Committee. Cancer research. 2004;64:2270–2305. doi: 10.1158/0008-5472.can-03-0946. [DOI] [PubMed] [Google Scholar]
- Svensson RU, Haverkamp JM, Thedens DR, Cohen MB, Ratliff TL, Henry MD. Slow disease progression in a C57BL/6 pten-deficient mouse model of prostate cancer. Am J Pathol. 2011;179:502–512. doi: 10.1016/j.ajpath.2011.03.014. [DOI] [PMC free article] [PubMed] [Google Scholar]
- Szklarczyk D, Franceschini A, Wyder S, Forslund K, Heller D, Huerta-Cepas J, Simonovic M, Roth A, Santos A, Tsafou KP, et al. STRING v10: protein-protein interaction networks, integrated over the tree of life. Nucleic acids research. 2015;43:D447–452. doi: 10.1093/nar/gku1003. [DOI] [PMC free article] [PubMed] [Google Scholar]
- Taylor BS, Schultz N, Hieronymus H, Gopalan A, Xiao Y, Carver BS, Arora VK, Kaushik P, Cerami E, Reva B, et al. Integrative genomic profiling of human prostate cancer. Cancer cell. 2010;18:11–22. doi: 10.1016/j.ccr.2010.05.026. [DOI] [PMC free article] [PubMed] [Google Scholar]
- Theurillat JP, Udeshi ND, Errington WJ, Svinkina T, Baca SC, Pop M, Wild PJ, Blattner M, Groner AC, Rubin MA, et al. Prostate cancer. Ubiquitylome analysis identifies dysregulation of effector substrates in SPOP-mutant prostate cancer. Science. 2014;346:85–89. doi: 10.1126/science.1250255. [DOI] [PMC free article] [PubMed] [Google Scholar]
- Thomas C, Lamoureux F, Crafter C, Davies BR, Beraldi E, Fazli L, Kim S, Thaper D, Gleave ME, Zoubeidi A. Synergistic targeting of PI3K/AKT pathway and androgen receptor axis significantly delays castration-resistant prostate cancer progression in vivo. Molecular cancer therapeutics. 2013;12:2342–2355. doi: 10.1158/1535-7163.MCT-13-0032. [DOI] [PubMed] [Google Scholar]
- Torres-Arzayus MI, de Mora JF, Yuan J, Vazquez F, Bronson R, Rue M, Sellers WR, Brown M. High tumor incidence and activation of the PI3K/AKT pathway in transgenic mice define AIB1 as an oncogene. Cancer cell. 2004;6:263–274. doi: 10.1016/j.ccr.2004.06.027. [DOI] [PubMed] [Google Scholar]
- Trotman LC, Niki M, Dotan ZA, Koutcher JA, Di Cristofano A, Xiao A, Khoo AS, Roy-Burman P, Greenberg NM, Dyke TV, et al. Pten Dose Dictates Cancer Progression in the Prostate. PLoS Biol. 2003;1:e59. doi: 10.1371/journal.pbio.0000059. [DOI] [PMC free article] [PubMed] [Google Scholar]
- Vizcaino JA, Csordas A, del-Toro N, Dianes JA, Griss J, Lavidas I, Mayer G, Perez-Riverol Y, Reisinger F, Ternent T, et al. 2016 update of the PRIDE database and its related tools. Nucleic acids research. 2016;44:D447–456. doi: 10.1093/nar/gkv1145. [DOI] [PMC free article] [PubMed] [Google Scholar]
- Wang S, Gao J, Lei Q, Rozengurt N, Pritchard C, Jiao J, Thomas GV, Li G, Roy-Burman P, Nelson PS, et al. Prostate-specific deletion of the murine Pten tumor suppressor gene leads to metastatic prostate cancer. Cancer cell. 2003;4:209–221. doi: 10.1016/s1535-6108(03)00215-0. [DOI] [PubMed] [Google Scholar]
- Wu X, Wu J, Huang J, Powell WC, Zhang J, Matusik RJ, Sangiorgi FO, Maxson RE, Sucov HM, Roy-Burman P. Generation of a prostate epithelial cell-specific Cre transgenic mouse model for tissue-specific gene ablation. Mech Dev. 2001;101:61–69. doi: 10.1016/s0925-4773(00)00551-7. [DOI] [PubMed] [Google Scholar]
- Xu J, Wu RC, O’Malley BW. Normal and cancer-related functions of the p160 steroid receptor co-activator (SRC) family. Nature reviews Cancer. 2009;9:615–630. doi: 10.1038/nrc2695. [DOI] [PMC free article] [PubMed] [Google Scholar]
Associated Data
This section collects any data citations, data availability statements, or supplementary materials included in this article.