Abstract
Purpose
To investigate a novel Hadamard-encoded spectral editing scheme and evaluate its performance in simultaneously quantifying N-acetyl aspartate (NAA) and N-acetyl aspartyl glutamate (NAAG) at 3 Tesla.
Methods
Editing pulses applied according to a Hadamard encoding scheme allow the simultaneous acquisition of multiple metabolites. The method, called HERMES (Hadamard Encoding and Reconstruction of MEGA-Edited Spectroscopy), was optimized to detect NAA and NAAG simultaneously using density-matrix simulations and validated in phantoms at 3T. In vivo data were acquired in the centrum semiovale of 12 normal subjects. The NAA:NAAG concentration ratio was determined by modeling in vivo data using simulated basis functions. Simulations were also performed for potentially coedited molecules with signals within the detected NAA/NAAG region.
Results
Simulations and phantom experiments show excellent segregation of NAA and NAAG signals into the intended spectra, with minimal crosstalk. Multiplet patterns show good agreement between simulations and phantom and in vivo data. In vivo measurements show that the relative peak intensities of the NAA and NAAG spectra are consistent with a NAA:NAAG concentration ratio of 4.22:1 in good agreement with literature. Simulations indicate some coediting of aspartate and glutathione near the detected region (editing efficiency: 4.5% and 78.2%, respectively, for the NAAG reconstruction and 5.1% and 19.5%, respectively, for the NAA reconstruction).
Conclusion
The simultaneous and separable detection of two otherwise overlapping metabolites using HERMES is possible at 3T.
Keywords: brain, edited MRS, Hadamard, NAA, NAAG
INTRODUCTION
In vivo proton (1H) magnetic resonance spectroscopy allows for noninvasive quantification of endogenous molecules within the body but suffers from limited dispersion of signals along the chemical shift dimension (1). This leads to substantial spectral overlap, hampering the accurate quantification of certain molecules, particularly those that have lower concentration. One solution to this problem is to tailor the acquisition so that only signals from a molecule of particular interest are detected, removing overlying signals from other more concentrated molecules. This is often achieved by J-difference editing, which allows for quantification of several low-concentration molecules, including N-acetylaspartylglutamate (NAAG) (2), gamma-aminobutyric acid (GABA) (3), lactate (4), glutathione (5), and 2-hydroxyglutarate (6).
One disadvantage of this tailored approach is that, in general, only one molecule can be targeted per scan with optimal sensitivity, limiting the number of molecules and brain regions that can be measured in clinical or research studies. However, some combinations of molecules can be edited simultaneously in a J-difference experiment. For example, experiments designed to edit GABA, whose detected signals appears at 3.0 ppm, usually also coedit glutamate and glutamine, whose detected signals appear at 3.75 ppm. This occurs because, in all three molecules, the detected multiplets are coupled to target resonances that lie within the bandwidth of the editing pulses. Another approach to detect two different molecules, termed Double Editing With MEscher-GArwood (DEW-MEGA) (7), can be applied when the two molecules to be detected have both the target and detected signals resolved. In this case, editing pulses can be alternately applied to each target in the ON and OFF scans, with the result that the two detected signals are edited with opposite phases in the subtraction of these two scans.
In this article, a new method is presented for acquiring multiple edited signals simultaneously that does not require the detected signals to be resolved from each other (unlike DEW-MEGA). The method, Hadamard Encoding and Reconstruction of MEGA-Edited Spectroscopy (HERMES) is demonstrated here for dual editing, but is scalable to acquire more than two molecules simultaneously, provided that the resonances targeted by the editing pulses are resolved from each other. The main novel aspects of HERMES are: Hadamard-encoded combinations of editing pulse frequencies, which give a multiplexed experiment that simultaneously edits more than one molecule, and Hadamard reconstructions of the subspectra, which give separate difference spectra for each molecule. Compared to sequential acquisitions of individual molecules, temporal signal-to-noise ratio (SNR) is improved because the full acquisition duration is used to detect every molecule. As an example of the method, a scheme for separately detecting N-acetylaspartate (NAA), which reflects neuronal mitochondrial metabolism (8), and its derivative N-acetylaspartylglutamate (NAAG), a moderator of glutamatergic neurotransmission (9), is presented.
THEORY
Consider two metabolites, with coupled spin systems described as AX and BY, where the X and Y spins give overlapping signals in the spectrum and the A and B spins are resolved. Each can be separately detected using a J-difference-edited experiment, applying frequency-selective pulses to the A or B spin, respectively, in the ON condition and not in the OFF condition. HERMES allows us to detect both spin systems at the same time by acquiring four scans with different combinations of editing pulses: (ON, ON), (ON, OFF), (OFF, ON), and (OFF, OFF). Thus, for each of the two spin systems, two scans are editing-ON, and two editing-OFF. By mapping ON to +1 and OFF to −1, this editing scheme can be represented as a Hadamard encoding matrix H (10), as shown in Figure 1a.
Fig. 1.
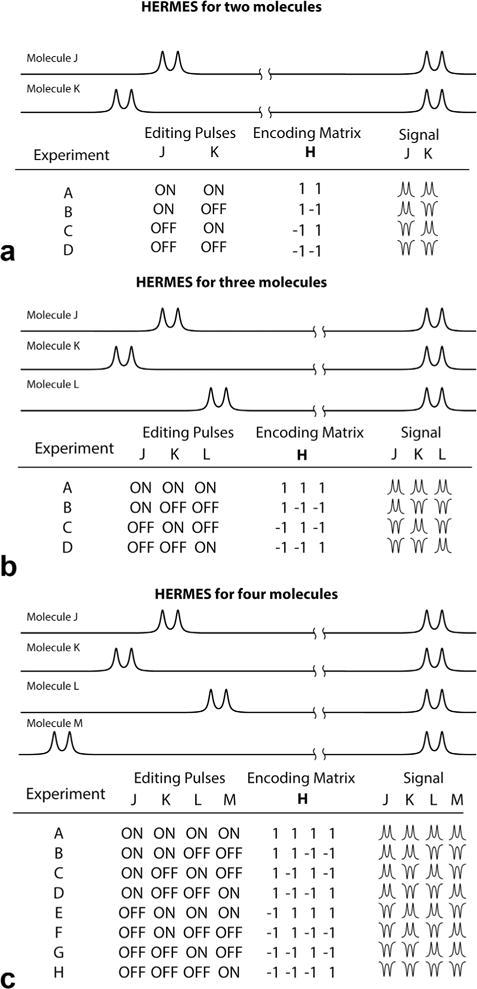
Schematic illustration of Hadamard-encoded editing. (a) Four-step HERMES scheme for two molecules. (b) The HERMES scheme for three molecules can also be achieved in four steps. (c) The HERMES scheme for four molecules requires eight steps. In theory, up to seven molecules could be incorporated into an eight-step scheme.
The vector M of the reconstructed spectra of each molecule is calculated from the vector N of the recorded spectra using the transpose of the encoding matrix, H:
| [1] |
where, in this example, M is of dimension 2, H is of dimension 4 × 2, and N is of dimension 4.
In order to reconstruct the edited spectrum of each molecule, the ON scans (with respect to that molecule) are summed and the OFF scans (with respect to that molecule) are subtracted from them. Because the columns of the Hadamard matrix are orthogonal, each combination contains no edited signal from the other molecule.
Figure 1b also demonstrates that the fourth Hadamard combination of the four-step scheme can be used to edit a third molecule without increasing the scan time. For four to seven molecules, a total of eight scans are required with different combinations of editing pulses, as shown in Figure 1c. In general, for Hadamard matrices with 4n columns, up to (4n-1) molecules can in principle be edited. In these ideal cases, it is assumed that the target resonances are separated by more than the bandwidth of the editing pulses such that selective excitation of each is possible. By acquiring signals from multiple compounds simultaneously, HERMES of n species potentially gives a theoretical √n benefit in temporal SNR compared to sequentially acquiring spectra from each compound.
Theory: Example for Editing and Separation of NAA and NAAG
As shown in Figure 2, the aspartyl moiety of NAA makes an ABX spin system with three doublets of doublets at 2.49, 2.67, and 4.38 ppm (11). N-acetyl aspartyl glutamate has a similar structure, consisting of NAA bonded to glutamate, with aspartyl multiplets at 2.52, 2.72, and 4.61 ppm. Because of the similarity between the structures of NAA and NAAG, it is difficult to distinguish between the spectra of the two molecules, particularly at lower field strengths (e.g., 1.5 or 3.0T). Previous efforts to differentiate them have used either model-based fitting of conventional, nonedited spectra using the slight difference in chemical shift of the N-acetyl resonances (2.01 vs. 2.04 ppm), which is difficult unless extremely good field homogeneity/stability is achieved (12,13), or have required two separate J-difference editing acquisitions, each optimized to detect one of the molecules at a time (2,14). The editing approach takes advantage of the chemical shift difference between their aspartyl-alpha spins at 4.38 ppm (NAA) and 4.61 ppm (NAAG) in order to detect the aspartyl-beta resonances between 2.5 and 2.7 ppm. This approach works well but does require two separate scans (i.e., double the scan time) in order to measure both NAA and NAAG. This article demonstrates that is possible to edit (and distinguish between) the two molecules (NAA and NAAG) simultaneously within a single acquisition using the HERMES scheme.
Fig. 2.
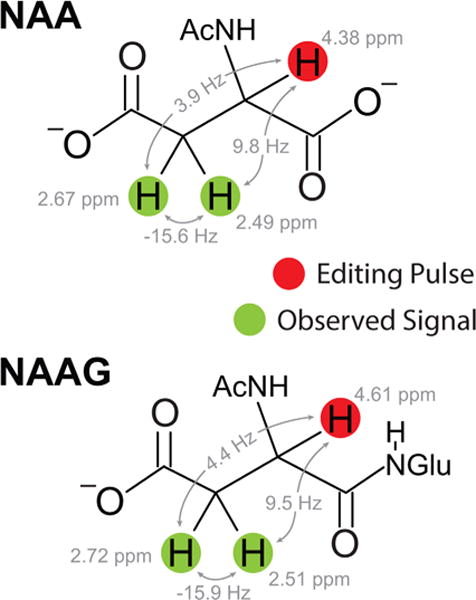
Chemical structures of NAA and NAAG, including the spin-system parameters of the aspartyl moieties, which are targeted by HERMES experiments.
As discussed above, four HERMES experiments are needed: A (NAA ON, NAAG ON), B (NAA ON, NAAG OFF), C (NAA OFF, NAAG ON), and D (NAA OFF, NAAG OFF). In order to generate the difference spectrum for NAA, the NAA-OFF scans are subtracted from the NAA-ON scans, that is, A + B − C−D. Similarly, subtracting the NAAG-OFF scans from the NAAG-ON scans gives the difference spectrum for NAAG, that is, A − B + C − D. Note that each subtraction is balanced with respect to the treatment of the other target—from the point-of-view of NAA, the NAAG difference combination is ON − ON + OFF − OFF. Therefore, no NAA signal is expected in the NAAG difference spectrum and vice versa.
METHODS
Simulations
Density-matrix simulations were performed for a B0 field strength of 3 Tesla using FID appliance, a MATLAB-based software package (15), with NAA and NAAG chemical shifts and coupling constants taken from reference 11, as shown in Figure 2. A 2,048-point free induction decay was simulated with 2 kHz spectral width, apodized with an 8-Hz exponential filter, zero-filled to 8,192 datapoints, and Fourier transformed. The excitation pulse was assumed to be an ideal 90-degree rotation around the x-axis. All simulations and experiments used single-lobe sinc-Gaussian editing pulses (16) and conventional amplitude-modulated slice-selective refocusing pulses (17,18); only the center of the voxel was simulated.
Echo Time
To determine the optimal echo time (TE) for the edited signal for both NAA and NAAG, separate MEGA-point resolved spectroscopy (PRESS) pulse sequences were simulated from TE 70 ms to TE 210 ms at 5 ms increments (19). This was done with 20 ms editing pulses placed at 10 ppm in the OFF acquisition, and at 4.38 ppm and 4.61 ppm to invert the NAA and NAAG alpha-aspartyl spins, respectively, in the ON acquisitions. Bloch equation simulations of the inversion efficiency of the editing pulses as a function of frequency offset for different pulse durations were also performed in order to determine which editing pulse selectivity is required to ensure selective editing of NAA and NAAG in the HERMES acquisition.
HERMES
Based on the implementation shown in Figure 3, HERMES NAA/NAAG editing was simulated. Experiment A (ON, ON) was performed with 10 ms editing pulses, applied at 4.5 ppm, to invert both the NAA spins at 4.38 ppm and the NAAG spins at 4.61 ppm. Experiments B (ON, OFF) and C (OFF, ON) were performed with more selective 45 ms editing pulses, applied at 4.38 ppm to invert the NAA spins and at 4.62 ppm to invert the NAAG spins, respectively. The editing pulse to invert the NAAG spins were placed slightly off-resonance at 4.62 ppm as opposed to 4.61 ppm to reduce the inversion of the nearby NAA spins at 4.38 ppm. To further suppress residual NAA signal in the NAAG spectrum (because NAA is several times more abundant than NAAG), Experiment D was performed with 45 ms editing pulses placed at 4.14 ppm such that pulses in C and D are symmetrical about NAA at 4.38 ppm (2,20). From these simulations, the NAA-edited spectrum was generated from the combination (A + B − C − D) and the NAAG-edited spectrum from the (A − B + C − D). Experiments were simulated for the NAA and NAAG spin systems independently, and NAA-edited and NAAG-edited combination spectra were calculated for each (according to the table in Fig. 3); only peaks at ~2.6 ppm were plotted.
Fig. 3.
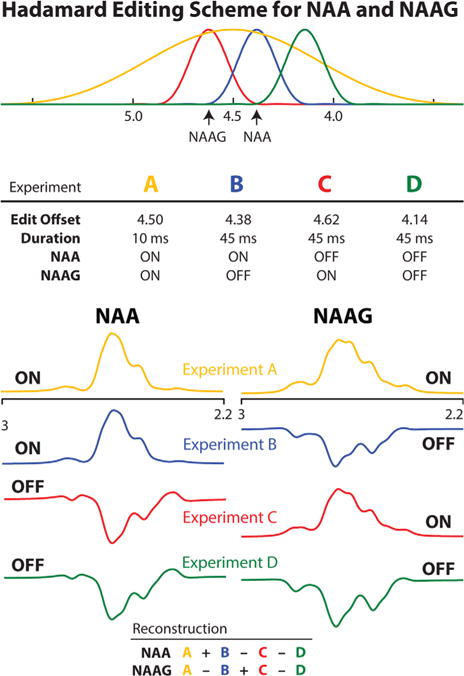
Schematic diagram of the HERMES editing scheme for NAA and NAAG. Four experiments are acquired with editing pulse offsets and durations, as specified in the top table. The inversion envelopes of the editing pulses are plotted above the top table and color-coded by experiment. The table at the bottom shows the Hadamard combinations that correspond to the difference-edited spectra for NAA and NAAG.
Unwanted crosstalk (e.g., NAA signal in the NAAG spectrum) was quantified using a root-mean-squared (RMS) approach because the phase of such signals is variable. Crosstalk RMS values are expressed as a percentage of the signal in the intended reconstructed spectra for the same molecule. The NAA crosstalk into the NAAG spectrum was also calculated for an acquisition, with the editing pulse in experiment D placed at 10 ppm (the true-OFF-OFF case).
To determine the possibility of coediting other molecules in the NAA- and NAAG-edited spectra, other brain metabolites with target spins in the range 5.5 ppm to 3.5 ppm (the full inversion range of the least selective editing pulse) and with coupled spins in proximity of the detected NAA and NAAG peaks at 2.6 ppm, were simulated in the same way. The NAA and NAAG reconstructed spectra for these metabolites (glutamate, glutamine, glutathione, and aspartate) were then plotted assuming equimolar concentrations. The fractional editing of the most highly coedited metabolites in the HERMES experiment were calculated relative to the edited signal achieved in a MEGA-PRESS experiment, with ON pulses applied on-resonance for each particular metabolite.
Phantom Experiments
HERMES experiments were performed using two separate 100 mL spherical phantoms, one containing NAA (10 mM, pH 7.2) and one containing NAAG (10 mM, pH 7.2), on a Philips Achieva 3T scanner (Philips Healthcare, Best, The Netherlands) using an eight-channel phased-array knee coil for receive. The body coil (B1 = 13.5 μT) was used for transmitting radiofrequency pulses.
Scan parameters were the same as the simulations above, with repetition time (TR) of 2.2 s, TE of 150 ms, chemical shift selective (CHESS) water suppression with a 2.4 × 2.4 × 2.4 cm3 voxel, and 16 averages. Spectra were line-broadened using a 6.5-Hz exponential filter and reconstructed to generate NAA- and NAAG-edited spectra for each phantom (Eq. [1]), including crosstalk reconstructions (the NAAG-edited spectrum for the NAA phantom) and vice versa, were also calculated to estimate the amount of coediting of the unwanted signals. Percentage crosstalk values for both NAA and NAAG were calculated as in the simulations.
In Vivo Experiments
HERMES experiments were performed as in the simulations in 12 healthy adults (3 male, 9 female; age 28 ± 6 years) in a 5 × 3 × 3 cm3 voxel in the right centrum semiovale on a Philips Achieva 3T scanner (Philips Healthcare, Best, The Netherlands), using the body coil for transmit and a 32-channel phased-array head coil for receive. Other scan parameters were VAPOR water suppression (21), 384 averages, TR 2.2 s, TE 150 ms, and a total scan time of 15 minutes. Prospective frequency correction for field drift during the scan was performed based on the water frequency of water-unsuppressed scans from the localized voxel, which were acquired every 24 averages (i.e., every ~53 seconds).
Postprocessing included phase-and-frequency correction of individual transients prior to HERMES reconstruction, based on the NAA acetyl peak using the Gannet program (22). Frequency correction based on the NAA acetyl peak was preferred over use of the residual water peak because the editing pulses applied at 4.5 ppm (experiment A in Fig. 3) and 4.62 ppm (experiment C in Fig. 3) partially invert the water peak at 4.68 ppm. HERMES reconstruction to give separate NAA- and NAAG-edited spectra was performed according to Eq. [1].
A model based on simulated NAA- and NAAG-edited spectra, line-broadened by a 3.5 Hz exponential filter to match the linewidths of in vivo data, was used to fit the in vivo spectra. Both in vivo and simulated NAA- and NAAG-edited spectra were zero-filled to 4,096 data points. In vivo data were not line-broadened prior to fitting. The glutathione resonance that coedits in the NAAG reconstruction was also included in the model as a Gaussian peak centered at 2.95 ppm. The percentage standard error in the amplitude coefficient of the fits was calculated to determine the uncertainty in the fits. After fitting, in vivo spectra were line-broadened using a 5 Hz exponential filter and zero-filled to 32k points for display purposes.
The 2-ppm N-acetyl singlet in the HERMES sum (A + B + C + D) spectrum was modeled as a Lorentzian lineshape in Gannet to determine the peak integral ANA. The total N-acetyl concentration was estimated relative to the unsuppressed water signal from the same volume (modeled as a Lorentz-Gaussian to determine AW) according to the following equation:
| [2] |
where cW is the MR-visible water concentration in white matter (23); T1W and T2W are the longitudinal and transverse relaxation times of water in white matter (23); T1NA and T2NA are the longitudinal and trans-verse relaxation times of the N-acetyl methyl signal (24); and nW and nNA are 2 and 3, respectively, the numbers of protons contributing to each signal. For each subject, separate concentrations of NAA and NAAG were determined by dividing cNA according to the calculated NAA:NAAG ratio.
RESULTS
Figure 4a shows the simulated TE modulation of the edited NAA and NAAG multiplets. Both have similar modulation as a function of TE, with maximal peak intensities at TEs between 130 ms to 160 ms, but are slightly offset from one another with the NAA maxima occurring ~10 ms after the NAAG (because the couplings are slightly different, as shown in Fig. 2). This becomes more apparent from the integrals in Figure 4b, which show that the maximal difference signal intensities of the detected NAA spectra are shifted toward longer TEs relative to the detected NAAG spectra. Based on these data, a TE of 150 ms was chosen for HERMES NAA/NAAG detection to maximize the signal intensity of NAAG, which has substantially lower in vivo concentration, while still maintaining a high NAA signal. The longer TE also allows the use of the highly selective (45 ms) editing pulses necessary for HERMES NAA/NAAG experiments B, C, and D (as in Fig. 3).
Fig. 4.
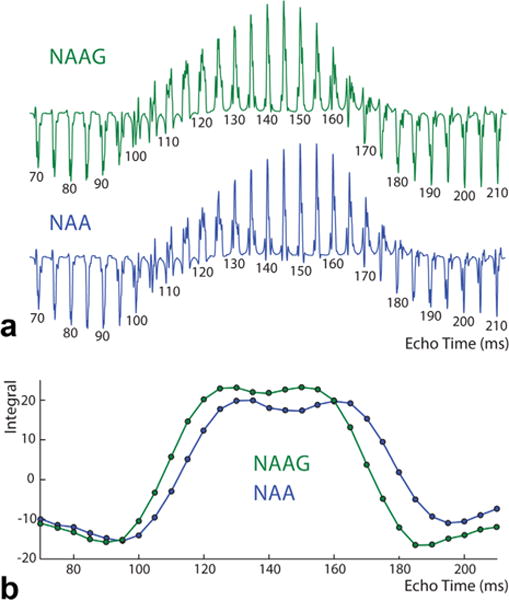
Simulations of MEGA-PRESS editing of NAA and NAAG at a range of echo times. Spectra (~2.6 ppm resonance) are shown in (a) and the corresponding integral (peak area) in (b). An echo time of 150 ms was selected for subsequent experiments, based on high editing efficiency for NAAG and to allow sufficient time for long, highly selective editing pulses to be used.
Spectra from the HERMES simulations and phantom experiments demonstrate excellent agreement in both the multiplet patterns of NAA and NAAG in their respective reconstructions and the degree of residual crosstalk (Fig. 4). Root-mean-squared crosstalk of NAA into the NAAG reconstruction with the editing pulse in experiment D placed at 10 ppm was 3.7%. This was reduced to 2.8% by placing that editing pulse at 4.14 ppm. This low crossover was preserved in the NAA phantom experiments where the % RMSE was 4.1%. The RMS crosstalk of NAAG into the NAA reconstruction in the simulations was 9.4%, which is consistent with the crosstalk in NAAG-phantom experiments of 9.0%. These multiplet patterns were conserved in the in vivo spectra, as shown in Figure 6a. Both the in vivo NAA and NAAG multiplet patterns and relative signal intensities were consistent between subjects, as shown in Figure 6b. Representative fits to the in vivo data (Fig. 6c) show that the simulated spectra fit the in vivo data well. This is reflected in the standard errors of the fitted amplitude coefficients, which were 1.3 ± 0.06% for NAA and 2.7 ± 0.5% for NAAG. Quantifying the NAA:NAAG concentration ratio based on these fits, an average value of 4.22:1 (standard deviation [SD]: ±0.66) was found. The NAAG and NAA concentrations were calculated as 1.85 ± 0.33 mmol/dm3 and 7.81 ± 0.79 mmol/dm3, respectively (mean ± standard deviation), in good agreement with literature values (2,12,14).
Fig. 6.
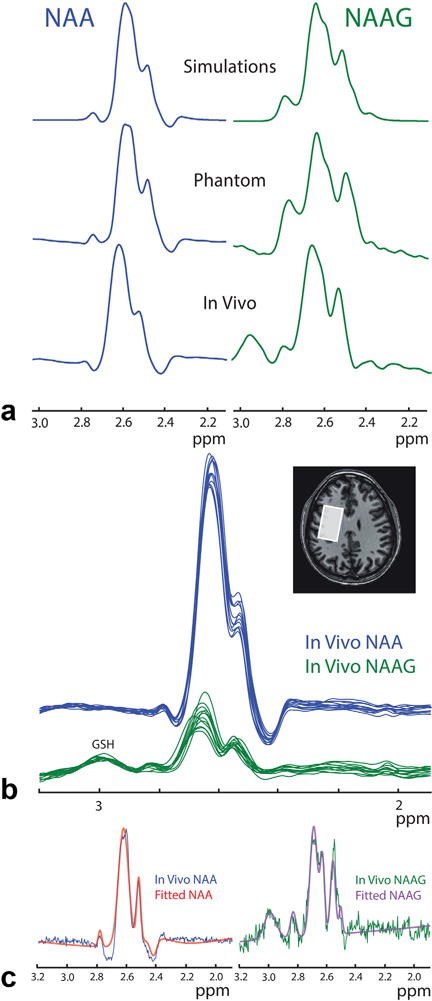
In vivo HERMES editing of NAA and NAAG. (a) In vivo multiplet patterns show good visual agreement between simulations, phantom experiments, and in vivo experiments (shown here for representative NAA and NAAG spectra), indicating good separation of NAA and NAAG in vivo. (b) In vivo multiplet patterns are consistent across all 12 subjects for both NAA and NAAG, as edited by HERMES. (c) Fitting of the in vivo data (shown for one subject) was performed based on the simulations in order to extract the NAA:NAAG concentration ratio.
Figure 7a shows the compounds potentially coedited by the HERMES NAA/NAAG experiment. Glutamate, glutamine, glutathione (cysteine and glutamate moieties), and aspartate have multiplets close to the range of the detected NAA/NAAG peaks at ~2.6 ppm. In the HERMES NAA/NAAG simulations of these compounds (Fig. 7b), however, only aspartate results in overlapping signals in the detected range in both the NAA and NAAG reconstructions, at a level of about 5% of the signal achieved in an aspartate-targeted MEGA-PRESS experiment. Glutathione gives a peak at 2.95 ppm, coediting in the NAAG-edited spectra at 78% (relative to a GSH-targeted MEGA-PRESS experiment) and in the NAA-edited spectra at 20%. This glutathione peak can also be seen in the NAAG reconstruction in vivo.
Fig. 7.
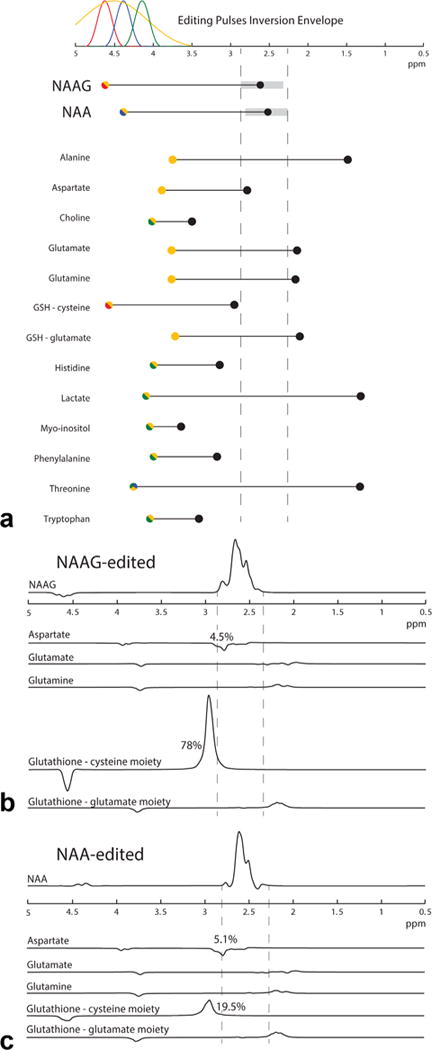
Coediting of other molecules in NAA/NAAG HERMES. (a) Plot of coupled spin systems that may coedit with NAA/NAAG. Spins that fall within the bandwidth of editing pulses applied in the HERMES experiment (shown by the colored Gaussian functions at the top) are color-coded accordingly. Species that are NAAG-like (color-coded yellow-red) tend to appear in the NAAG-edited combination. Species that are only inverted by the yellow (ON, ON) inversion pulse will appear equally in NAA and NAAG edited spectra. Dotted vertical lines mark the range of the detected NAA and NAAG edited signals. (b) Equimolar simulations of coedited spectra in the NAAG HERMES reconstruction. The most efficiently coedited species is the GSH-cysteine moiety, which appears in the NAAG-edited spectrum. Aspartate, glutamine, and GSH-Glu are coedited to similar degrees in NAA- and NAAG-edited spectra because they are only inverted by the yellow (ON, ON) pulse.
DISCUSSION
In this article, it is demonstrated that the simultaneous detection of more than one molecule is possible using HERMES. For the example given here for NAA and NAAG, HERMES gives minimal crosstalk in the reconstruction of two otherwise overlapping molecules. Although it is only demonstrated for two molecules here, as a Hadamard-based method, HERMES can in principle be applied to larger numbers of editing targets (or other pairs of compounds, such as GABA and overlapping coedited macromolecules). In principle, it should be possible to edit three molecules (e.g., NAA, NAAG, and aspartate) using a four-step Hadamard scheme. Hadamard editing methods have long been applied in high-resolution nuclear magnetic resonance to accelerate the acquisition of multiple one-dimensional experiments (25).
Simultaneous edited detection of multiple metabolites carries a temporal SNR advantage over consecutive measurements of √n, where n is the number of molecules simultaneously detected (as long as the SNR of the combined measurement is not compromised). In the case of time-resolved measurements of a dynamic system, such as pharmacological or functional (26) studies, simultaneous measurements are both scientifically preferable and increase the available temporal resolution by a factor of n.
The spin systems of NAA and NAAG are amenable to detection by HERMES because their editing target spins are sufficiently resolved that they can be separately inverted using highly selective (long-duration) editing pulses in experiments B and C. This is aided by the similar echo-time-dependence of both molecules with near-maximal signal intensity at a relatively long optimal TE, within which the long-duration editing pulses with sufficient frequency selectivity that are needed to separate NAA and NAAG can be accommodated. It is worth noting that these long editing pulses have narrow bandwidth and are therefore very susceptible to B0 field instabilities (13,27). For this reason, it was necessary to apply prospective field-frequency correction during the experiment based on voxel-localized B0 offset measurements.
The long editing pulses in experiment B and C, which ideally are fully ON for one molecule and fully OFF for the other, in fact do not perfectly invert just NAA or just NAAG. Bloch equation simulations of the pulses (as shown in Fig. 3) indicate a partial inversion of NAA in the NAAG-only experiment (1%) and vice versa. This will lead to crosstalk between the two experiments. Therefore, in experiment D the editing pulse is placed at 4.14 ppm, symmetrically about the 4.38 ppm NAA resonance relative to the experiment C. Thus, NAA spins are partially inverted to the same degree in C and D, which are subtracted for the NAAG spectrum, reducing the NAA contribution to the NAAG-edited spectrum by a quarter. Crosstalk of NAAG into the NAA spectrum is a lesser concern because NAA is the more highly concentrated of the two molecules. Although this scheme results in a slight reduction of NAA signal intensity in the NAA-edited spectra, this is also acceptable from an SNR viewpoint due to its higher concentration.
One potential consequence of the 4.14 ppm editing pulse in experiment D, however, is the coediting of additional compounds. It can be seen in Figure 7a that this pulse (as well as the less selective editing pulse used in experiment A) partially inverts aspartate at 3.89 ppm, which is coupled to aspartate signals at 2.65 and 2.8 ppm within the detected NAA/NAAG frequency range. Because the inversion of this aspartate spin is slight, and it only affects one of the four spectra used to form the final reconstruction, its contribution to the final NAA and NAAG reconstructions are minimal, as shown in Figure 7b. In addition, in vivo concentration of aspartate in the brain is believed to be relatively low (11,28).
Of the other potentially coedited compounds shown in Figure 7a, glutamate and glutamine, as well as the glutathione cysteine and glutamate moieties, have coupled spins whose signals appear in or near the detected NAA/NAAG region. The cysteine moiety of glutathione at 2.95 ppm strongly coedits in the NAAG reconstruction but not in the NAA reconstruction. The substantial representation of the cysteine moiety in the NAAG reconstruction is due to the inversion of glutathione spins at 4.56 ppm from both the editing pulse at 4.5 ppm (ON both NAA and NAAG) in experiment A and the editing pulse at 4.62 ppm (NAAG) in experiment C. The glutathione cysteine moiety coedits less in the NAA reconstruction because the editing pulse at 4.38 ppm (NAA) inverts the 4.56 glutathione spins to a much smaller degree. This glutathione peak can be seen in the in vivo NAAG reconstruction, as shown in Figure 6, but has relatively little influence on quantitation of the NAAG spectra because it is resolved from the observed NAAG peaks. Glutamate, glutamine, and the glutamate moiety of glutathione minimally coedit on both the reconstructed NAA and NAAG spectra because their corresponding target resonances are only partially inverted (16% for glutamate and glutamine and 18% for glutamate moiety of glutathione) by one of the four editing pulses.
Additional work is needed to further reduce the spillover of NAA into the NAAG reconstruction. More sophisticated fitting techniques using basis sets of individual molecules, for example, LCModel (29) or Tarquin (30), may also lessen the effects of coediting on the accuracy of determination of NAA and NAAG. To extend this technique for use in chemical shift imaging, good B0 homogeneity and stability would be needed.
It is interesting to consider the full 4 × 4 Hadamard reconstruction matrix. In addition to the NAA- and NAAG-edited difference spectra discussed, it is also possible to calculate the A + B + C + D and A−B−C+D combinations. The A + B + C + D sum spectrum contains those signals that are not affected by the editing pulses at full SNR, which may be useful for quantification of the nonedited spectral resonances. The A − B − C + D subtraction spectrum should not contain any signal from either edited or nonedited compounds; it may potentially be useful either as an empty spectrum from which to quantify subtraction artifacts, or as shown in Figure 1b, with a third editing pulse applied appropriately it would be possible to edit a third target molecule so as to appear in this spectrum. The Hadamard editing encoding is scalable to detect a large number of molecules, with four to seven molecules detectable with eight editing pulse combinations. The two-molecule approach demonstrated here may also be applicable to other pairs of molecules, for example, GABA and macromolecular signals at 3 ppm. Coediting of nonoverlapping signals will occur, as with MEGA-PRESS, and will further increase the number of metabolites that can be quantified with these experiments.
CONCLUSION
In conclusion, the HERMES method has been developed to allow the simultaneous and separable editing of two or more overlapping molecules with near-maximal sensitivity and is illustrated in detail for the example of NAA and NAAG. The method has the advantage of increased SNR compared to sequential measurements of individual molecules in the same total scan time. In healthy subjects, the method is shown to be reliable both in terms of the multiplet pattern of the spectra, as well as the absolute and relative concentrations of the two molecules, indicating minimal molecule crossover between the two reconstructed spectra. HERMES can be applied to other overlapping edited species, and extended to more than two compounds by appropriate experimental design and Hadamard reconstruction.
Fig. 5.
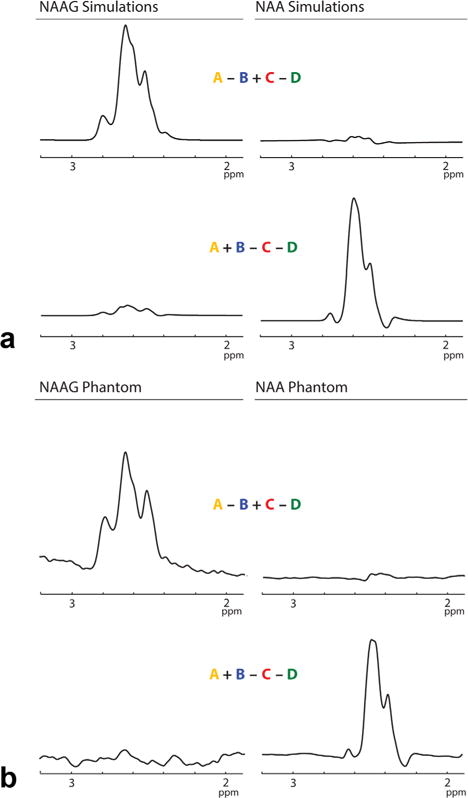
Simulations (a) and phantom data (b) demonstrate the excellent separation of NAA and NAAG signals into the desired HERMES recombination spectra with minimal metabolite crossover. The multiplet patterns of both NAA and NAAG are consistent between the simulated and reconstructed spectra.
Acknowledgments
Grant sponsor: National Institutes of Health; Grant numbers: R01 EB016089; P41 EB015909.
References
- 1.Barker PB, Lin DDM. In vivo proton MR spectroscopy of the human brain. Prog Nucl Magn Reson Spectrosc. 2006;49:99–128. [Google Scholar]
- 2.Edden RAE, Pomper MG, Barker PB. In vivo differentiation of N-acetyl aspartyl glutamate from N-acetyl aspartate at 3 Tesla. Magn Reson Med. 2007;57:977–982. doi: 10.1002/mrm.21234. [DOI] [PubMed] [Google Scholar]
- 3.Rothman DL, Petroff OA, Behar KL, Mattson RH. Localized 1H NMR measurements of gamma-aminobutyric acid in human brain in vivo. Proc Natl Acad Sci U S A. 1993;90:5662–5666. doi: 10.1073/pnas.90.12.5662. [DOI] [PMC free article] [PubMed] [Google Scholar]
- 4.Star-Lack J, Spielman D, Adalsteinsson E, et al. In vivo lactate editing with simultaneous detection of choline, creatine, NAA, and lipid singlets at 1.5 T using PRESS excitation with applications to the study of brain and head and neck tumors. J Magn Reson. 1998;133:243–254. doi: 10.1006/jmre.1998.1458. [DOI] [PubMed] [Google Scholar]
- 5.Terpstra M, Vaughan TJ, Ugurbil K, Lim KO, Schulz SC, Gruetter R. Validation of glutathione quantitation from STEAM spectra against edited 1H NMR spectroscopy at 4T: application to schizophrenia. Magn Reson Mater Phy. 2005;18:276–282. doi: 10.1007/s10334-005-0012-0. [DOI] [PubMed] [Google Scholar]
- 6.Choi C, Ganji SK, DeBerardinis RJ, et al. 2-hydroxyglutarate detection by magnetic resonance spectroscopy in IDH-mutated patients with gliomas. Nat Med. 2012;18:624–629. doi: 10.1038/nm.2682. [DOI] [PMC free article] [PubMed] [Google Scholar]
- 7.Terpstra M, Marjanska M, Henry PG, Tkáč I, Gruetter R. Detection of an antioxidant profile in the human brain in vivo via double editing with MEGA-PRESS. Magn Reson Med. 2006;56:1192–1199. doi: 10.1002/mrm.21086. [DOI] [PubMed] [Google Scholar]
- 8.Rae CD. A guide to the metabolic pathways and function of metabolites observed in human brain 1H magnetic resonance spectra. Neurochem Res. 2014;39:1–36. doi: 10.1007/s11064-013-1199-5. [DOI] [PubMed] [Google Scholar]
- 9.Coyle JT. The nagging question of the function of N-acetylaspartylglutamate. Neurobiol Dis. 1997;4:231–238. doi: 10.1006/nbdi.1997.0153. [DOI] [PubMed] [Google Scholar]
- 10.Hadamard J. Résolution d’une question relative aux déterminants. Bull Sci Math. 1893;17:240–248. [Google Scholar]
- 11.Govindaraju V, Young K, Maudsley AA. Proton NMR chemical shifts and coupling constants for brain metabolites. NMR Biomed. 2000;13:129–153. doi: 10.1002/1099-1492(200005)13:3<129::aid-nbm619>3.0.co;2-v. [DOI] [PubMed] [Google Scholar]
- 12.Pouwels PJ, Frahm J. Differential distribution of NAA and NAAG in human brain as determined by quantitative localized proton MRS. NMR Biomed. 1997;10:73–78. doi: 10.1002/(sici)1099-1492(199704)10:2<73::aid-nbm448>3.0.co;2-4. [DOI] [PubMed] [Google Scholar]
- 13.El-Sharkawy AM, Schar M, Bottomley PA, Atalar E. Monitoring and correcting spatio-temporal variations of the MR scanner’s static magnetic field. Magn Reson Mater Phy. 2006;19:223–236. doi: 10.1007/s10334-006-0050-2. [DOI] [PMC free article] [PubMed] [Google Scholar]
- 14.Choi C, Ghose S, Uh J, Patel A, Dimitrov IE, Lu H, Douglas D, Ganji S. Measurement of N-acetylaspartylglutamate in the human frontal brain by 1H-MRS at 7 T. Magn Reson Med. 2010;64:1247–1251. doi: 10.1002/mrm.22536. [DOI] [PMC free article] [PubMed] [Google Scholar]
- 15.Simpson R, Devenyi GA, Jezzard P, Hennessy TJ, Near J. Advanced processing and simulation of MRS data using the FID appliance (FID-A)-an open source, MATLAB-based toolkit. Magn Reson Med. 2015 doi: 10.1002/mrm.26091. [DOI] [PubMed] [Google Scholar]
- 16.Edden RAE, Puts NAJ, Barker PB. Macromolecule-suppressed GABA-edited magnetic resonance spectroscopy at 3T. Magn Reson Med. 2012;68:657–661. doi: 10.1002/mrm.24391. [DOI] [PMC free article] [PubMed] [Google Scholar]
- 17.Murdoch JB, Lent AH, Kritzer MR. Computer-optimized narrowband pulses for multislice imaging. J Magn Reson. 1987;74:226–263. [Google Scholar]
- 18.Edden RAE, Barker PB. If J doesn’t evolve, it won’t J-resolve: J-PRESS with bandwidth-limited refocusing pulses. Magn Reson Med. 2011;65:1509–1514. doi: 10.1002/mrm.22747. [DOI] [PMC free article] [PubMed] [Google Scholar]
- 19.Mescher M, Merkle H, Kirsch J, Garwood M, Gruetter R. Simultaneous in vivo spectral editing and water suppression. NMR Biomed. 1998;11:266–272. doi: 10.1002/(sici)1099-1492(199810)11:6<266::aid-nbm530>3.0.co;2-j. [DOI] [PubMed] [Google Scholar]
- 20.Henry PG, Dautry C, Hantraye P, Bloch G. Brain GABA editing without macromolecule contamination. Magn Reson Med. 2001;45:517–520. doi: 10.1002/1522-2594(200103)45:3<517::aid-mrm1068>3.0.co;2-6. [DOI] [PubMed] [Google Scholar]
- 21.Tkac I, Starcuk Z, Choi IY, Gruetter R. In vivo 1H NMR spectroscopy of rat brain at 1 ms echo time. Magn Reson Med. 1999;41:649–656. doi: 10.1002/(sici)1522-2594(199904)41:4<649::aid-mrm2>3.0.co;2-g. [DOI] [PubMed] [Google Scholar]
- 22.Edden RAE, Puts NA, Harris AD, Barker PB, Evans CJ. Gannet: a batch-processing tool for the quantitative analysis of gamma-aminobutyric acid-edited MR spectroscopy spectra. J Magn Reson Imaging. 2014;40:1445–1452. doi: 10.1002/jmri.24478. [DOI] [PMC free article] [PubMed] [Google Scholar]
- 23.Harris AD, Puts NAJ, Edden RAE. Tissue correction for GABA-edited MRS: considerations of voxel composition, tissue segmentation, and tissue relaxations. J Magn Reson Imaging. 2015;42:1431–1440. doi: 10.1002/jmri.24903. [DOI] [PMC free article] [PubMed] [Google Scholar]
- 24.Träber F, Block W, Lamerichs R, Gieseke J, Schild HH. 1H metabolite relaxation times at 3.0 tesla: measurements of T1 and T2 values in normal brain and determination of regional differences in transverse relaxation. J Magn Reson Imaging. 2004;19:537–545. doi: 10.1002/jmri.20053. [DOI] [PubMed] [Google Scholar]
- 25.Kupče Ē, Nishida T, Freeman R. Hadamard NMR spectroscopy. Prog NMR Spectrosc. 2003;42:95–122. [Google Scholar]
- 26.Landim RCG, Edden RAE, Foerster B, Li LM, Covolan RJM, Castellano G. Investigation of NAA and NAAG dynamics underlying visual stimulation using MEGA-PRESS in a functional MRS experiment. Magn Reson Imaging. 2015;34:239–245. doi: 10.1016/j.mri.2015.10.038. [DOI] [PMC free article] [PubMed] [Google Scholar]
- 27.Harris AD, Glaubitz B, Near J, John Evans C, Puts NAJ, Schmidt-Wilcke T, Tegenthoff M, Barker PB, Edden RAE. Impact of frequency drift on gamma-aminobutyric acid-edited MR spectroscopy. Magn Reson Med. 2014;72:941–948. doi: 10.1002/mrm.25009. [DOI] [PMC free article] [PubMed] [Google Scholar]
- 28.Tkéc I, Oz G, Adriany G, Uğurbil K, Gruetter R. In vivo 1H NMR spectroscopy of the human brain at high magnetic fields: metabolite quantification at 4T vs. 7T. Magn Reson Med. 2009;62:868–79. doi: 10.1002/mrm.22086. [DOI] [PMC free article] [PubMed] [Google Scholar]
- 29.Provencher SW. Automatic quantitation of localized in vivo 1H spectra with LCModel. NMR Biomed. 2001;14:260–264. doi: 10.1002/nbm.698. [DOI] [PubMed] [Google Scholar]
- 30.Wilson M, Reynolds G, Kauppinen RA, Arvanitis TN, Peet AC. A constrained least-squares approach to the automated quantitation of in vivo (1)H magnetic resonance spectroscopy data. Magn Reson Med. 2011;65:1–12. doi: 10.1002/mrm.22579. [DOI] [PubMed] [Google Scholar]


