

Abstract
Gemcitabine metabolites cause termination of DNA replication and induction of apoptosis. We determined whether subtherapeutic “microdoses” of gemcitabine are incorporated into DNA at levels that correlate to drug cytotoxicity. A pair of nearly isogenic bladder cancer cell lines differing in resistance to several chemotherapy drugs were treated with various concentrations of 14C-labeled gemcitabine for 4–24 hours. Drug incorporation into DNA was determined by accelerator mass spectrometry. A mechanistic analysis determined that RRM2, a DNA synthesis protein and a known resistance factor, substantially mediated gemcitabine toxicity. These results support gemcitabine levels in DNA as a potential biomarker of drug cytotoxicity.
Keywords: accelerator mass spectrometry, gemcitabine. drug resistance, antimetabolite, 2′-deoxynucleotide incorporation into DNA, bladder cancer
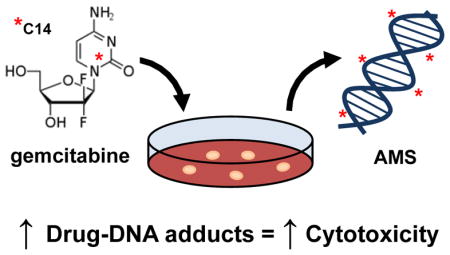
Graphical abstract
INTRODUCTION
Gemcitabine is a nucleoside analog that is commonly used to treat lung, bladder, breast, ovarian and other cancers.1 Even though it is often used as part of first line therapy, it is highly toxic and fewer than half of all tumors respond.2–9 Therefore, a diagnostic tool to better understand and even predict chemoresistance is needed. Gemcitabine kills cells mainly through termination of DNA replication.1 Gemcitabine is metabolized by deoxycytidine kinase and other enzymes into gemcitabine di- and triphosphates, and is incorporated into genomic DNA to interrupt DNA replication and induce apoptosis. Furthermore, the diphosphate metabolite irreversibly inactivates the enzyme ribonucleotide reductase (RNR), which then limits the availability of nucleotides for DNA synthesis. Hence, we hypothesize that the level of gemcitabine incorporated into genomic DNA is a useful biomarker of drug resistance.
We report the development of a non-toxic microdosing approach to determine the incorporation of gemcitabine into genomic DNA with the goal of someday predicting tumor response to gemcitabine-based chemotherapy. To show proof of principle, we used two nearly isogenic urinary bladder cancer cell lines, 5637 and 5637R, to assess differences in drug resistance.10 In this study, the bladder cancer cell lines were treated with 14C-labeled gemcitabine followed by DNA isolation, conversion to graphite, and radiocarbon analysis by accelerator mass spectrometry (AMS). AMS measures the ratio of 14C to total carbon in the DNA allowing for the calculation of gemcitabine incorporation per genome. The cells were also assessed for their relative drug resistance, ability to uptake and efflux gemcitabine, replication rate via BrdU incorporation and the expression of selected proteins associated with chemotherapy drug resistance.
EXPERIMENTAL PROCEDURES
Drugs
Gemzar (Gemcitabine HCl) at 38 mg/ml was generously supplied from the UC Davis Comprehensive Cancer Center pharmacy and 14C-labeled gemcitabine (specific activity of 58.8 mCi/mmol) was purchased from Moravek Biochemicals (Brea, CA). Unlabeled gemcitabine was supplemented with 1000 dpm/ml 14C-labeled gemcitabine immediately prior to dosing cells.
Cell lines
The 5637 (HTB-9) human bladder cancer cell line was purchased from American Type Culture Collection (ATCC, Manassas, VA). Cells were grown in RPMI-1640 media with 10% FBS, 100U/ml penicillin, 100 μg/ml streptomycin, and 1 mM sodium pyruvate at 37ºC in a humidified incubator. The 5637R oxaliplatin-resistant cell line was developed by culturing the 5637 cells with a stepwise increase of oxaliplatin concentration for ten months as described and sensitivities to other bladder cancer therapeutics tested by MTS assay.10
Gemcitabine treatment and AMS analysis
Approximately one million 5637 or 5637R cells were seeded in 60-mm dishes and allowed to attach overnight. At t = 0 hours, cells were dosed with 0.008 μM 14C-labeled gemcitabine (1000 dpm/ml) supplemented with 0.03 μM (low dose) or 0.3 μM (high dose) unlabeled gemcitabine. Unlabeled gemcitabine is mixed with 14C-labeled gemcitabine to reduce the amount of radioactive material used. After a 4-hour incubation, the cells were washed three times with PBS and cultured in drug-free media for an additional 0 to 44 hours. The 4-hour treatment period was used to mimic the half-life of gemcitabine in vivo.11 For comparison, cells were incubated with 14C-labeled gemcitabine continuously for 24 hours. DNA was isolated at selected time points using the Wizard Genomic DNA Purification Kit (Promega, Madison, WI). Ten micrograms of DNA from each sample was converted to graphite and the ratio of 14C to total C (reported in units of Fraction Modern) were measured by accelerator mass spectrometry (AMS) as previously described.12 AMS was performed on DNA samples from three biological replicates and the resulting Fraction Modern values were converted to gemcitabine equivalents per million nucleotides using the amount of carrier carbon, mass of DNA, the average molecular mass of a nucleotide and the specific activity of the 14C-labeled gemcitabine as conversion factors. Box plots show median values with min and max values. Significance was determined using unpaired t-tests in GraphPad Prism. Significance was determined using unpaired t-tests in GraphPad Prism.
BrdU incorporation
Cells were plated on 96-well plates at a density of 10,000 cells per well and allowed to attach overnight. At 0 hours, the cells were treated with either a gemcitabine low dose (0.03 μM) or high dose (0.3 μM) for 4 hours, followed by three PBS washes, and incubation with drug-free media for an additional 0 to 20 hours. Two hours prior to each time point, the cells were incubated with BrdU, fixed, and BrdU incorporation level was determined using the bromo-2′-deoxy-uridine labeling and detection kit III (Roche, Indianapolis, IN). Box plots show median values with min and max values of three biological replicates. Significance was determined using unpaired t-tests in GraphPad Prism.
Cell Uptake/Efflux
Approximately 350,000 cells per well were plated into 6-well plates and allowed to attach overnight. At 0 hours, the cells were dosed with 0.03 μM (5000 dpm/ml) 14C-labeled gemcitabine. To determine uptake, the cells were continuously treated for 0, 4, 24, and 48 hours, washed three times with PBS, trypsinized, and the intracellular 14C level was determined by a liquid scintillation counter (LSC). For efflux, the cells were dosed for 4 hours, washed three times with PBS, and cultured in drug-free medium for an additional 0, 4, 20, and 44 hours. At these time points, 14C levels in the media were determined by LSC. Drug-free medium was used as a blank control. Values are shown as mean ng/ml 14C-labeled gemcitabine with standard deviation of three biological replicates.
RRM2 knockdown and MTS
Approximately 500,000 cells were seeded per 60-mm dish and allowed to attach overnight. The cells were transfected with control siRNA-A or RRM2 siRNA using the siRNA reagent system and transfection protocol (Santa Cruz Biotechnology, Santa Cruz, CA). After a 5-hour incubation, the transfection mixture was removed and cells were incubated with complete medium overnight. The transfected cells were seeded at 4,000 cells per well in 96-well plates and allowed to attach overnight. The cells were then incubated with increasing doses of gemcitabine for 72 hours. IC50 values were determined using the CellTiter 96 Aqueous Non-Radioactive Cell Proliferation Assay (Promega). Log survival plot shows mean with SD error bars from three biological replicates. Significance was determine by an unpaired t-test of IC50 values from three biological replicates using GraphPad Prism. RRM2 protein levels were determined by Western blot using RRM2 antibody (sc-10846, Santa Cruz Biotechnology).
RRM2 knockdown and AMS analysis
For RRM2 siRNA knockdown, cells were seeded at 250,000 cells per 60-mm dish and allowed to attach overnight. At 0 hours, the cells were transfected with control siRNA-A or RRM2 siRNA as described above. After a 5-hour incubation, the transfection mixture was removed and cells were incubated with drug-free medium for an additional 40 hours. At 44 hours, the cells were dosed with 0.008 μM 14C-labeled gemcitabine at 1000 dpm/ml supplemented to 0.03 μM with unlabeled gemcitabine. After a 4-hour incubation, the cells were washed three times in PBS, and collected. DNA was isolated and gemcitabine DNA incorporation levels were determined as described above. RRM2 protein levels were determined by Western blot of total cell lysates collected 48 hours after siRNA transfection.
qRT-PCR
RNA was isolated from three biological replicates of subconfluent cultures of 5637 and 5637R cells using the Qiagen RNeasy Mini Kit according to the manufacturer’s instructions. cDNA was synthesized using the Thermo Scientific RevertAid RT kit. qRT-PCR was performed using the EconoTaq PLUS 2X master mix on a BioRad CFX96 Real-Time System instrument in triplicate. The following primers were used: ERCC1 (CTACGCCGAATATGCCATCTC, GTACGGGATTGCCCCTCTG), hENT1 (GTGCCTTCGGCTACTTTATCAC, GCTAATGAGGTCCAACTTGGTCT), RRM1 (GCCGCCAAGAACGAGTCAT, AGCAGCCAAAGTATCTAGTTCCA), RRM2 (GTGGAGCGATTTAGCCAAGAA, CACAAGGCATCGTTTCAATGG), and GAPDH (CGCGGGGCTCTCCAGAACATC, CTCCGACGCCTGCTTCACCAC). Significance was determined by unpaired t-tests of at three biological replicates using GraphPad Prism.
RESULTS AND DISCUSSION
We previously described the generation of a drug resistant derivative of the ATCC 5637 bladder cancer cell line called 5637R, which has an approximately 10-fold higher gemcitabine IC50 (1.44 μM vs 0.12 μM for 5637R versus 5637, respectively).10 This pair of cell lines were dosed with 14C-labeled gemcitabine (Figure 1A) at increasing concentrations from 0.0015–1.5 μM for 4 hours and harvested for DNA extraction and analysis for radiocarbon content by AMS as previously described.13 Incorporation of gemcitabine into genomic DNA increased with drug concentration in both cell lines (Figure 1B). However, the dose response was nonlinear, which is expected since gemcitabine is a prodrug that needs to be metabolized prior to incorporation into DNA.
Figure 1.

Gemcitabine incorporation into DNA can be measured by AMS. A. Structure of 14C-labeled gemcitabine.. B. 5637 and 5637R cells were dosed with 0-1.5 μM gemcitabine for 4h followed by AMS analysis of purified genomic DNA. Gemcitabine-DNA incorporation is reported as gemcitabine equivalents per million nucleotides. Error bars indicate the SD from three biological replicates. * indicates p = 0.001 for the AUC differences in the two cell lines using an unpaired t-test.
The area under the curve (AUC) of drug-DNA incorporation for gemcitabine dose range of 0.015–0.3 μM was statistically higher for the 5637 cells compared to the resistant 5637R cells (1.27 vs 0.77 gemcitabine equivalents/million nt × μM gemcitabine, respectively, p = 0.001). At 0.03 μM, 5637 cells had significantly higher gemcitabine-DNA incorporation levels than the 5637R cells at both 4h (3.00 vs 0.92 gemcitabine equivalents/million nt, p < 0.001) and 24h (4.00 vs 2.13 gemcitabine equivalents/million nt, p < 0.005) time points (Figure 2A). At the two highest concentrations of 0.3 and 1.5 μM, the differences were not statistically significant, likely because many cells had died (Figure 2B).
Figure 2.

Gemcitabine incorporation into DNA in the 5637 and 5637R cell lines. A/B. 5637 and 5637R cell were treated with a “low” (0.03 μM) or “high” (0.3 μM) concentration of gemcitabine supplemented with 1000 dpm/ml 14C-labeled gemitabine for 0h, 4h, or 4h + 20h (24h) with supplemental fresh media then harvested for AMS analysis. C/D. 5637 and 5637R cells were treated the same as in A/B followed by fixation and quantification of relative BrdU incorporation. E/F. Gemcitabine-DNA incorporation levels in A/B were normalized using the relative BrdU incorporation from C/D. Box plots show median value with min and max values of three biological replicates. * indicates p ≤ 0.05 determined using an unpaired t-test
Since gemcitabine is preferentially incorporated into cells during S-phase, its uptake is frequently normalized to some measure of proliferation or DNA synthesis, such as BrdU uptake. Using the same treatment times and drug doses, both cell lines were treated with unlabeled gemcitabine with the addition of BrdU during the last 2 hours of treatment. The cells were then fixed and the relative BrdU levels were determined. The two cell lines had similar levels of BrdU incorporation at 0h (1.2 vs 1.1, p = 0.41). The relative BrdU incorporation of the two cell lines showed no statistical difference at the low dose (Figure 2C). The next highest dose caused an approximate 50% drop in BrdU incorporation after 4h and 24h in both cell lines (0.52 vs 0.51 relative BrdU incorporation, p = 0.92 at 4h, 0.46 vs 0.58 relative BrdU incorporation, p = 0.13 at 24h) for 5637 and 5637R, respectively. At the highest dose, the BrdU incorporation decreased approximately 70–80%, with the 5637 cell line having the lowest BrdU incorporation at both 4 and 24h (0.16 vs 0.27 relative BrdU incorporation, p < 0.005 at 4h, 0.37 vs 0.56 relative BrdU incorporation, p = 0.011 at 24h) (Figure 2D). The BrdU incorporation data were used to normalize the gemcitabine-DNA incorporation levels for cellular differences in DNA synthesis. Both time points at the low and high doses showed significant differences between the 5637 and 5637R cells (Figure 2E/F). In the high dose samples, normalizing the gemcitabine-DNA incorporation with the BrdU-incorporation levels led to a more defined separation in the incorporation levels between the 5637 and 5637R cells.
Multiple factors can influence cellular drug sensitivity including drug uptake, efflux, and DNA repair (SI Figure 1). To test if cellular uptake influenced the sensitivity of these cell lines, they were dosed with 14C-labeled gemcitabine and cellular levels of 14C were measured using a liquid scintillation counter (LSC). At each time point, the 5637 cells had lower levels of intracellular gemcitabine than the 5637R cells (9.47 vs 22.51 ng/ml gemcitabine at 4h, 17.20 vs 28.21 ng/ml gemcitabine at 24h, 6.72 vs 33.67 ng/ml gemcitabine at 48h, respectively, SI Figure 1A). Interestingly, after the 24h time point, the intracellular gemcitabine levels decreased in the 5637 cells but not in the 5637R cells. Overall, gemcitabine influx in these cell lines was opposite of that expected with respect to drug resistance. To determine the efflux of gemcitabine, the cells were treated with 14C-labeled gemcitabine for 4h, washed and incubated with drug-free media, and then 14C levels in the media were determined by LSC. The 5637R cells had a rapid efflux of gemcitabine in the first 4 hours, followed by a decline in gemcitabine efflux over the following 44 hours (SI Figure 1B). The 5637 cells had a gradual increase in gemcitabine efflux over the 48 hours. Overall, this data suggests that gemcitabine efflux did not play a role in gemcitabine resistance for this cell line model system.
As previously described, the 5637 and 5637R cell lines were analyzed by RNAseq, which found an increase in ribonucleotide reductase M2 (RRM2) mRNA in one of the replicates10 Accordingly, we performed qRT-PCR of several selected mRNAs associated with drug resistance, including hENT1, RRM1, RRM2, and ERCC1. Ribonucleotide reductase (formed by RRM1 and RRM2 heterodimers) is inhibited by gemcitabine metabolites and increased levels of these proteins can reduce gemcitabine sensitivity1 We investigated further the role of RRM2 in our paired cell lines. Knockdown with RRM2-specific siRNA significantly reduced RRM2 mRNA levels in both cell lines (Figure 3A). Interestingly, RRM2 knockdown in the 5637R cell line caused a significant increase in gemcitabine sensitivity (IC50 = 1.65 μM vs 0.96 μM, p = 0.041) and gemcitabine-DNA incorporation increased (0.19 vs. 0.26 gemcitabine equivalents/million nt, compared to untransfected 5637R, p = 0.053) (Figure 3C). Clearly, RRM2 plays a role in mediating gemcitabine resistance in this model system.
Figure 3.

RRM2 levels are elevated in 5637R cells and its knockdown increases gemcitabine sensitivity. A. 5637 and 5637R cells were transfected with control or RRM2 siRNA for 48 hours followed by Western blot to detect RRM2 and tubulin protein levels. B. 5637 and 5637R cells were transfected with scrambled control (C) or RRM2 siRNA (R) for 48 hours followed by treatment with increasing concentrations of gemcitabine for 72 hours and cell viability determined by MTS. Log survival plot shows mean with SD error bars. C. 5637 and 5637R cells were transfected with control or RRM2 siRNA for 48 hours followed by a 4-hour treatment with 0.03 μM gemcitabine and collected for AMS analysis. Box plots show median value with min and max values of three biological replicates. * indicates p ≤ 0.05 determined by unpaired t-test of IC50 values from three biological replicates
Several nucleoside transporters can transport gemcitabine into the cell, however, hENT1 appears to be the main transporter.1 Decreased levels of hENT1 can lead to lower gemcitabine sensitivity in cell studies and cancer patients.1, 14, 15 In contrast, we observed a higher level of hENT1 in our resistant cell line, consistent with our finding of higher gemcitabine uptake (Table 1). The resistant cell line also has a rapid efflux of gemcitabine initially but the sensitive cell line shows higher levels of efflux over the 48 hours of treatment, similarly indicating that efflux may not be significantly involved in the resistance of the 5637R cells (SI Figure 1B).
Once inside the cell, gemcitabine is phosphorylated to dFdCMP and subsequently to its active forms, dFdCDP and dFdCTP. Deoxycytidine kinase (dCK) is the main kinase involved in gemcitabine phosphorylation and its deficiency can cause resistance but it has not been shown to be a good biomarker in clinical trials.1 The main mechanism of gemcitabine activity is incorporation into DNA, which results in termination of chain elongation.16 This modification is not frequently detected or repaired by DNA repair enzymes because these gemcitabine equivalents are not in the terminal position, consistent with our findings of no or very low levels of DNA repair of the gemcitabine equivalents in these cells (SI Figure 1E).
In order to assess DNA repair, the cells were treated with 14C-labeled gemcitabine for 24h (simulating continuous infusion) or 4h followed by 20h with drug-free media (simulating a bolus dose) (SI Figure 1C/D). The 20h incubation without drug in the bolus treatment group allows enough time for DNA repair processes to occur and lower gemcitabine-DNA levels would be expected if DNA repair was occurring. The rate of DNA repair was calculated from the difference in the gemcitabine incorporation level between the bolus and continuous doses and was reported as gemcitabine equivalents/million nt per hour. However, no DNA repair was observed in any group (SI Figure 1E), because at both low and high doses, the two cell lines showed lower gemcitabine incorporation levels with the continuous dose than the bolus dose.
We initiated this study in order to determine the utility of measuring gemcitabine incorporation into DNA as a probe of drug resistance. This effort was motivated by needs to both further refine our understanding of gemcitabine drug resistance and to lay the foundation for translational studies aimed at predicting drug resistance in individual patients.2, 3, 5–7, 9 Our group has previously reported the use of accelerator mass spectrometry (AMS) to measure drug-DNA adduct levels as a biomarker for alkylating agents such as carboplatin and oxaliplatin sensitivity.10, 11, 17, 18
A limited number of groups have quantified gemcitabine incorporation into DNA and/or RNA. The majority of these efforts involved treating various types of cancer cell lines (including lung, kidney, ovarian, leukemia, and colon) with 3H-labeled gemcitabine for 4 or 24 hours and determined levels of gemcitabine incorporation by liquid scintillation counting with normalization to thymidine incorporation.15, 19–23 Similar to our findings, most of these studies found an inverse correlation between the amount of gemcitabine incorporated into DNA and the cellular IC50 when corrected for the rate of DNA synthesis.15, 19, 21–23 Wickremsinhe et al. developed a non-radioactive method for determining gemcitabine DNA incorporation using CL-ESI-MS/MS to quantify the gemcitabine in hydrolyzed DNA samples.24 They observed that gemcitabine incorporation correlates with differences in cell doubling times but did not address cell sensitivity. Additionally, some studies reported a time- and dose-dependent incorporation of gemcitabine into DNA for ranges up to 10 μM.19, 22–24 However, those techniques used higher than pharmacologically relevant concentrations of gemcitabine to detect gemcitabine-DNA incorporation. These studies also required the use of 50–100 micrograms of DNA per sample, required normalization to cellular proliferation and often required demanding protocols that limited their applications to cell culture studies. In the current study, we observed a time-dependent incorporation of gemcitabine, which reflected differences in IC50 at doses between 0.0015 and 0.3 μM gemcitabine, even without BrdU normalization.
In addition to finding a correlation between low gemcitabine DNA incorporation levels and cellular resistance, we assessed several mechanisms of gemcitabine resistance with molecular correlative experiments. Frequently, cells will develop multiple resistance mechanisms including changes involving drug transporter activity, changes in intracellular concentration of active drug, and levels of drug metabolizers or target enzymes.1 Because gemcitabine relies on active transport into the cell, we compared gemcitabine uptake and efflux in two closely related cell lines that differ as a consequence of induced drug resistance. Interestingly, the resistant 5637R cell line showed higher levels of gemcitabine uptake over the 48 hours of treatment, suggesting that decreased gemcitabine uptake is not a mechanism of resistance (SI Figure 1A).
In conclusion, we have developed an assay to determine gemcitabine DNA incorporation levels using very low levels of 14C-labeled gemcitabine. In our bladder cancer cell lines, the gemcitabine DNA incorporation levels correlate with cellular gemcitabine sensitivity indicating this assay may be able to predict tumor response to gemcitabine at subtoxic doses. Additionally, we observed increased RRM2 levels in our resistant cell line and were able to enhance cell sensitivity with RRM2 knockdown. Future studies will focus on using this assay in mice bearing bladder cancer patient derived xenograft models as a single assay and in combination chemotherapy with carboplatin.
Supplementary Material
Acknowledgments
Funding Sources
This work was supported by funding from the NIH/NCI (RO1-CA155642 and T3208TS, NIGMS 8P41GM103483 to LLNL) and NIH/NCI SBIR contracts (HHSN261201000133C, HHSN261201200048C and HHSN261201200084C) to Accelerated Medical Diagnostics Incorporated, and a VA Merit-2 award.
We thank Kurt Haack and LLNL staff for analyzing the AMS samples.
ABBREVIATIONS
- AMS
accelerator mass spectrometry
- AUC
area under the curve
- BrdU
bromo-2′-deoxy-uridine
- dCK
deoxycytidine kinase
- dFdC
2′,2′-difluoro 2′-deoxycytidine
- DPM
disintegrations per minute
- hENT1
human equilibrative nucleoside transporter 1
- ERCC1
excision repair cross-complementation group 1
- GAPDH
glyceraldehyde-3-phosphate dehydrogenase
- GC
gemcitabine and cisplatin
- LSC
liquid scintillation counter
- MIBC
muscle invasive bladder cancer
- MTS
3-(4,5-dimethylthiazol-2-yl)-5-(3-carboxymethoxyphenyl)-2-(4-sulfophenyl)-2H-tetrazolium
- MVAC
methotrexate, vinblastine, doxorubicin, and cisplatin
- NMIBC
non-muscle invasive bladder cancer
- nt
nucleotide
- PBS
phosphate buffered saline
- RRM1/2
ribonucleotide reductase M1/2
References
- 1.Mini E, Nobili S, Caciagli B, Landini I, Mazzei T. Cellular pharmacology of gemcitabine. Ann Oncol. 2006;17(Suppl 5):v7–12. doi: 10.1093/annonc/mdj941. [DOI] [PubMed] [Google Scholar]
- 2.Dancik GM, Theodorescu D. Pharmacogenomics in bladder cancer. Urol Oncol. 2014;32:16–22. doi: 10.1016/j.urolonc.2013.09.007. [DOI] [PMC free article] [PubMed] [Google Scholar]
- 3.Griffiths TR Action on Bladder C. Current perspectives in bladder cancer management. Int J Clin Pract. 2013;67:435–448. doi: 10.1111/ijcp.12075. [DOI] [PubMed] [Google Scholar]
- 4.Cheung G, Sahai A, Billia M, Dasgupta P, Khan MS. Recent advances in the diagnosis and treatment of bladder cancer. BMC Med. 2013;11:13. doi: 10.1186/1741-7015-11-13. [DOI] [PMC free article] [PubMed] [Google Scholar]
- 5.O’Donnell PH. Bladder cancer pharmacogenomics: recent insights and future perspectives. Pharmacogenomics. 2012;13:1553–1556. doi: 10.2217/pgs.12.145. [DOI] [PubMed] [Google Scholar]
- 6.Kluth LA, Black PC, Bochner BH, Catto J, Lerner SP, Stenzl A, Sylvester R, Vickers AJ, Xylinas E, Shariat SF. Prognostic and Prediction Tools in Bladder Cancer: A Comprehensive Review of the Literature. Eur Urol. 2015 doi: 10.1016/j.eururo.2015.01.032. [DOI] [PubMed] [Google Scholar]
- 7.Takata R, Katagiri T, Kanehira M, Shuin T, Miki T, Namiki M, Kohri K, Tsunoda T, Fujioka T, Nakamura Y. Validation study of the prediction system for clinical response of M-VAC neoadjuvant chemotherapy. Cancer Sci. 2007;98:113–117. doi: 10.1111/j.1349-7006.2006.00366.x. [DOI] [PMC free article] [PubMed] [Google Scholar]
- 8.Kaplan AL, Litwin MS, Chamie K. The future of bladder cancer care in the USA. Nat Rev Urol. 2014;11:59–62. doi: 10.1038/nrurol.2013.180. [DOI] [PubMed] [Google Scholar]
- 9.Pal SK, Milowsky MI, Plimack ER. Optimizing systemic therapy for bladder cancer. J Natl Compr Canc Netw. 2013;11:793–804. doi: 10.6004/jnccn.2013.0101. [DOI] [PubMed] [Google Scholar]
- 10.Wang S, Zhang H, Scharadin TM, Zimmermann M, Hu B, Pan AW, Vinall R, Lin TY, Cimino G, Chain P, Vuyisich M, Gleasner C, McMurry K, Malfatti M, Turteltaub K, de Vere White R, Pan CX, Henderson PT. Molecular Dissection of Induced Platinum Resistance through Functional and Gene Expression Analysis in a Cell Culture Model of Bladder Cancer. PLoS One. 2016;11:e0146256. doi: 10.1371/journal.pone.0146256. [DOI] [PMC free article] [PubMed] [Google Scholar]
- 11.Hah SS, Stivers KM, de Vere White RW, Henderson PT. Kinetics of carboplatin-DNA binding in genomic DNA and bladder cancer cells as determined by accelerator mass spectrometry. Chem Res Toxicol. 2006;19:622–626. doi: 10.1021/tx060058c. [DOI] [PubMed] [Google Scholar]
- 12.Ognibene TJ, Bench G, Vogel JS, Peaslee GF, Murov S. A high-throughput method for the conversion of CO2 obtained from biochemical samples to graphite in septa-sealed vials for quantification of 14C via accelerator mass spectrometry. Anal Chem. 2003;75:2192–2196. doi: 10.1021/ac026334j. [DOI] [PubMed] [Google Scholar]
- 13.Brown K, Dingley KH, Turteltaub KW. Accelerator mass spectrometry for biomedical research. Methods Enzymol. 2005;402:423–443. doi: 10.1016/S0076-6879(05)02014-8. [DOI] [PubMed] [Google Scholar]
- 14.Cimino GD, Pan CX, Henderson PT. Personalized medicine for targeted and platinum-based chemotherapy of lung and bladder cancer. Bioanalysis. 2013;5:369–391. doi: 10.4155/bio.12.325. [DOI] [PMC free article] [PubMed] [Google Scholar]
- 15.Veltkamp SA, Pluim D, van Eijndhoven MA, Bolijn MJ, Ong FH, Govindarajan R, Unadkat JD, Beijnen JH, Schellens JH. New insights into the pharmacology and cytotoxicity of gemcitabine and 2′,2′-difluorodeoxyuridine. Mol Cancer Ther. 2008;7:2415–2425. doi: 10.1158/1535-7163.MCT-08-0137. [DOI] [PubMed] [Google Scholar]
- 16.Lanz C, Fruh M, Thormann W, Cerny T, Lauterburg BH. Rapid determination of gemcitabine in plasma and serum using reversed-phase HPLC. J Sep Sci. 2007;30:1811–1820. doi: 10.1002/jssc.200600534. [DOI] [PubMed] [Google Scholar]
- 17.Wang S, Zhang H, Malfatti M, de Vere White R, Lara PN, Jr, Turteltaub K, Henderson P, Pan CX. Gemcitabine causes minimal modulation of carboplatin-DNA monoadduct formation and repair in bladder cancer cells. Chem Res Toxicol. 2010;23:1653–1655. doi: 10.1021/tx1003547. [DOI] [PMC free article] [PubMed] [Google Scholar]
- 18.Henderson PT, Li T, He M, Zhang H, Malfatti M, Gandara D, Grimminger PP, Danenberg KD, Beckett L, de Vere White RW, Turteltaub KW, Pan CX. A microdosing approach for characterizing formation and repair of carboplatin-DNA monoadducts and chemoresistance. Int J Cancer. 2011;129:1425–1434. doi: 10.1002/ijc.25814. [DOI] [PMC free article] [PubMed] [Google Scholar]
- 19.Ruiz van Haperen VW, Veerman G, Vermorken JB, Peters GJ. 2′,2′-Difluoro-deoxycytidine (gemcitabine) incorporation into RNA and DNA of tumour cell lines. Biochem Pharmacol. 1993;46:762–766. doi: 10.1016/0006-2952(93)90566-f. [DOI] [PubMed] [Google Scholar]
- 20.Iwasaki H, Huang P, Keating MJ, Plunkett W. Differential incorporation of ara-C, gemcitabine, and fludarabine into replicating and repairing DNA in proliferating human leukemia cells. Blood. 1997;90:270–278. [PubMed] [Google Scholar]
- 21.van Moorsel CJ, Pinedo HM, Veerman G, Bergman AM, Kuiper CM, Vermorken JB, van der Vijgh WJ, Peters GJ. Mechanisms of synergism between cisplatin and gemcitabine in ovarian and non-small-cell lung cancer cell lines. Br J Cancer. 1999;80:981–990. doi: 10.1038/sj.bjc.6690452. [DOI] [PMC free article] [PubMed] [Google Scholar]
- 22.Bergman AM, Pinedo HM, Talianidis I, Veerman G, Loves WJ, van der Wilt CL, Peters GJ. Increased sensitivity to gemcitabine of P-glycoprotein and multidrug resistance-associated protein-overexpressing human cancer cell lines. Br J Cancer. 2003;88:1963–1970. doi: 10.1038/sj.bjc.6601011. [DOI] [PMC free article] [PubMed] [Google Scholar]
- 23.Huang P, Chubb S, Hertel LW, Grindey GB, Plunkett W. Action of 2′,2′-difluorodeoxycytidine on DNA synthesis. Cancer Res. 1991;51:6110–6117. [PubMed] [Google Scholar]
- 24.Wickremsinhe ER, Lutzke BS, Jones BR, Schultz GA, Freeman AB, Pratt SE, Bones AM, Ackermann BL. Quantification of gemcitabine incorporation into human DNA by LC/MS/MS as a surrogate measure for target engagement. Anal Chem. 2010;82:6576–6583. doi: 10.1021/ac100984h. [DOI] [PubMed] [Google Scholar]
Associated Data
This section collects any data citations, data availability statements, or supplementary materials included in this article.