

Abstract
Research on automatic processes in fear has emphasized the provocation of fear responses rather than their attenuation. We have previously shown that the repeated presentation of feared images without conscious awareness via backward masking reduces avoidance of a live tarantula in spider‐phobic participants. Herein we investigated the neural basis for these adaptive effects of masked exposure. 21 spider‐phobic and 21 control participants, identified by a psychiatric interview, fear questionnaire, and approaching a live tarantula, viewed stimuli in each of three conditions: (1) very brief exposure (VBE) to masked images of spiders, severely limited awareness; (2) clearly visible exposure (CVE) to spiders, full awareness; and (3) masked images of flowers (control), severely limited awareness. Only VBE to masked spiders generated neural activity more strongly in phobic than in control participants, within subcortical fear, attention, higher‐order language, and vision systems. Moreover, VBE activated regions that support fear processing in phobic participants without causing them to experience fear consciously. Counter‐intuitively, CVE to the same spiders generated stronger neural activity in control rather than phobic participants within these and other systems. CVE deactivated regions supporting fear regulation and caused phobic participants to experience fear. CVE‐induced activations also correlated with measures of explicit fear ratings, whereas VBE‐induced activations correlated with measures of implicit fear (color‐naming interference of spider words). These multiple dissociations between the effects of VBE and CVE to spiders suggest that limiting awareness of exposure to phobic stimuli through visual masking paradoxically facilitates their processing, while simultaneously minimizing the experience of fear. Hum Brain Mapp 38:2466–2481, 2017. © 2017 Wiley Periodicals, Inc.
Keywords: fear, masking, automatic processing, exposure, phobia
INTRODUCTION
The visual masking of phobic and fear‐relevant stimuli is frequently used to investigate the automaticity of fear responses. Phobic stimuli are those that are feared by a particular group of persons. Fear‐relevant stimuli are those that posed threats in our evolutionary history, and thus biologically prepare us to fear them. Numerous human imaging studies have shown that masked phobic and fear‐relevant stimuli activate the amygdala even though participants are not aware they are viewing these stimuli, suggesting that fear processing is automatic [Carlsson et al., 2004; Etkin et al., 2004; Larson et al., 2006; Lipka et al., 2011; Morris et al., 1998, 1999; Whalen et al., 1998, 2004; Williams et al., 2006]. Consistent with this interpretation, autonomic fear responses have been elicited by, and conditioned to, masked phobic and fear‐relevant stimuli, respectively [Balderston and Helstetter, 2010; Esteves et al., 1994; Katkin et al., 2001; Öhman and Soares, 1993, 1994, 1998]. This body of masking research has focused almost exclusively on the provocation and acquisition of phobic responses.
Other studies, however, have subsequently shown that visual masking can also be used to reduce fear. Our group has shown that the repeated presentation of masked phobic images—what we term very brief exposure (VBE)—reduces avoidance and self‐reported fear of a live tarantula in spider‐phobic persons [Siegel et al., 2011; Siegel and Gallagher, 2015; Siegel and Weinberger, 2009, 2012, 2013a; Weinberger et al., 2011]. These adaptive effects endure as long as one year [Siegel and Warren, 2013b]. Whereas visible exposure to spider images induces sympathetic arousal and subjective distress in phobic participants and does not affect their avoidance of the tarantula, VBE to the same masked images reduces phobic avoidance and induces neither arousal nor distress, suggesting that its therapeutic effects occur automatically. The purpose of masking in VBE is not to eliminate awareness of phobic stimuli—to render them “unconscious,” which is very difficult when continuously presenting masked phobic, color images—but to severely limit subjective awareness of them. A meta‐analysis of 250+ phobic participants found that the therapeutic effects of VBE occur when these participants lack subjective awareness of the masked stimuli, and thus do not experience distress [Warren and Siegel, in preparation]. Challenging the clinical conviction that only direct confrontation of phobic situations reduces fear, these reproducible effects of masked exposure to phobic stimuli on fear‐related behaviors suggests the presence of adaptive neural processes that reduce, rather than engender, fear responses.
The purpose of this study was to investigate the neural basis for the adaptive effects of VBE—masked exposure to phobic images. Thus, the design of this study was based on the aforementioned behavioral studies that manipulated the duration of stimulus presentation in comparing the effects of VBE and clearly visible exposure to the same phobic images. We presented each of three conditions to participants diagnosed with Specific Phobia of spiders and healthy, non‐phobic participants: (1) masked exposure to images of spiders (VBE); (2) clearly visible exposure (CVE) to spiders; and (3) masked images of flowers (control). By contrasting the effects of VBE and CVE to phobic stimuli, we assessed how limiting the conscious recognition of exposure influences brain activity. VBE is pure exposure: participants are instructed to focus intently on repeated trains of masked phobic stimuli, rather than give trial‐wise responses to those stimuli. To maintain consistency with behavioral studies attesting to the adaptive effects of VBE, our study participants were similarly instructed. Participants provided on‐line fear ratings after each train of stimuli. We assessed correlations between neural activity and these fear ratings, as well as other phobic behaviors taken prior to the experiment.
Consistent with prior imaging studies of Specific Phobia [Del Casale et al., 2012; Linares et al., 2012], we expected both masked and visible exposure to spiders—VBE and CVE—to activate regions supporting subcortical fear (e.g., amygdala) and visual systems more strongly in phobic than in control participants. Because VBE involves focusing intently on repeated trains of masked phobic stimuli, we expected it to activate regions supporting attention (e.g., dorsolateral prefrontal cortex) in phobic versus control participants. Based on our prior findings that VBE automatically reduces phobic participants' fear of a live tarantula, we expected VBE to activate ventral prefrontal cortical (vPFC) regions—which are believed to support automatic fear inhibition [Delgado et al., 2008]—in phobic participants, although such activation should not necessarily differ from activation in healthy controls, who naturally inhibit fear responses. Based on our prior findings that CVE induces sympathetic arousal and subjective distress in phobic participants, we expected CVE to deactivate vPFC regions in the phobic group. Thus, in direct contrasts of CVE and VBE to spiders in the phobic group, we expected VBE to generate stronger activation of vPFC and DLPFC regions than CVE. Correspondingly, CVE would cause phobic participants to experience fear, whereas VBE would not. Confirmation of these hypotheses would challenge prevailing theory by showing that limiting conscious recognition of phobic stimuli paradoxically facilitates the activation of fear processing and regulation systems in the brain, suggesting the presence of neural pathways for reducing fear other than those identified through conscious, cognitive processing [Delgado et al., 2008; Hermann et al., 2009].
METHODS AND MATERIALS
Participants
We studied 21 spider‐phobic and 21 healthy control participants, all right‐handed, female undergraduate students. Women were chosen because previous studies have shown that 75%–80% of all specific phobics are women [Fyer, 1998; Magee et al., 1996]. Potential participants were administered the Structured Clinical Interview for DSM‐IV [First et al., 1997], the Fear of Spiders Questionnaire [FSQ; Szymanski and O'Donohue, 1995], and a Behavioral Avoidance Test in which they were asked to gradually approach a live tarantula [described below; Siegel and Weinberger, 2012]. Phobic participants met DSM‐V criteria for Specific Phobia, did not meet criteria for any other current or lifetime disorder, were in the top 15% of the distribution of FSQ scores, exhibited impairing fear of the tarantula, and showed color‐naming interference of spider words on a Spider Stroop Task, an implicit measure of spider fear [Williams et al., 1996]. Non‐phobic participants did not meet criteria for any disorder, were in the bottom 30% of the distribution of FSQ scores, and displayed no avoidance and reported no fear of the tarantula. Average age was 19.7 years (SD = 1.6; Range: 18–25). Participants provided written informed consent.
fMRI Task Design and Stimuli
Two features of the study design built on prior imaging studies of masked stimuli by controlling for visual features of the phobic and fear‐irrelevant (control) stimuli, and thus their effects on neural activity. Prior imaging studies of Specific Phobia have tended to use as control stimuli various fear‐irrelevant images having visual configurations that differed significantly from those of the phobic stimuli [e.g., snakes vs. birds, spiders vs. mushrooms; Alpers et al., 2009; Leuken et al., 2011; Schweckendiek et al., 2011]. As shown in Figure 1, we used fear‐irrelevant stimuli (flowers) that had a similar visual configuration as the phobic stimuli (spiders), and matched these stimuli for lower‐order visual features. Thus, effects on neural activity of masked phobic versus fear‐irrelevant stimuli were determined to the greatest extent possible by their emotional properties.
Figure 1.
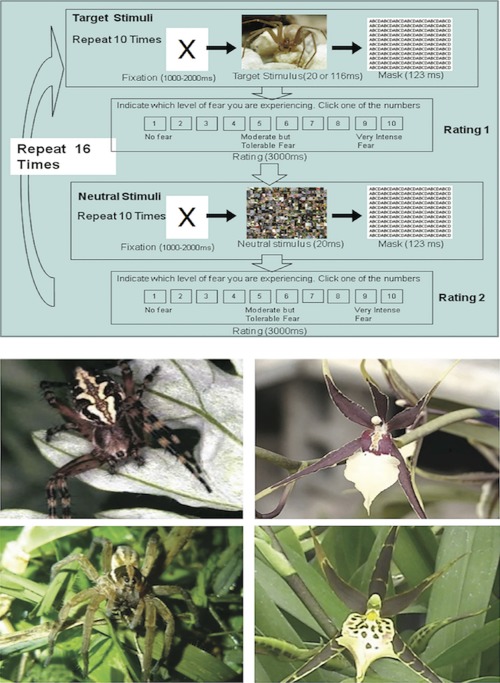
The top panel shows the fMRI task design. Each of the three 10‐minute conditions consisted of 16 alternating blocks of 10 target stimulus‐mask and 10 neutral stimulus‐mask trials. Each trial was an X (fixation point), then either a target or a neutral stimulus (33.4‐ms or 117‐ms) depending on block, followed by the masking stimulus (117‐ms). The duration of the X was jittered from 1,000 to 2,000‐ms to prevent expectancies about the appearance of the target stimuli, with no inter‐trial interval. After each block of 10 target or neutral trials, a 10‐point, anchored, ordinal scale appeared for subjects to rate levels of fear. Thus, a block of 10 target stimuli is presented, followed by the VAS, then a block of 10 neutral stimuli, followed by another VAS. This process was repeated 16 times in each condition. The bottom panel shows examples of the spider and flower images, 400 × 300 pixels, matched for color, hue, luminance and contrast of luminance. The flower images were either of Cleome, the “spider flowers,” or Brassia Rex Sakata, the “spider orchids”—possessing a central body (ovary/style) with multiple long, thin radiations (petals), like the spider images.
Second, before contrasting neural activity between groups and conditions, within each group and condition we first contrasted neural activity induced by the target stimuli with activity induced by corresponding neutral stimuli composed of scrambled fragments of the target stimuli—and thus many of the same lower‐order visual features. Thus, each condition generated patterns of neural activity determined by the identity and emotional meaning of the target stimuli to the participants.
fMRI task design
Each of three conditions was presented during fMRI scanning: (1) very brief exposure (VBE) to masked spiders (masked, 33.4‐ms stimulus duration); (2) clearly visible exposure (CVE) to spiders (unmasked, 117‐ms duration); and (3) very brief flowers (VBF; control; masked, 33.4‐ms duration). These conditions were manipulated within‐subjects in order to compare their effects directly within the same participants. Thus, we acquired three runs, one for each condition. The six possible sequences of conditions (e.g., VBE → CVE → VBF) was counterbalanced across participants. The conditions were separated by two minutes of rest. Each condition consisted of 16 blocks of 10 target stimulus‐mask trials alternating with 16 blocks of 10 neutral stimulus‐mask trials, yielding a 10‐minute run of 16 paired blocks for each target stimulus type. In each condition, blocks of target stimuli (spiders or flowers) were alternated with blocks of masked neutral stimuli in order to contrast neural activity induced by the target stimuli with activity induced by masked neutral stimuli. Each neutral stimulus consisted of scrambled pieces of the corresponding target stimulus. Alternating individual trials of target and neutral stimuli would have departed from the crucial feature of VBE—repeated presentation of masked phobic stimuli, and would have precluded on‐line fear ratings, which were overriding considerations in study design.
Each target or neutral trial consisted of an “X” for gaze fixation (duration jittered from 1 to 2 sec), followed immediately by a target stimulus (spider or flower, depending on condition) or corresponding neutral stimulus, followed immediately by the masking stimulus (117 ms, array of the repeated letters “ABCD”). Each trial (“X”/target or neutral stimulus/mask) was repeated 10 times to yield a block of 10 target or neutral trials in succession. There was no inter‐trial interval. After each block of 10 target or neutral trials, participants rated levels of fear on a 10‐point, anchored ordinal scale (3,000 ms).
Before entering the scanner, and immediately before the start of each run, participants were told that they would be presented with a series of stimuli that they may or may not recognize. Their task was to maintain their focus on the stimuli, and to provide fear ratings on the scale that would appear after each block of stimuli (∼every 12 sec).
Stimuli and presentation
The target stimuli were 25 images each of spiders or flowers, 400 × 300 pixels (72 dpi). The bottom panel of Figure 1 shows representative spider and flower images. To isolate the emotional effects of masked phobic stimuli on neural activity, we masked fear‐irrelevant stimuli (flowers) with a visual configuration (central body with multiple radiations) that was similar to that of the spiders. The flower images were either of Cleome, the “spider flowers,” or Brassia Rex Sakata, the “spider orchids”—possessing a central body (ovary/style) with multiple long, thin radiations (petals), controlling for some of the edge and contour features of the spider images. The color, hue, luminance, and contrast of luminance of the flower images also matched those of the spider images.
Twenty‐five corresponding neutral stimuli were created from the target images, which were cut into 1,200 squares of 10 × 10 pixels (Fig. 1). The squares were randomly shuffled so that the features of the target images were not discernible in the neutral stimuli. The neutral stimuli thus retained the colors, luminance, hue, and general texture of the targets—that is, their lower‐order visual features, but contained multiple contours and thus lacked a perceivable object.
The masking stimulus was an array of the letters ABCD, 463 × 354 pixels (400 dpi), repeated to cover entirely the area of the target images. Signal detection analyses and subjective tests of awareness have shown the mask to be effective at preventing recognition of the spider and flower images when either type of stimuli was repeatedly presented for 33‐ms each or less [Siegel et al., 2011; Siegel and Weinberger, 2009, 2012; Weinberger et al., 2011].
The stimuli were presented using Eprime (Psychology Software Tools, Inc.) on a PC monitor (resolution 1,024 × 768, refresh rate 60 Hz), rear projected onto a 2 × 3 inches mirror mounted on the head coil 9 cm in front of the eyes.
Behavioral Assessments
For detailed description of these assessments, see section SM 1 of the Supporting Information. The Fear of Spiders Questionnaire [FSQ, Szymanski and O'Donohue, 1995] assessed the extent to which participants believed they were fearful of spiders. Filler questions, which concerned other fears and sensation seeking, disguised the intent of the FSQ. A Behavioral Avoidance Test (BAT) was used to measure levels of avoidance of a live tarantula housed in a 10‐gallon glass aquarium. Participants were asked to complete a series of approach tasks that brought them progressively closer to the tarantula (section SM1 of the Supporting Information). A Spider Stroop task was used to measure color‐naming interference of spider words, an implicit measure of fear [Newman and McKinney, 2002; Williams et al., 1996]. Participants first named the color of a series of neutral words (e.g., BED appears in the color red). Then they named the color of a series of spider‐related words (e.g., WEB), matched for word length and number of vowels and consonants. The difference between the times to name the colors of the spider versus neutral words yielded a color‐naming interference score.
A funneled stimulus interview, progressing from open‐ended to specific questions, was conducted immediately after each of the three condition to assess knowledge of the stimuli. See SM1 of the Supporting Information for the list of questions that composed the interview.
Functional Image Acquisition and Preprocessing
Functional images were acquired on a GE Signa 3‐Tesla scanner using an echo planar protocol. For each participant, 343 imaging volumes were collected for each of the three, 10‐minute runs, including 6 initial “dummy” volumes. Twenty T1‐weighted images were acquired parallel to the anterior commissure‐posterior commissure line, followed by a 3‐dimensional spoiled gradient recall (SPGR) image for coregistration with axial echoplanar images. Acquisition parameters for the axial echoplanar images were: TR = 1,800 ms; TE = 28 ms; flip angle = 75°; field of view = 22.4 × 22.4cm; acquisition matrix = 64 × 64; slice thickness = 4.0 mm; gap = 0 mm; effective resolution = 3.5 × 3.5 × 4.0 mm; 32 slices per volume provided whole brain coverage.
Each participant's functional images were first visually inspected for motion and other artifacts. Image preprocessing was conducted using a standard pipeline implemented in SPM8 (http://www.fil.ion.ucl.ac.uk/spm/) under MATLAB 2010B, including: (a) slice‐timing correction based on sinc function interpolation and fast Fourier transform for temporal realignment of slices within each volume, using the middle slice as the timing reference; (b) motion correction for three translational directions and three rotations, derived from a series of ridged‐body transforms of each image volume with respect to the first image volume by minimizing the mean square error between the volumes; (c) spatial normalization by reformatting each high‐resolution SPGR image to the Montreal Neurological Institute template ICBM 152 (2 × 2 × 2 mm3 voxels); (d) spatial smoothing of functional images with an 6 mm FWHM Gaussian kernel, and temporal smoothing with a Discrete Cosine Transform high‐pass filter (basis function length = 128 sec).
Head motion
During image preprocessing, we took several steps to ensure that motion artifacts did not confound measurement of neural activity. We used the SPM8 motion realignment procedure to detect 3 translation motion parameters and 3 rotation parameters for each fMRI run when realigning images with the first image volume. The three fMRI runs (VBE, CVE, VBF) of all participants were less than 3 mm translational motion and less than 3° rotational motion. Second, we tested whether head movement during the MRI scans differed between the phobic and control groups in each of the three conditions by calculating an aggregate head motion parameter from the six aforementioned parameters for each participant in each condition: the sum of the root mean squares of the six motion parameters for each image volume with respect to the previous image volume. The groups did not differ in head motion, as indexed by this aggregate parameter, in any of the conditions (for VBE, P = 0.69; CVE, P = 0.21; VBF, P = 0.73). Third, we used ArtRepair (http://cibsr.stanford.edu/tools/human-brain-project/artrepair-software.html) to detect and repair imaging volumes that still contained motion‐induced spikes in fMRI signal. ArtRepair assesses the relative change in translational and rotational motion parameters between successive imaging volumes. When the square root of the squared sum of the difference of the motion parameters between the current and previous imaging volumes exceeds 1, the current imaging volume is replaced by the mean of the previous and next imaging volumes. The developers of ArtRepair suggest that runs containing greater than 15% of volumes need repair are excluded from analyses. None of our runs surpassed this threshold.
Processing and Statistical Analysis of the Functional Imaging Data
Processing each participant's fMRI data
The general linear model in SPM8 was used to process each participant's fMRI data for each of the three conditions. Data were modeled for each participant and for each condition using a constant and four independent regressors corresponding to the active block (spider or flower presentation), the first fear rating immediately following the active block, the neutral block, and the second fear rating following the neutral block. The BOLD signal change for each event was generated by convolving a canonical hemodynamic response function (HRF) with a boxcar function (BCF) derived from the onsets and durations of each event. The model was estimated using the Restricted Maximum Likelihood (ReML) algorithm with autocorrelation in the time series removed using a first‐order autoregressive model. Then task‐related contrast images (e.g., VB spider vs. Neutral) were generated using the SPM8 contrast manager. Each participant's contrast images of target vs. neutral blocks of stimuli were intensity‐normalized using the respective last beta images in the fMRI time series to standardize image intensity across runs. A conjunction mask was applied to these contrast images of target versus neutral events to ensure that only voxels without signal voids were analyzed.
Group‐level processing of the fMRI data
Each participant's task‐related contrast images were then entered into a group‐level, Random Effects analysis to determine significant BOLD response to target versus neutral stimuli within each condition and group, separately. Bayesian posterior inference was used for the group‐level analysis of the contrast images generated for each participant, specifically an in‐house, MATLAB‐based algorithm of Neumann and Lohmann's method (2003) for inferring the posterior probability of detecting group effects brain‐wise. We selected Neumann and Lohmann's method (2003) of Bayesian analysis in order to address the recently highlighted problem of false positive findings associated with correcting P‐values for multiple comparisons in parametric methods of statistical analysis. On the basis of a recent meta‐analysis, Eklund et al. [2016] reported that parametric statistical methods that rely on spatial cluster thresholding to correct for multiple comparisons suffer from inflated false positive rates. Neumann and Lohmann [2003] compared results using their Bayesian method without any correction for multiple comparisons to the results of a conventional approach based on parametric inference (the standard second‐level analysis in LIPSIA) thresholded at Z = 3.09. The parametric method was performed voxelwise with Bonferroni correction; it did not employ cluster‐based thresholding. Neumann and Lohmann [2003] showed that the “uncorrected” results of their Bayesian method were comparable to the results obtained using this conventional parametric method with a stringent threshold.
More significantly, Neumann and Lohmann's [2003] Bauyesian method does not depend on spatial clusters, and so does not incur the problems of parametric methods that rely on them to correct for multiple comparisons. The theoretical work and numerical simulations of Friston and colleagues [Friston et al., 2002; Friston and Penny, 2003] have shown that Bayesian‐inference methods do not incur multiple‐comparison problems simply because they do not have false positives—unlike the parametric statistical methods criticized by Eklund et al. [2016]. In Bayesian‐inference methods, the posterior probability estimation for a given voxel is equal for analyses involving a single voxel and analyses involving all brain voxels [Friston and Penny, 2003]. Such empirical demonstrations show that Bayesian‐inference methods (including Neumann and Lohmann's method) do not require use of cluster extent thresholds in calculating their posterior probability estimates. The power and utility of Bayesian methods in controlling false positive findings is the reason why other prominent studies have used Neumann and Lohmann's implementation of Bayesian inference [see Klein et al., 2007].
Because they do not require additional adjustments of statistical thresholds in their posterior probability estimates, some may assume that Bayesian approaches to fMRI statistical analysis are “unthresholded.” As an additional requisite for assuming statistical significance, however, we required positive findings to have a posterior probability greater than 97.5% (a more stringent threshold than that used by Klein et al. [2007] in a Science article), and an extent of at least eight contiguous voxels in all of our analyses (discarding results comprising few voxels, i.e., of questionable biological significance).
Our Bayesian method for group‐level fMRI analysis bestowed other advantages. It allowed us to test our hypotheses directly (i.e., it produced a probability that our alternative hypotheses are correct), rather than simply reject the null hypothesis (i.e., producing a probability that it is acceptable to reject the null hypothesis based on how unlikely it is). Bayesian approaches are useful for detecting effects in groups that are heterogeneous, as can be the case with diagnostic samples, where the risk of missing detection of true biological effects (type II error) may be as important as reporting false positive findings (type I error). Finally, our Bayesian method is particularly reliable in comparing different groups of participants, minimizing the extent to which group‐level effects are unduly weighted by individual differences in brain activity.
Analyses of regions of interest (ROIs)
We hypothesized that both VBE and CVE to spiders would both activate subcortical fear regions (amygdalae), and that VBE would activate ventral PFC regions that support emotion regulation more than CVE in phobic participants. Thus, we conducted group‐level analyses of the activation time courses of the right and left amygdala, and of the ventral medial prefrontal cortex, given their well‐documented involvement in fear activation and regulation, respectively [Delgado et al., 2008; Phelps et al., 2004]. Activity within these ROIs was assessed using small volume correction implemented in SPM8. A family‐wise error (FWE) correction was applied to a local search region defined by a mask image for each ROI. The mask image was generated by coregistering the anatomical probability maps of ROIs from the SPM Anatomy Toolbox [Amunts et al., 2005] with the MNI template ICBM152.
RESULTS
Fear Ratings
Fear ratings for blocks of neutral stimuli were subtracted from those of corresponding blocks of target stimuli and statistically evaluated. Preliminary ANOVAs used blocks of stimuli as factors to test for effects of repeated measurement, and yielded no main or interaction effects. Thus, each participant's fear ratings were averaged within each condition (separately for target and neutral stimuli). Table 1 shows mean fear ratings of the phobic and control groups for each of the three conditions. In a Group (Phobic or Control) × Exposure (3 conditions) mixed model ANOVA, the main effect of Group was highly significant, F(1,40) = 18, P = 0.0001, showing that fear ratings of the phobic group exceeded those of the control group, regardless of condition. The main effect of Exposure was also highly significant, F(2,80) = 16.4; P = 0.0001, and driven by the phobic group. In a one‐way ANOVA of the phobic group, the main effect of Exposure was highly significant, F(2,40) = 13.2, P = 0.0001; Eta = 0.63 (effect size). Post‐hoc Tukey's tests of the phobic group showed that clearly visible exposure (CVE) to spiders induced significantly more fear than both VBE to spiders, P = 0.001, and very brief flowers (VBF), P = 0.001. The same comparison of VBE and VBF was not significant (P = 0.30).
Table 1.
Mean fear ratings of the phobic and control groups for the three conditions
| Type of exposure | |||
|---|---|---|---|
| Group | Clearly visible spiders | Very brief spiders | Very brief flowers |
| Phobic | 5.40 (.43) | 3.64 (.37) | 2.92 (.35) |
| Control | 1.26 (.32) | 1.07 (.26) | 1.03 (.25) |
Note. Values outside of the parentheses represents mean fear ratings on the 1–10 scale. Values within parentheses represent standard error of measurement.
Imaging Findings
After presenting an overview of consistent patterns of neural activity across the diagnostic groups, we present the imaging findings in the order corresponding to our hypotheses in the introduction: first group contrasts and then condition contrasts in neural activity. We then present post hoc findings to aid interpretation of our findings for hypothesis testing.
Overview
Figure 2 shows patterns of activation generated by the active conditions—CVE and VBE to spiders—relative to neutral stimuli in the diagnostic groups. See Supporting Information Figure S1 in section SM2 of the Supporting Information for patterns of activity generated by VBF, for which group differences were virtually absent. As shown in Figure 2, the exposure conditions generated a variety of patterns of neural activity across and within the groups. In order to present these patterns efficiently, and to facilitate interpretation in terms of brain‐behavior correlates, we present them in terms of information processing networks rather than a prohibitively detailed, region‐by‐region, reporting of findings.
Figure 2.
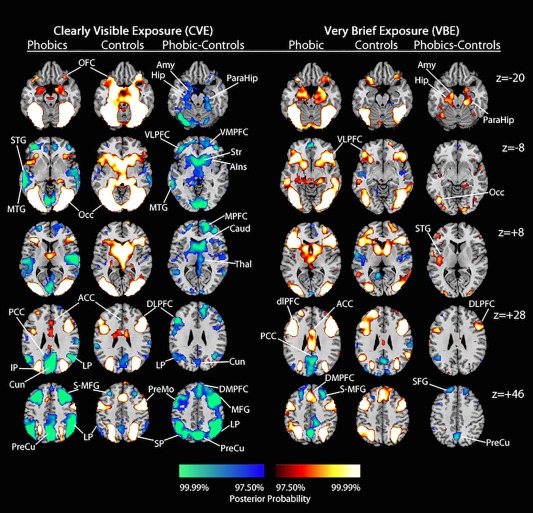
Representative slices of the posterior probability maps generated by clearly visible exposure (CVE) and very brief exposure (VBE) to spiders in the phobic and control groups, and corresponding group contrasts. The color code at the bottom indicates the posterior probability of positively and negatively activated regions (from 97.5% to 99.9%). Positively activated regions—red to white color bar—indicate greater BOLD response to blocks of target than neutral stimuli; negatively activated regions—blue to green color bar—indicate greater BOLD response to blocks of neutral than target stimuli. Proceeding from left to right in each row, the region labels identify the following. z = −20: OFC, orbital frontal cortex; Amy, amygdala; Hip, hippocampus; ParaHip, parahippocampal gyrus. z = −2: STG, superior temporal gyrus; MTG, middle temporal gyrus; Occ, occipital cortex; VLPFC, ventral lateral prefrontal cortex; VMPFC, ventral medial prefrontal cortex; Str, striatrum (putamen and caudate); AIns, anterior insula. z = +8: MPFC, medial prefrontal cortex; Caud, caudate; Thal, thalamus. z = +28: PCC, posterior cingulate cortex; IP, inferior parietal cortex; Cun, cuneus; ACC, anterior cingulate cortex; LP, lateral parietal cortex; DLPFC, dorsolateral prefrontal cortex. z = +46: PreCu, precuneus; S‐MFG, superior‐middle frontal gyrus; PreMo, premotor cortex; SP, superior parietal cortex; DMPFC, dorsal medial prefrontal cortex; MFG, middle frontal gyrus; SFG, superior frontal gyrus.
The exposure task generated consistent patterns of activation across the conditions and groups, including neural systems subserving (1) vision, bilateral occipital and inferior parietal cortices, reflecting different features of the target versus neutral stimuli; (2) attention, dorsolateral prefrontal cortices (DLPFC) and superior bilateral parietal cortices, reflecting the salience of the target versus neutral stimuli; (3) affective evaluation, cortical regions identified by neuroimaging reviews of Specific Phobia [Del Casale et al., 2012; Linares et al., 2012]: bilateral orbitofrontal cortices (OFC), anterior insula (AIns), anterior cingulate cortex (ACC), dorsal medial prefrontal cortex (DMPFC), reflecting the emotional salience of the target stimuli; and (4) motor control, striatum and pre‐motor regions, likely reflecting inhibition of responses to stimuli within the scanner. In the phobic group, CVE to spiders marginally activated the affective evaluation and pre‐motor regions, and did not activate the striatum (putamen and caudate).
Across diagnostic groups, CVE and VBE to spiders deactivated regions associated with the Default Mode Network (DMN; posterior cingulate cortex, precuneus, cuneus, bilateral parietal cortices, medial PFC regions, middle‐superior frontal gyri). However, CVE and VBE deactivated the DMN much more strongly in the phobic group, reflecting the greater salience of spiders to these participants.
Group contrasts of the exposure conditions
Differences in activation between the phobic and control groups were strongest for CVE, intermediate for VBE (Fig. 2), and nearly absent for VBF (Supporting Information Fig. S1, Supporting Information). For locations and activation levels of brain regions that were differentially activated by the exposure conditions in the phobic versus control groups, see Supporting Information Table 1 in section SM2 of the Supporting Information.
Contrary to our hypothesis that CVE to spiders would activate fear and visual regions more strongly in phobic than in control participants (see p. 4), CVE activated all of the aforementioned task‐driven systems more strongly in the control group than the phobic group, and activated a subcortical system subserving rapid emotion response more strongly in control than in phobic participants: thalamus, amygdala, hippocampus, parahippocampal gyri. As predicted, CVE strongly deactivated ventral prefrontal regions that prototypically support emotion regulation in the phobic group [ventral medial and ventral lateral prefrontal cortices, VMPFC and VLPFC; Hermann et al., 2009; Phelps et al. 2004]. CVE also deactivated temporal regions associated with higher‐order language (e.g., labeling; middle and superior temporal gyri, MTG and STG) and the DMN in phobic participants.
Consistent with our hypotheses (see p. 4), VBE to spiders activated the aforementioned subcortical emotion system, vision and attention systems, and regions supporting higher‐order language more strongly in the phobic group than in the control group. Also consistent with our hypotheses, VBE activated ventral prefrontal regions supporting emotion regulation and the cortical affective evaluation system comparably in the phobic and control groups. VBE also deactivated DMN regions in the phobic group strongly enough to emerge in group contrasts.
Direct contrasts of the active exposure conditions: CVE versus VBE to spiders
This comparison identified the effects of limiting conscious recognition of the spider images on neural activity, while controlling for their visual and emotional properties (Fig. 3). Consistent with our hypothesis that VBE would activate ventral PFC regions more strongly than CVE in the phobic group, CVE deactivated and VBE activated regions supporting emotion regulation (VLPFC) and higher‐order language (MTG, STG) in the phobic group, effects that were absent in the control group. Consistent with our hypothesis that VBE would activate DLPFC regions more strongly than CVE in the phobic group, VBE activated the attention (LPFC/DLPFC), affective evaluation (insula, ACC, DMPFC), and motor control systems (striatum and pre‐motor regions) much more strongly than CVE in the phobic group, effects that were absent or comparably marginal in the control group. Finally, CVE deactivated DMN regions more strongly than VBE in the phobic group, an effect that was absent in the control group.
Figure 3.
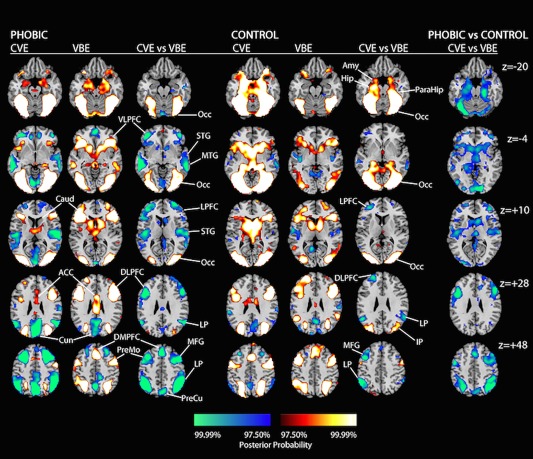
Representative slices of the posterior probability maps generated by direct contrasts of the clearly visible exposure (CVE) and very brief exposure (VBE) conditions within each diagnostic group (phobic and control), and the corresponding condition contrasts. Coding of the color scales is as in Figure 2. Proceeding from left to right in each row, the labels identify the following. z = −20: Occ, occipital cortex; Amy, amygdala; Hip, hippocampus; ParaHip, parahippocampal gyrus. z, −4: VLPFC, ventral lateral prefrontal cortex; STG, superior temporal gyrus; MTG, middle temporal gyrus. z = +10: Caud, caudate; LPFC, lateral prefrontal cortex; STG, superior temporal gyrus. z = +28: ACC, anterior cingulate cortex; DLPFC, dorsolateral prefrontal cortex. LP, lateral parietal cortex; IP, inferior parietal cortex. z = +46: DMPFC, dorsal medial prefrontal cortex; PreMo, premotor cortex; MFG, middle frontal gyrus; PreCu, precuneus.
In the control group, CVE to spiders activated the subcortical emotion system more strongly than VBE, an effect that was notably absent in the phobic group. As shown in the right‐most column of Figure 3, all of these CVE versus VBE effects within the groups were strong enough to emerge in 3‐way, group × condition × stimulus (target/neutral), interactions.
Direct contrasts of the masked conditions: VBE to spiders and very brief flowers (VBF)
This comparison controls for the effects of masking the target stimuli on neural activity, isolating the effects of exposure to masked fear‐relevant (VBE) versus fear‐irrelevant (VBF) stimuli (Fig. 4). In the phobic group, VBE deactivated DMN regions, and activated the anterior insula (affective evaluation) and right DLPFC regions (attention) more strongly than did VBF. In the control group, by contrast, VBF activated occipital and superior parietal regions (vision/visual attention) more than VBE.
Figure 4.
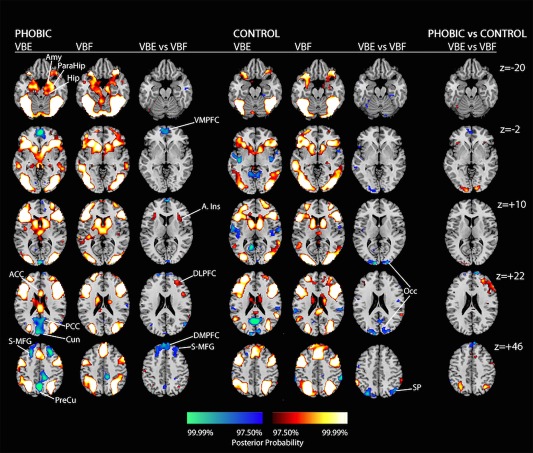
Representative slices of the posterior probability maps generated by direct contrasts of the very brief exposure (VBE) to spiders and very brief flower conditions within each diagnostic group (phobic and control), and the corresponding condition contrasts. Coding of the color scales is as in Figure 2. Proceeding from left to right in each row, the labels are: z = −20: Amy, amygdala; Hip, hippocampus; ParaHip, parahippocampal gyrus. z = −2: VMPFC, ventral medial prefrontal cortex. z = +10: A.Ins, insula; Occ, occipital cortex. z = +22: ACC, anterior cingulate cortex; PCC, posterior cingulate cortex; Cun, cuneus; DLPFC, dorsolateral prefrontal cortex. z = +46: S‐MFG, superior‐middle frontal gyrus; PreCu, precuneus; DMPFC, dorsal medial prefrontal cortex; SP, superior parietal cortex.
Beta coefficients for the groups in each condition
In a subtraction paradigm, activations can be driven either by increased response to target stimuli or decreased response to neutral stimuli (and conversely for patterns of deactivation). To distinguish between these possibilities, we extracted beta coefficients from each participant's contrast maps for each condition. Figure 5 shows bar graphs for a representative sample of brain regions. “Active” bars refer to the target stimuli in each condition—CV spiders, VB spiders, or VB flowers; “Neutral” bars refer to the neutral stimuli. In the phobic group during CVE, baseline activity of task‐positive regions (e.g., DLPFC panel) in response to neutral stimuli was higher relative to target activity than in the other conditions, producing a net reduction in activation of those task‐positive regions (Figs. 2 and 3). Beta values also indicated that CV spiders activated the subcortical emotion system more strongly in control than phobic participants, and deactivated regions supporting emotion regulation and higher‐order language in phobic participants (Fig. 2), by suppressing activity of these regions in the phobic group (amygdalae, VMPFC, anterior VLPFC, bilateral MTG).
Figure 5.
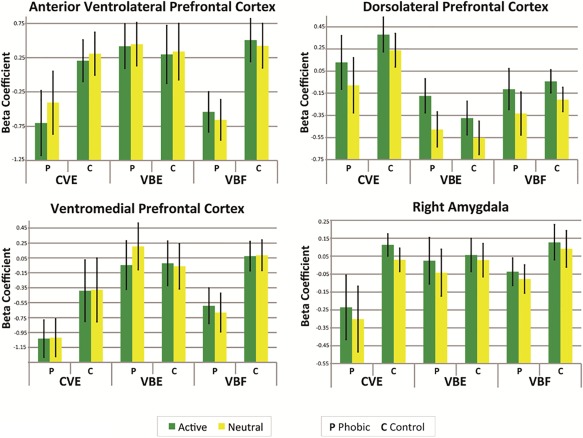
Mean beta coefficients for a representative sample of brain regions for each of the three stimulus conditions, within each diagnostic group. The green bars represent beta values for blocks of target stimuli (active task) in each condition; the yellow bars represent beta values for the blocks of neutral stimuli. CVE, clearly visible exposure to spiders; VBE, very brief exposure to spiders; VBF, very brief flowers; P, phobic group; C, control group.
Beta values indicated that activations during VBE in phobic participants were driven by increased response to VB spiders (e.g., DLPFC and right amygdalae panels). Although VMPFC beta values for VB spiders exceeded those for CV spiders and VB flowers in phobic participants, higher baseline activity in response to neutral stimuli produced a net deactivation of the VMPFC in the phobic group (Fig. 2).
Changes in activation of regions of interest (ROIs) across the conditions
The left panel of Figure 6 shows the activation time courses of ROIs that prior imaging studies have implicated in fear activation and regulation: the right and left amygdala, and the ventral medial prefrontal cortex (VMPFC), respectively (see “Analysis of ROIs,” p. 14). For the sake of brevity, only relevant interaction effects are presented. In phobic participants, activity of the right amygdala decreased significantly across blocks of VB spiders F(3,60) = 2.86, P = 0.044, Eta = 0.35 (linearly, F(1,20) = 5.19, P = 0.034, Eta = 0.45), and did not change across blocks of CV spiders, F(3,60) = 1.11, P = 0.353, or of VB Flowers, F < 1. Contrastingly, VMPFC activity dropped precipitously from early to middle blocks of CV spiders in phobic participants, t(20) = 2.31, P = 0.032, and did not change across blocks of VB spiders or of VB flowers (F < 1).
Figure 6.
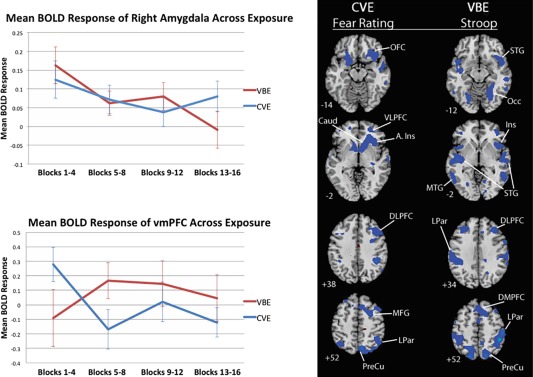
The left panel shows BOLD response of the right amygdala and of the VMPFC across blocks of VBE and CVE to spiders in the phobic group. BOLD response of the right amygdala decreased significantly across blocks of VBE in the phobic group, and did not change significantly across blocks of CVE or blocks of VB flowers. VMPFC activity dropped precipitously from early to middle blocks of CVE to spiders in the phobic group, and did not change significantly across blocks of VBE to spiders or of VB flowers. The right panel shows voxel‐wise, whole‐brain correlations of neural activity during CVE to spiders with on‐line fear ratings, and of activity during VBE to spiders with scores for cognitive interference caused by spider words, as measured by the Spider Stroop task given prior to fMRI scanning. CVE, clearly visible exposure. VBE, very brief exposure. Stroop, Spider Stroop task. Proceeding from top to bottom in each row showing a condition‐measure pair, the labels identify the following regions. CVE‐fear ratings row: OFC, orbital frontal cortex; Caud, caudate; VLPFC, ventral lateral pretfrontal cortex. A.Ins, anterior insula; DLPFC, dorsolateral prefrontal cortex; MFG, middle frontal gyrus; LPar, lateral parietal cortex; PreCu, precuneus. VBE‐Stroop row: STG, superior temporal gyrus; MTG, middle temporal gyrus; Ins, insula; DMPFC, dorsal medial prefrontal cortex.
Correlation analyses of behavioral measures with neural activity
The right panel of Figure 6 shows voxel‐wise correlations of neural activity of the exposure conditions with the explicit and implicit measures of fear: fear ratings given after each block of stimuli during fMRI scanning, and the Spider Stroop task given prior to fMRI scanning. Statistical and clustering thresholds were the same as for the functional imaging data.
Fear ratings during CVE to spiders strongly inversely correlated with activation of task positive regions, and positively correlated with deactivation of DMN regions. Greater fear was associated with less activation of the OFC and insula (affective evaluation), vlPFC and caudate (regulatory functions), DLPFC (attention), and with greater deactivation of DMN regions by CVE in the phobic group. Fear ratings of the phobic group in response to neither VBE to spiders nor VB flowers correlated with neural activations.
Spider Stroop scores—color‐naming interference caused by spider words, an implicit measure of fear—were strongly, inversely correlated with activation of several regions by VBE to spiders in the phobic group. Greater cognitive interference was associated with less activation of regions by VBE: the occipital cortex (vision), DLPFC and bilateral superior parietal cortices (attention), insula and DMPFC (affective evaluation), superior and middle temporal gyri (language). Neither CVE to spiders nor VBF (control) yielded significant correlations of Spider Stroop scores with neural activations in phobic participants.
Phobic beliefs, as assessed by the FSQ, modestly correlated with activations by CVE to spiders. Approaching the tarantula modestly correlated with activations by VBE to spiders. See Supporting Information Figure S2 in section SM2 of the Supporting Information for brain maps of these correlations.
DISCUSSION
Synthesis and Interpretation of Findings
We investigated the neural basis for the adaptive effects of very brief exposure (VBE)—the repeated presentation of masked phobic stimuli—by comparing the effects of VBE to spiders, clearly visible exposure (CVE) to the same images of spiders, and masked, very brief flowers (VBF; control) on the neural activity of spider‐phobic and control participants.
Counter‐intuitively, CVE to spiders activated task‐driven, cortical affective evaluation, and subcortical emotion systems more strongly in control than in phobic participants (Fig. 2). These findings contrast with reviews of imaging studies of Specific Phobia showing that visible feared stimuli activate emotion systems in particular [Del Casale et al., 2012; Linares et al., 2012]. Beta coefficients indicated that weaker activation of task‐driven regions (e.g., occipital cortex, DLPFC) in phobic participants during CVE than VBE was driven by higher baseline activity of corresponding regions in response to neutral stimuli during CVE (Fig. 5), which reduced contrasts in neural activity between blocks of spider and neutral stimuli, thereby weakening activations. These findings suggest that visible spiders produced sustained vigilance in phobic participants ‐ when blocks of ambiguous neutral stimuli (scrambled pieces of the target stimuli) were presented immediately after blocks of visible spiders. A substantial literature attests to hypervigilance by phobic persons [Bar‐Haim et al., 2007; Mogg et al., 2004; Mogg and Bradley, 2002; Rinck and Becker, 2006; Teachman et al., 2012; Williams et al., 1997].
By contrast, beta coefficients indicated that CVE activated a subcortical emotion system more strongly in control participants (Fig. 2) because visible spiders reduced activity of corresponding regions (e.g., amygdalae; Fig. 5, “active task”) in phobic participants. Beta coefficients similarly indicated that CVE deactivated ventral PFC regions supporting emotion regulation and temporal regions supporting higher‐order language in phobic participants (Fig. 2) because visible spiders reduced activity of these regions (Fig. 5). Correspondingly, CVE caused phobic participants to experience significant fear, and BOLD response of the VMPFC dropped precipitously in early blocks of CVE (Fig. 6). Collectively, these findings suggest that CVE induced patterns of neural activity associated with deficient fear regulation.
Whereas CVE to spiders activated the subcortical emotion system more strongly in control than phobic participants, VBE to spiders uniquely activated this system more strongly in phobic than control participants—that is, feared stimuli specifically engaged the subcortical emotion system when recognition of them was severely limited. (Funneled interviews given immediately after each condition showed that both groups were much less likely to identify spiders during VBE than during CVE, and as likely to identify spiders during VBE and VBF.) Consistently, only VBE—neither CVE nor VB flowers—activated subcortical emotion, vision, and attention systems, and regions supporting higher‐order language, more strongly in phobic participants than controls (Fig. 2). That these diagnostic group contrasts in neural activity were specific to VBE shows that masking feared stimuli conferred greater exposure‐related activity in phobic participants that would have otherwise been reduced (as occurred during CVE to spiders). Limiting recognition of feared stimuli facilitated their processing. Consistently, VBE did not induce fear in phobic participants, and generated patterns of neural activity associated with cognitive control (i.e., less cognitive interference, as indexed by Spider Stroop scores). These findings suggest that VBE induced neural activity associated with emotion regulation in phobic participants. Masking exposure to phobic stimuli may reduce threat vigilance, allowing the salience of phobic stimuli to activate and possibly desensitize fear‐processing neural systems, thereby preventing the experience of fear.
Direct contrasts of CVE and VBE to spiders further illustrated how masking phobic stimuli conferred greater exposure‐related processing (Fig. 3). In phobic participants, VBE activated, and CVE deactivated, regions that prototypically support emotion regulation and higher‐order language. Similarly, VBE activated attention, affective and motor control systems more strongly than CVE. The counterintuitive finding of stronger effects of weaker—masked—stimuli are considered to be the most valid indicator of automatic processing [Wiens, 2006]. Thus, these findings suggest that phobic participants processed spiders automatically during VBE. CVE and VBE to spiders showed consistent dissociations in effects on ROIs in phobic participants: whereas VMPFC activity dropped precipitously during CVE and right amygdala activity did not change, right amygdala activity significantly decreased during VBE and VMPFC activity did not change. Whereas CVE caused phobic participants to experience significant fear, and generated neural activity that strongly correlated with fear ratings—explicit fear, VBE did not induce fear and generated activity that strongly inversely correlated with color‐naming interference—implicit fear (Fig. 6). These multiple dissociations between the effects of CVE and VBE suggest that phobic participants consciously processed spiders during CVE, which induced fear, and automatically processed spiders during VBE, which was associated with fear regulation.
While contrasts in neural activity between masked phobic and fear‐irrelevant stimuli—VBE and VBF—were not as pronounced as in prior studies, the latter stimuli—“spider‐flowers”—were quite similar to the phobic stimuli in visual features (Fig. 1). Nonetheless, VBE activated subcortical emotion, vision and attention systems and regions supporting higher‐order language more strongly in phobic than in control participants (Fig. 2), whereas VB flowers did not generate group contrasts (Fig. S1 in section SM2 of Supporting Information). In direct contrasts of these masked conditions in the phobic group, VBE to spiders deactivated DMN regions, and activated regions supporting affective processing and attention more than VB flowers (Fig. 4). These findings suggest that the brain distinguished between similar phobic and fear‐irrelevant stimuli despite limited conscious recognition; that is, masking exposure to phobic stimuli engaged processing of emotional salience.
Relatedly, VBE and CVE to spiders both deactivated Default Mode Network (DMN) regions in phobic participants (Figs. 2 and 3), which subserves internally focused activities (e.g., daydreaming). DMN activity declines when processing task‐active relative to neutral stimuli, producing a “deactivation” of the DMN [Raichle et al., 2001]. To our knowledge, deactivation of the DMN by masked phobic stimuli has not been reported previously. This finding also suggests that masked exposure engages processing of emotional salience.
Limitations and Conclusions
These findings and interpretations must be considered in the context of limitations.
Prior presentation of CVE to spiders may have affected responses to VBE or VBF. If so, VBE would have generated similar patterns of neural activity as CVE, particularly in phobic participants. Thus, carryover effects would weaken findings, not produce spurious ones. However, CVE and VBE to spiders generated quite different patterns of activity in phobic participants, had different effects on fear ratings, and correlated with explicit versus implicit measures of fear, respectively, suggesting that carryover effects were minimized.
Regardless, a limitation of the within‐subjects design is that it only allows us to associate the exposure conditions with patterns of brain activity. It does not allow us to conclude causal mechanisms or directions, which would require experimental manipulation of the exposure conditions as in a randomized controlled trial (i.e., randomization, blinding), which will be the focus of future studies.
Another limitation was that participants did not give trial‐wise responses to the stimuli. This was done to preserve the ecological validity of the exposure task. In VBE, phobic participants are instructed just to focus on—rather than respond to—repeated trains of masked spider images, which has been shown to reduce their avoidance of a live tarantula in prior studies (see Introduction). The study also lacked an objective measure of response to the stimuli, such as eye tracking or a physiological measure. After quickly fixating on spiders, phobic individuals tend to avert gaze [Rinck and Becker, 2006], which may account for reduced activations by CVE to spiders in this group. However, phobic participants rated higher levels of fear after each of 16 blocks of CVE than VBE to spiders, suggesting that they attended to CV spiders. Further, beta coefficients for visual and attentional regions should not be significantly higher during blocks of CV spiders (Fig. 6, DLPFC, “Active” bar) than blocks of neutral stimuli if phobic participants averted gaze when the former stimuli were presented. Consistently, in the funneled interview given immediately after each condition, phobic participants reported that they were able to remain focused when CV spiders were presented. We opted for a self‐reported (fear rating) rather than physiological measure of response to the stimuli because our prior studies have shown that phobic participants' subjective experience of VBE determines whether its therapeutic effects occur, and that CVE induces sympathetic arousal in phobic participants whereas VBE does not (see Introduction). On‐line fear ratings provided a naturalistic, clinically relevant index of emotional reactivity to the stimuli.
In addition to the connection to prior behavioral studies attesting to the fear‐reducing effects of VBE, our findings are consistent with a recent fMRI study that found that fear responses to conditioned stimuli (CS+s) were reduced by pairing rewards with activity patterns in the visual cortex matching the CS+s, even though the participants were not aware they were viewing these stimuli [Koizumi et al., 2016]. However, these were normal participants who were temporarily fear conditioned. Participants in the current study, by contrast, were clearly spider phobic as shown by meeting DSM‐V criteria for Specific Phobia and by exhibiting avoidance of a live tarantula. Regardless, these converging findings from different research paradigms suggest that exposure procedures based on unconscious processing may lead to novel treatments for fear‐related disorders.
In this study, less was more. The multiple dissociations between the effects of masked and visible exposure to phobic images—VBE and CVE—on patterns of neural activity, experienced fear, and correlations with explicit versus implicit measures of fear suggest that limiting awareness of exposure more strongly engaged the processing of phobic stimuli. Counter‐intuitively, CVE to feared stimuli produced greater activity of emotion processing systems and emotion regulation regions in control than in phobic participants, and sustained threat vigilance and induced fear in phobic participants. Masking exposure to feared stimuli (VBE), by contrast, produced greater activity in emotion processing systems and regulatory regions and did not induce fear in phobic participants. Masking exposure may reduce vigilance to threat, allowing the salience of phobic stimuli to activate fear processing systems automatically, while simultaneously preventing the experience of fear. Future studies are needed to clarify the fear regulatory mechanisms of masked exposure (e.g., extinction, desensitization), and to test the hypothesis suggested by our findings: masked exposure engages emotional salience processing in phobic persons for an adaptive purpose, the recruitment of regulatory systems that inhibit fear.
Supporting information
Supporting Information
ACKNOWLEDGMENTS
The research was made possible by the provision of MRI data by New York State Psychiatric Institute and Columbia University, New York, NY.
Supplemental funding for MRI scans was provided by a Research Grant from the Fund for Psychoanalytic Research of the American Psychoanalytic Association, and Faculty Support Awards from Purchase College to Dr. Paul Siegel. Collection of crucial pilot data was funded by grants from the Society for Neuropsychoanalysis and from the International Psychoanalytic Association to Dr. Paul Siegel.
The authors declare that they have no conflict of interests.
REFERENCES
- Alpers GW, Gerdes AM, Lagarie B, Tabbert K, Vaitl D, Stark R (2009): Attention and amygdala activity: An fMRI study with spider pictures in spider phobia. J Neur Trans 116:747–757. [DOI] [PubMed] [Google Scholar]
- Amunts K, Kedo O, Kindler M, Pieperhoff P, Mohlberg H, Shah NJ, Habel U, Schneider F, Zilles K (2005): Cytoarchitectonic mapping of the human amygdala, hippocampal region and entorhinal cortex: intersubject variability and probability maps. Anat and Embryology 210:343–352. [DOI] [PubMed] [Google Scholar]
- Balderston NL, Helstetter FJ (2010): Conditioning with masked stimuli affects the time course of skin conductance responses. Behav Neurosci 4:478–489. [DOI] [PMC free article] [PubMed] [Google Scholar]
- Bar‐Haim Y, Lamy D, Pergamin L, Bakermans‐Kranenburg MJ, van IJzendoorn MH (2007): Threat‐related attentional bias in anxious and nonanxious individuals: A meta‐analytic study. Psychol Bull 133:1–−24. [DOI] [PubMed] [Google Scholar]
- Carlsson K, Petersson KM, Lundqvist D, Karlsson A, Ingvar M, Öhman A. (2004): Fear and the amygdala: Manipulation of awareness generates differential cerebral responses to phobic and fear‐relevant (but nonfeared) stimuli. Emotion 4:340– 353. [DOI] [PubMed] [Google Scholar]
- Del Casale A, Ferracuti S, Rapinesi C, Serata D, Piccirilli M, Savoja V (2012): Functional neuroimaging in Specific Phobia. Psychiatry Res: Neuroimaging 202:181–197. [DOI] [PubMed] [Google Scholar]
- Delgado MR, Nearing KI, LeDoux JE, Phelps EA (2008): Neural circuitry underlying the regulation of conditioned fear and its relation to extinction. Neuron 59:829–838. [DOI] [PMC free article] [PubMed] [Google Scholar]
- Eklund A, Nichols TE, Knutsson H (2016): Cluster failure: Why fMRI inferences for spatial extent have inflated false positive rates. PNAS 113:7900–7905. [DOI] [PMC free article] [PubMed] [Google Scholar]
- Esteves F, Dimberg U, Öhman A (1994): Automatically elicited fear: Conditioned skin conductance responses to masked facial expressions. Cog Emot 8:393–413. [Google Scholar]
- Etkin A, Klemenhagen KC, Dudman JT, Rogan MT, Hen R, Kandel ER, Hirsch J (2004): Individual differences in trait anxiety predict the response of the basolateral amygdala to unconsciously processed fearful faces. Neuron 44:1043–1055. [DOI] [PubMed] [Google Scholar]
- First MB, Spitzer RL, Gibbon M, Williams JBW (1997): Structured Clinical Interview for DSM‐IV Axis I Disorders. Washington, DC: American Psychiatric Association. [Google Scholar]
- Friston KJ, Penny W (2003): Posterior probability maps and SPMs. NeuroImage 19:1240–1249. [DOI] [PubMed] [Google Scholar]
- Friston KJ, Glaser DE, Henson RA, Kiebel S, Phillips C, Ashburner J (2002): Classical and bayesian inference in neuroimaging: Applications. NeuroImage 16:484–512. [DOI] [PubMed] [Google Scholar]
- Fyer AJ (1998): Current approaches to etiology and pathophysiology of specific phobia. Biological Psychiatry 44:1295–1304. [DOI] [PubMed] [Google Scholar]
- Hermann A, Schäfer A, Walter B, Stark R, Vaitl D, Schienle A (2009): Emotion regulation in spider phobia: Role of the medial prefrontal cortex. SCAN 4:257–267. [DOI] [PMC free article] [PubMed] [Google Scholar]
- Katkin ES, Wiens S, Ohman A (2001): Nonconscious fear conditioning, visceral perception, and the development of gut feelings. Psychol Sci 12:366–370. [DOI] [PubMed] [Google Scholar]
- Klein TA, Neumann J, Reuter M, Hennig J, von Cramon DY, Ullsperger M (2007): Genetically determined differences in learning from errors. Science 318:1642–1645. [DOI] [PubMed] [Google Scholar]
- Koizumi A, Amano K, Cortese A, Shibata K, Yoshida W, Seymour B, Kawato M, Lau H (2016): Fear reduction without fear through reinforcement of neural activity that bypasses conscious exposure. Nature Hum Behavior 1:0006. [DOI] [PMC free article] [PubMed] [Google Scholar]
- Larson CL, Schaefer HS, Siegle GJ, Jackson CA, Anderle MJ, Davidson RJ (2006): Fear is fast in phobic individuals: Amygdala activation in response to fear‐relevant stimuli. Biol Psychiatry 60:410–417. [DOI] [PubMed] [Google Scholar]
- Leuken U, Kruschwitz JD, Muehlhan M, Siegert J, Hoyer J, Wittchen HU (2011): How specific is specific phobia? Different neural response patterns in two subtypes of specific phobia. NeuroImage 56:363–372. [DOI] [PubMed] [Google Scholar]
- Linares IP, Trzesniak C, Chagas MN, Hallak JC, Nardi AE, Crippa JS (2012): Neuroimaging in specific phobia disorder: A systematic review of the literature. Rev Bras Psiquiatria 34:101–111. [PubMed] [Google Scholar]
- Lipka J, Miltner WR, Straube T (2011): Vigilance for threat interacts with amygdala responses to subliminal threat cues in specific phobia. Biol Psychiatry 70:472–478. [DOI] [PubMed] [Google Scholar]
- Magee WJ, Eaton W, Wittchen H, McGonagle KA, Kessler RC (1996): Agoraphobia, simple phobia, and social phobia in the National Comorbidity Survey. Arch Gen Psychiatry 53:159–168. [DOI] [PubMed] [Google Scholar]
- Mogg K, Bradley BP (2002): Selective orienting of attention to masked threat faces in social anxiety. Behav Res Ther 40:1403–1414. [DOI] [PubMed] [Google Scholar]
- Mogg K, Philippot P, Bradley BP (2004): Selective attention to angry faces in clinical social phobia. J Abnorm Psychol 113:160–165. [DOI] [PubMed] [Google Scholar]
- Morris JS, Öhman A, Dolan RJ (1998): Conscious and unconscious emotional learning in the human amygdala. Nature 393:467–470. [DOI] [PubMed] [Google Scholar]
- Morris JS, Öhman A, Dolan RJ (1999): A subcortical pathway to the right amygdala mediating “unseen” fear. Proc Natl Acad Sci 96:1680–1685. [DOI] [PMC free article] [PubMed] [Google Scholar]
- Neumann J, Lohmann G (2003): Bayesian second‐level analysis of functional magnetic resonance images. NeuroImage 20:1346–1355. [DOI] [PubMed] [Google Scholar]
- Newman LS, McKinney LC (2002): Repressive coping and threat avoidance: An idiographic stroop study. Pers Soc Psychol Bull 28:409–422. [Google Scholar]
- Öhman A, Mineka S (2001): Fears, phobias, and preparedness: Toward an evolved module of fear and fear learning. Psychol Rev 108:483–522. [DOI] [PubMed] [Google Scholar]
- Öhman A, Soares J (1993): On the automatic nature of phobic fear: Conditioned electrodermal responses to masked fear‐relevant stimuli. J Abnorm Psychol 102:121–132. [DOI] [PubMed] [Google Scholar]
- Öhman A, Soares J (1994): “Unconscious anxiety”: Phobic responses masked stimuli. J Abnorm Psychol 103:231–240. [DOI] [PubMed] [Google Scholar]
- Öhman A, Soares J (1998): Emotional conditioning to masked stimuli: Expectancies for aversive outcomes following nonrecognized fear‐relevant stimuli. J Exp Psychol: Gen 127:69–82. [DOI] [PubMed] [Google Scholar]
- Phelps EA, Delgado MR, Nearing KI, LeDoux JE (2004): Extinction learning in humans: Role of the Amygdala and vmPFC. Neuron 43:897–905. [DOI] [PubMed] [Google Scholar]
- Raichle ME, MacLeod AM, Snyder AZ, Powers WJ, Gusnard DA, Shulman GL (2001): A default mode of brain function. Proc Natl Acad Sci 98:676–682. [DOI] [PMC free article] [PubMed] [Google Scholar]
- Rinck M, Becker ES (2006): Spider fearful individuals attend to threat, then quickly avoid it: Evidence from eye movements. J Abnorm Psychol 115:231–238. [DOI] [PubMed] [Google Scholar]
- Schweckendiek J, Klucken T, Merz CJ, Tabbert K, Walter B, Ambach W, Vaitl D, Stark R (2011): Weaving the (neuronal) web: Fear learning in spider phobia. NeuroImage 54:681–688. [DOI] [PubMed] [Google Scholar]
- Siegel P, Gallagher KA (2015): Delaying in vivo exposure to a tarantula with very brief exposure to phobic stimuli. J Behav Ther Exper Psychiatry 46:182–188. [DOI] [PubMed] [Google Scholar]
- Siegel P, Warren R (2013a): The effect of very brief exposure on the subjective experience of fear induced by in vivo exposure. Cog Emotion 27:1013–1022. [DOI] [PubMed] [Google Scholar]
- Siegel P, Warren R (2013b): Less is still more: Maintenance of the very brief exposure effect one year later. Emotion 13:338–344. [DOI] [PubMed] [Google Scholar]
- Siegel P, Weinberger J (2009): Very brief exposure: The effects of unreportable stimuli on fearful behavior. Consc Cognit 18:939–951. [DOI] [PubMed] [Google Scholar]
- Siegel P, Weinberger J (2012): Less is more: The effects of very brief versus clearly visible exposure on spider phobia. Emotion 12:394–402. [DOI] [PubMed] [Google Scholar]
- Siegel P, Anderson JF, Han E (2011): Very brief exposure II: The effects of unreportable stimuli on phobic behavior. Consc Cognit 20:181–190. [DOI] [PubMed] [Google Scholar]
- Szymanski J, O'Donohue W (1995): Fear of spiders questionnaire. J Behav Ther Exper Psychiatry 26:31–34. [DOI] [PubMed] [Google Scholar]
- Teachman BA, Joormann J, Steinman SA, Gotlib IH (2012): Automaticity in anxiety disorders and major depressive disorder. Clin Psychol Rev 32:575–603. [DOI] [PMC free article] [PubMed] [Google Scholar]
- Weinberger J, Siegel P, Siefert C, Drawl J (2011): What You Can't See Can Help You. Consc Cognit 20:173–180. [DOI] [PubMed] [Google Scholar]
- Whalen PJ, Rauch SL, Etcoff NL, McInerney SC, Lee MB, Jenike MA (1998): Masked presentations of emotional facial expressions modulate amygdala activity without explicit knowledge. J Neurosci 18:411–418. [DOI] [PMC free article] [PubMed] [Google Scholar]
- Whalen PJ, Kagan J, Cook RG, Davis FC, Kim H, Polis S, McLaren DG, Somerville LH, McLean AA, Maxwell JS, Johnstone T (2004): Human amygdala responsivity to masked fearful eye whites. Science 306:2061. [DOI] [PubMed] [Google Scholar]
- Wiens S (2006): Current concerns in visual masking. Emotion 6:675–680. [DOI] [PubMed] [Google Scholar]
- Williams JG, Matthews A, Macleod C (1996): The emotional stroop task and psychopathology. Psychol Bull 120:3–24. [DOI] [PubMed] [Google Scholar]
- Williams JMG, Watts FN, MacLeod C, Mathews A (1997): Cognitive Psychology and Emotional Disorders, 2nd ed Chichester, England: John Wiley & Sons, Inc. [Google Scholar]
- Williams LM, Das P, Liddell BJ, Kemp AH, Rennie CJ, Gordon E (2006): Mode of functional connectivity in amygdala pathways dissociates level of awareness for signals of fear. J Neurosci 26:9264–9271. [DOI] [PMC free article] [PubMed] [Google Scholar]
Associated Data
This section collects any data citations, data availability statements, or supplementary materials included in this article.
Supplementary Materials
Supporting Information