Abstract
Gas vesicles are a new and unique class of biologically derived ultrasound contrast agents with sub-micron size whose acoustic properties have not been fully elucidated. In this study, we investigated the acoustic collapse pressure and behavior of Halobacterium salinarum gas vesicles at transmit center frequencies ranging from 12.5 to 27.5 MHz. The acoustic collapse pressure was found to be above 550 kPa at all frequencies, 9 fold higher than the critical pressure observed in hydrostatic conditions. We show that gas vesicles behave non-linearly when exposed to ultrasound at incident pressure ranging from 160 kPa to the collapse pressure, and generate second harmonic amplitudes of −2 to −6 dB below the fundamental in media with viscosities ranging from 0.89 to 8 mPa.s. Simulations performed using a Rayleigh-Plesset type model accounting for buckling, and a dynamic finite element analysis, suggest that buckling is the mechanism behind the generation of harmonics. We found good agreement between the level of second harmonic relative to the fundamental measured at 20 MHz and the Rayleigh-Plesset model predictions. Finite element simulations extended these findings to a non-spherical geometry, confirmed that the acoustic buckling pressure corresponds to the critical pressure in hydrostatic conditions, and support the hypothesis of limited gas flow across the GV shell during the compression phase in the frequency range investigated. From simulations, estimates of GV bandwidth-limited scattering indicate that a single GV has a scattering cross-section comparable to that of a red blood cell. These findings will inform the development of GV-based contrast agents and pulse sequences to optimize their detection with ultrasound.
Keywords: Submicron gas vesicles, contrast agent, high frequency ultrasound, buckling, modeling
Introduction
Gas vesicles (GVs) are a unique class of biologically-derived, gas-filled protein nanostructures recently described as a new type of ultrasound contrast agent (UCA) (Shapiro et al, 2014). GVs are formed by certain species of archaea and bacteria as a means to regulate cellular buoyancy. They are made principally of a small protein (GvpA) arranged in a crystalline array, along ribs that form the GV shell, and another protein (GvpC) that adheres to the outside of the shell and stabilizes the GV structure. Small pores in the shell allow for the inner gas to be in constant equilibrium with dissolved gas in the surrounding medium. Therefore, the inner gas remains at atmospheric pressure, and external pressure is born solely by the shell. The inner side of the shell is hydrophobic, preventing the nucleation of liquid water in the GV interior. GV shape and size depend on the species that generate them. They are generally cylindrical and terminated by conical caps in cyanobacteria, with a diameter from 45 to 120 nm and a length from 100 nm to over 1 μm. On the other hand, halobacteria-derived GVs are described as having a lemon shape and a width sometimes larger than 200 nm. Both shape and size affect GV buoyancy and resistance to external pressure. An extensive description of GVs from molecular composition to physical properties can be found in a review paper by Walsby (1994), and GV genetics and regulation are reviewed by Pfeifer (2012).
In structure, GVs bear similarity to microbubbles used clinically as UCAs, i.e. a gas core encapsulated in a shell. However, as opposed to microbubbles, which remain in the vasculature, their smaller size could potentially allow GVs to exit the intravascular space into solid tumors, benefiting from the enhanced permeability and retention properties of these tissues (Campbell, 2006). GVs exhibit also other major differences with microbubbles, in shape, shell composition, elastic properties (much stiffer, the Young’s modulus of the shell was estimated at around 2.8 GPa) and shell permeability to gas, all of which could affect their acoustic behavior, and as a consequence their potential as UCAs. In the initial study of GVs as UCAs (Shapiro et al., 2014), it was demonstrated that Halobacterium salinarum GVs (Halo GVs) produce contrast in vivo in mouse liver using an amplitude modulation scheme implemented on a preclinical ultrasound scanner, and have the ability to be collapsed with ultrasound. At 6 MHz and an incident pressure of 98 kPa, backscattered signals from Halo GVs contained harmonics, which were associated with a nonlinear acoustic behavior from these structures. At this frequency, the incident acoustic pressure at which Halo GVs collapsed was found to be three to five fold higher than the collapse pressure in hydrostatic conditions. Both, the reason for the discrepancy between acoustic and hydrostatic collapse pressures and the mechanisms behind the generation of harmonics remained unclear.
In the present study, we report on the acoustic collapse pressure and behavior of Halo GVs when exposed to ultrasound at center frequencies ranging from 12.5 to 27.5 MHz. Experimental results are compared to predictions from simulations performed using a phenomenological 1-D Rayleigh-Plesset type model of oscillations including buckling. A dynamic 3D finite element model is also used to determine the buckling load of a more realistic lemon-shape GV with elastic properties found in the literature (Walsby 1994), and investigate the influence of gas flow through the shell on GV dynamics and risk of shell failure. Together, these experiments and simulations shed light on different aspects of GV acoustic behavior that could not be addressed with any one method.
Material and methods
Hydrostatic collapse pressure measurements
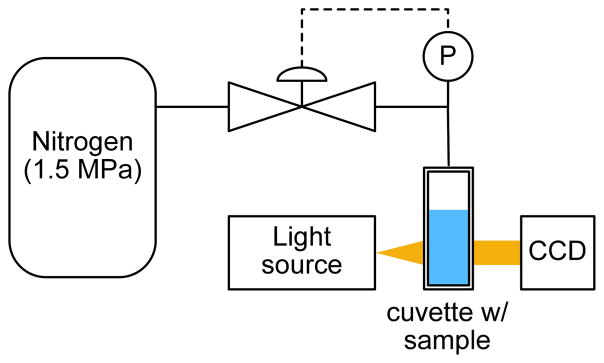
Halo GVs were purified and quantified as previously described (Shapiro et al. 2014). GVs were diluted to an optical density equal to 1.0 (at 500 nm: OD500) in PBS and 0.4 ml of the solution was loaded into an absorption cell (176.700-QS, Hellma GmbH & Co. KG, Müllheim, Germany). A single valve pressure controller (PC series, Alicat Scientific, Tuscon, AZ, USA) supplied by a 1.5 MPa nitrogen gas source applied hydrostatic pressure in the cell, while a microspectrometer (STS-VIS, Ocean Optics, Dunedin FL, USA) measured the optical density of the sample at 500 nm as shown in Figure 1. OD500 was measured from 0 to 200 kPa gauge pressure with a 10 kPa step size and a 7 second equilibration period at each pressure. The light source generated a 1-mm diameter beam that was positioned 10 mm below the air-water interface. At this distance and timescale we do not expect the air pressure inside the GVs to increase due to gas diffusion from the headspace.
Figure 1.
Schematic for Halo GV hydrostatic collapse pressure measurements.
Acoustical setup
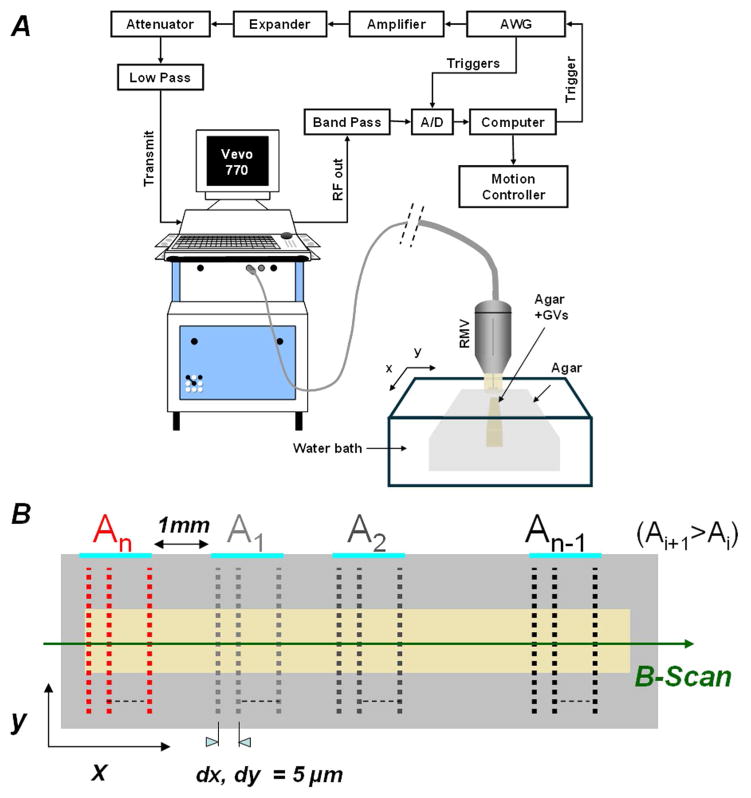
The acoustic collapse pressure and behavior of Halo GVs were investigated in vitro using the setup in Figure 2-A. This setup was developed from a Vevo770 imaging system and RMV probes (VisualSonics, Toronto, Ontario, Canada). It included a custom transmit path which bypassed the Vevo770 transmit electronics. An arbitrary waveform generator (AWG2021, Tektronix, Beaverton, OR, USA) was used to generate 6-cycle long, cosine tapered (over half cycle on both side) pulses at half the center frequency of the probe. Pulses were amplified by a 60-dB power amplifier (M3205, American Microwave Technology, Anaheim, CA, USA) and transmitted through an expander, a series of attenuators (12 dB total) and filters to one of the three transducers (25, 40 and 55 MHz center frequency) used in this study. Received signals were pre-amplified using stages of gain from the Vevo770, band-pass filtered and digitized at a 500-MHz sampling frequency by an A/D converter (DP 210, Acqiris, Geneva, Switzerland).
Figure 2.
Acoustical measurement setup (A). Schematic of the pulse transmission grid for GV collapse pressure estimation (B).
The probe beam characteristics and pressure levels were determined from measurements performed in water using a 40-μm needle hydrophone (HPM04/01, Precision Acoustics, Dorchester, Dorset, UK), which was calibrated to 60 MHz (National Physical Laboratory, Teddington, Middlesex, UK). Details regarding probe characteristics, filters used on transmit and receive, and pressure ranges are summarized in Table 1.
Table 1.
Characteristics of the probes and filters (HP: high pass, LP: low pass)
| Probe | Pulse frequency (MHz) | Focal distance (mm) | −6dB beamwidth (μm) | −1dB focal zone (mm) | Transmit filters (MHz) | Receive filters (MHz) | Pressure at focus (kPa) |
|---|---|---|---|---|---|---|---|
| RMV710 (25MHz) | 12.5 | 15 | 330 | 14.2–16 | 21.4 LP | 1 HP 70 LP |
214–1402 |
| RMV704 (40MHz) | 20 | 6.2 | 166 | 5.9–6.6 | 15 HP 30 LP |
217–1161 | |
| RMV708 (55MHz) | 27.5 | 4.5 | 158 | 4.4–5.2 | 50 LP | 160–1070 |
GV ultrasound collapse pressure
Collapse pressure was investigated in two sets of experiments performed in a phantom consisting of GVs embedded in a low concentration agar matrix. In such a phantom, GV motion potentially induced by micro-streaming and/or radiation force was prevented.
Sample preparation was identical for both sets of experiments. A 1% (w/w) agar gel solution was prepared by mixing agar powder (cat. 28210, Becton, Dickinson and Company, Franklin Lakes, NJ, USA) in degassed deionized water at 86°C. The solution was poured in a cast, 7.5×10×1.3 cm (W×L×D), and let solidify at room temperature. A feature in the middle of the cast created a 0.4×4×0.7 cm (W×L×D) groove in the middle of the agar matrix. A second solution of 1% agar was prepared with deionized (but not degassed) water at 86°C and let cool down to 45°C. At this time, 300 μL of Halo GV solution (at OD500 =2.0) was mixed with 900 μL of agar solution in a pipette, providing 1200 μL GV-agar solution at OD500 =0.5 (~ 6×10⁹ GVs/mL). The mixture was poured into the groove of the previously prepared agar matrix, and cooled down to room temperature. Acoustic experiments were performed within 5 hours of sample preparation.
For the first set of experiments, the sample was positioned in a deionized water bath at room temperature, with its top surface at approximately 5.5 mm from the RMV704. The sample was divided into n=16 regions, 6×1 mm in size (Figure 2-B: along y and x, respectively), separated by 1mm along the x axis. Each region was exposed to one of 16 transmit pressure levels Ai ( 0 ≤ i ≤ n ) in the 217 to 1161 kPa range. The probe was moved in a raster scan pattern over each region using a computer controlled micro-positioning system, to a series of locations separated by 5 μm in both scanning directions. At each location, one 6-cycle 20-MHz pulse (half the center frequency of the probe) was transmitted. The 5-μm step size (dx, dy) guaranteed that all GVs in the region received at least one pulse at the chosen transmit pressure level.
Once all 16 regions were exposed, a first B-scan was acquired along the middle of the sample, at a 20-μm step size, using the lowest transmitted pressure. Acquired RF signals were demodulated, log-compressed and displayed over a 30dB dynamic range. From this image, the lowest pressure at which disappearance of GVs was observed was determined, and a second B-scan was performed at the pressure level just below, in order to increase the signal-to-noise ratio. The collapse pressure was finally estimated as the first pressure at which GV backscattered signal disappeared. All RF signals in this study were processed using Matlab (Mathworks, Natick, MA, USA).
The second set of experiments was performed in a similar manner, at three different transmit frequencies: 12.5, 20, and 27.5 MHz, with the RMV710, RMV704, and RMV708 scanheads, respectively. In these experiments, a train of 100 identical pulses were transmitted at each location in each region, and backscattered signals were digitized at 500 MHz. The distances dx and dy between locations was increased to 200 μm (> half the −6dB beam width of the RMV710 at 12.5 MHz; see Table 1), in order to prevent GV collapse in adjacent locations before their ultrasound interrogation.
The power spectra of the acquired signals corresponding to the −1dB focal zones of the probes were calculated, and, for each transmitted pulse, spatially averaged over the region (in the strip containing GVs). The noise floor (estimated from signals acquired in the adjacent agar matrix) was subtracted from the average power spectrum, which was subsequently corrected for the receive gain, transfer functions of the receive filters and receive transfer function of the transducers (Sprague et al. 2011).
For each transmitted pulse, at each transmitted pressure and transmitted frequency, the power at the fundamental frequency (f0) was estimated as the average, over the −3dB bandwidth of the transmitted pulse, of the spatially averaged power spectra. The collapse pressure, at a given frequency, was estimated as the pressure for which the power obtained from the 100th pulse was at least 1 dB lower than the power obtained from the 1st pulse.
GV acoustic behaviour
The behaviour of GVs was investigated by measuring the level of second harmonic relative to the fundamental in the backscattered signals from the −1 dB focal zone of each probe, as a function of frequency and transmitted pressure. The second harmonic power was estimated from the RF signals in the second set of experiments, previously described, as the average power over the same bandwidth as the fundamental, but centered at the second harmonic frequency (2f0). The range of transmitted pressure was limited on the upper side to the maximum pressure for which no collapse has been detected.
These experiments and data analysis were also performed with linear scatterers embedded in agar. Microspheres, 1.5 μm in diameter (Polybead Polystyrene, cat#17133, Polysciences Inc., Warrington, PA, USA), were mixed with a 1% agar solution at 45°C, at a concentration of 1.35% (w/v), corresponding to approximately 6.8×10⁹ beads/mL. The harmonics backscattered in these experiments would originate from linear scattering by the particles of harmonics either generated during either ultrasound nonlinear propagation or transmitted by the transducer. The comparison of the second harmonic-to-fundamental ratios from polystyrene beads and GVs should indicate if the latter behave as linear scatterers or oscillate nonlinearly in the ultrasound field.
A third set of experiments was carried out with GVs in solution for comparison with theoretical modeling. GVs were diluted in phosphate buffer saline (Gibco PBS pH 7.4 (1X), Life Technologies Corporation, Grand Island, NY, USA) and in four sucrose solutions of viscosity ranging from 2 to 8 mPa.s (Table 2). This range of viscosities was selected to cover the viscosities measured in plasma, serum and whole human blood (Rosenson et al 1996). The solutions were injected in a wall-less phantom consisting of a channel, 1.5×1.5 mm in square section and 5 cm in length, in a 1% agar concentration matrix. The channel, which was positioned 2 mm under the matrix surface, was scanned along 4 cm, in its middle, with a step size of 200 μm. At each location 100 6-cycle 20-MHz pulses, at the highest pressure level under collapse pressure (i.e. 576 kPa), were transmitted and RF data collected. Data were processed as previously described, with the background noise being estimated from RF data collected from water alone circulating in the channel. The power spectrum was averaged spatially and over the number of acquired RF lines at each location. The average power spectrum was corrected for the attenuation in the GV solutions (but not for the remaining path in agar or water), sensitivity of the transducer, and transfer functions of all electronic components used on receive. Attenuation in GV solutions was estimated in a separate set of experiments using a substitution technique (data not shown).
Table 2.
Physical properties of the solutions used in the third set experiments and in simulations.
| Medium | ρ (kg/m3) | C (m/s) | σ (N/m) | μ (mPa.s) | GVs/mL |
|---|---|---|---|---|---|
| PBS ph 7.4 (×1) | 1000 | 1557 | 0.2 | 0.9 | 6×10⁹ |
| Sucrose (300 g/L) | 1094 | 1587 | 2 | ||
| Sucrose (553 g/L) | 1156 | 1631 | 4 | ||
| Sucrose (700 g/L) | 1184 | 1677 | 6 | ||
| Sucrose (804 g/L) | 1200 | 1717 | 8 |
Rayleigh-Plesset Modeling
Phenomenological modelling of GV oscillations was based on the Marmottant’s model of solid shell bubbles (Marmottant et al. 2005 and 2011), which takes into account shell buckling. The rationale behind the choice of this model is that for GVs to collapse above a critical applied hydrostatic pressure as reported by Walsby (1994), the shell must undergo a buckling phase. As for all unidimensional models of microbubble oscillations found in the literature, a spherical shell, isotropic in its elastic properties and non-porous (no gas exchange occurs across the shell), was assumed. Due to the non-spherical shape of GVs, the variable R of the model will not represent an exact geometrical dimension of the GVs, but similarly to Marmottant’s model during the buckling phase, the radius of a sphere of volume equivalent to the GV volume (effective radius) during all phases of its volume oscillations. The isotropy of the shell elastic properties will not be discussed here. The assumption of negligible gas exchange across the shell during GV oscillations at the frequency investigated in this study is based on findings by Walsby (1992), who reported, for the membrane of Mycrocistis gas vesicles, an oxygen permeability coefficient of 32 mm.s−1. An extrapolation of those findings to Halo GVs, assuming an identical permeability coefficient, and a spherical geometry would lead to an exponential filling time of 1.5 μs, much larger than the period of the ultrasound pulse transmitted in this study (80 ns at 12.5 MHz). We also assumed that the shell was purely elastic, i.e. there was no viscous term associated with the shell in the model. With the assumptions described above, neglecting the inertia of the shell itself, and integrating the modified Herring’s correction for compressibility of the surrounding liquid, the Rayleigh-Plesset type (RP) equation describing the oscillations of GVs under exposure to ultrasound used in this study is:
| Eq. 1 |
In this equation, R, Ṙ and R̈ are the effective radius and its first and second time derivatives, and R0, the radius at equilibrium in the liquid. Patm, Ps, PL, Ph and Pa are the atmospheric pressure, pressure differential across the shell, Laplace pressure due to the shell-liquid interfacial tension, hydrostatic pressure and acoustic pressure, respectively. ρl is the liquid density, n, the gas polytropic index, and μ the liquid viscosity.
The radiated sound pressure at a distance r was calculated from the effective radius and its derivatives:
| Eq. 2 |
Shell contribution
The pressure differential Ps across the shell is a function of the in-plane stresses in the shell material, and as in Marmottant’s model, depends on the state of the shell:
| Eq. 3 |
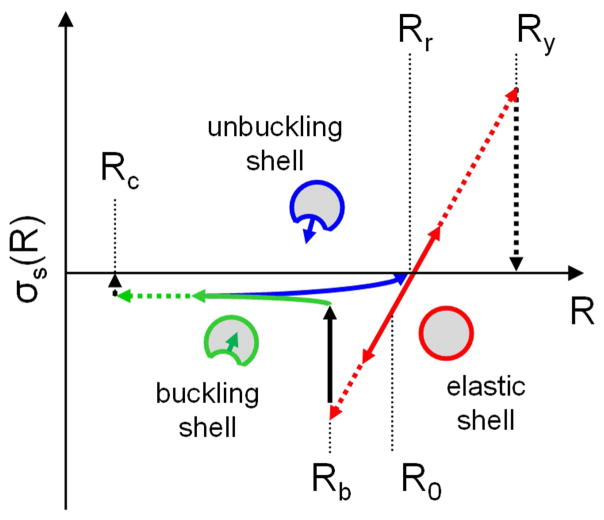
where KR the elastic modulus of the shell. Ps corresponds to an effective shell tension displayed schematically in Figure 3 :
| Eq. 4 |
Figure 3.
Shell tension as a function of effective R. In the unbuckled state and upon exposure to an acoustic pressure, shell tension varies linearly with R (red line) between the buckling radius Rb and the yield radius Ry. If during the oscillations, R reaches Rb, buckling of the shell occurs which leads to a dramatic drop of the absolute value of the shell tension (solid black arrow) followed by a slow decrease towards a plateau as R decreases (solid green line). During the unbuckling phase, shell tension further decreases to reach a value of 0 at the relaxed radius Rr, at which point the shell retrieves its unstressed state and returns to the elastic regime on expansion.
For the unbuckled shell (Eq. 3-a), the expression corresponds to the relationship between the uniform radial load applied to the outside of a thin spherical shell and the shell radius, where T is the shell thickness, Rr the “relaxed” shell radius, E the Young’s modulus of the shell material, and ν the Poisson’s ratio. In our case, Rr would represent the radius of a GV in air, at equilibrium (inner gas pressure is equal to the atmospheric pressure). The relationship between Rr and R0 can be established from the balance of pressures across the shell when the GV is at equilibrium in the liquid, and is given by:
| Eq. 5 |
For the buckling phase (on compression, Eq. 3-b), the relationship is a translation in our parameter space of the first equation in the Appendix B of Marmottant et al. (2011). This equation was derived from the expression of the elastic energy of a spherical shell affected by an axisymmetric depression (Quilliet et al., 2008). The buckling radius Rb can be related to the elastic properties of the shell, its thickness and its radius Rr, by equating the unbuckled pressure Ps (R b) to the theoretical buckling load of a thin spherical shell given by (Landau and Lifshitz, 1997):
| Eq. 6 |
The buckling radius is therefore:
| Eq. 7 |
For the unbuckling phase (on expansion, Eq. 3-c), it was assumed, without theoretical foundation that the pressure differential would further decrease (in absolute value) linearly with R, to reach zero when the whole shell retrieves its relaxed radius Rr, and returns to the elastic regime. In this expression, Rmin is the lowest R reached during the buckling phase.
Shell-liquid interfacial tension
In the unbuckled state the shell-liquid interfacial tension results in a uniform Laplace pressure over the shell surface area PL acting inwardly. This is certainly not the case in the buckled state. Marmottant et al. (2011, Fig. 1) showed in simulation work, that during the buckling phase, in a quasi-static deflation of a thin spherical shell structure, an inverted cap appears in the surface of the shell, which progresses into the volume as load increases. In our work, we assumed that part of the shell retrieves instantaneously its relaxed radius of curvature Rr upon buckling, and that the inverted cap radius of curvature is also Rr. In this shell deformation model, the change in volume of the GV is only due to the progression of the cap into the volume, therefore, to the forces acting on the cap itself. The shell-liquid interfacial tension on the inverted cap results in a net force pointing outward. This can be summarized in terms of Laplace pressure PL by:
| Eq. 8 |
Furthermore, as pointed out by Walsby (1994), given the dimension of a Halo GV, it is necessary for the outer surface to be hydrophilic in order to reduce the shell-liquid interfacial tension. For GVs to be stable in water, Laplace pressure PL must be inferior to the buckling pressure, or else buckling would occur instantaneously. This puts a limit on the value of the interfacial tension:
| Eq. 9 |
Given the GV dimension and buckling pressure that were used in the simulation, this limit is of the order of 1% of water surface tension (0.072 N/m), for Ph = 0.
Simulation parameters
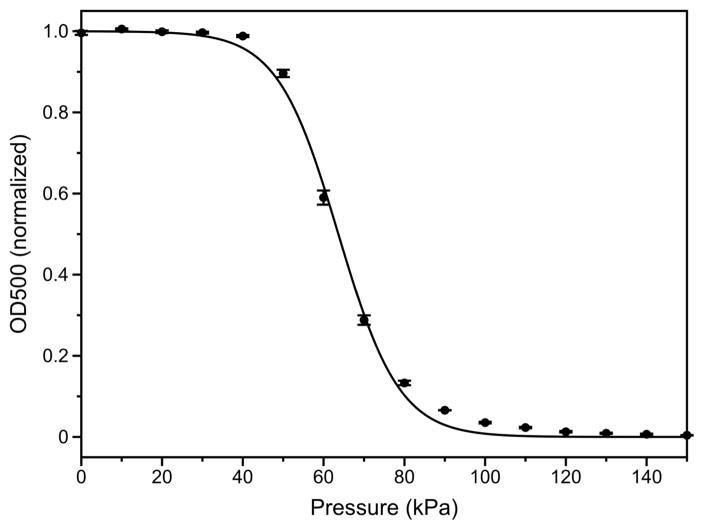
This model was implemented in Matlab and solved using the ODE45 solver. The radius of GVs at rest R0 was set to 175 nm, which corresponds to a volume equivalent to the average volume of Halo GVs. The thickness of the shell T was 1.8 nm (Walsby 1994). The buckling pressure Pb was set to 92.6 kPa, which is about the critical pressure, in quasi-static conditions, at which GVs were found to collapse when packed in bacteria (Walsby, 1994-Fig. 20). This buckling pressure leads to an elastic modulus KR of 22 MPa, with a Poisson’s ratio ν of 0.33. The shell-liquid interfacial tension σ was set to 0.2 mN/m (σmax/4) and the hydrostatic pressure Ph to 0. These latter values conveniently put the acoustic pressure necessary to reach the buckling state at around 69 kPa, close to the average critical pressure observed for isolated GVs in suspension (Figure 4). Assuming a perfect gas inside the shell, and adiabatic compression, the polytropic index n was set equal to the ratio of specific heat of a perfect gas, i.e. 1.4. The atmospheric pressure Patm was 100 kPa. With this choice of parameters, assuming no buckling, GVs linear resonance frequency would be 136 MHz, well above insonating frequencies.
Figure 4.
Halo GV optical density measurement as a function of hydrostatic pressure (N=3 independent preparations). The error bars are standard error. The data was fit to a Boltzmann sigmoid fit of the form f(p) = (1+e(p − pc)/Δp )−1 with Δp = 8 kPa and an average midpoint of collapse pc= 64 kPa (R2>0.998).
Water density, speed of sound and viscosity were set to 1000 kg/m3, 1500 m/s and 0.89 mPa.s, respectively. Properties used for PBS and sucrose solutions are summarized in Table 2. The incident acoustic pressure pulses were 6-cycle cosine-tapered pulses identical to those generated by the AWG in the experiments.
For the comparison with experiments with GVs in solutions, the response of a population of GVs was simulated in the theoretical beam of the RMV704 as follows. Individual GVs positioned in the focal plane, at distances R from the axis ranging from 0 to 1 mm by step of 5μm were exposed to 6-cycle 20 MHz pulses of amplitude given by (Cobbold 2007, Chap. 3, eq. 3.54):
| Eq. 10 |
where Jinc(x) = J1(x)/(x) with J1 the Bessel function of the first kind, R is the distance from the axis, A = 3 mm and F = 6 mm are the transducer aperture and focal distance, f0 = 20 MHz, and P0( f0,0) = 576 kPa. The power spectra Πrad (f,R) of the pressure scattered by these individual GVs were calculated. Noting that for a random distribution of scatterers in a cylindrically symmetrical beam, the number of GVs located at a distance R from the axis is proportional to R, the total contribution of the GV population at R is proportional to R×Πrad (f,R). The power spectra of the signal received by the transducer is then proportional to the sum of the weighted contributions at all R :
| Eq. 11 |
where the product Att × Jinc accounts for the attenuation along the return path and diffraction on receive, with . The attenuation coefficient α was assumed to be 2.221×10⁻⁴ dB/mm/MHz2 in water.
Bandwidth limited scattering cross-section
To quantify further the response of a single GV to the incident pressure pulse, a bandwidth limited differential scattering cross-section was calculated, similarly to Chin and Burns (2004), as a function of incident pressure:
| Eq. 12 |
where Pinc is the amplitude of the acoustic pulse, r is the distance at which the scattered pressure was calculated (Eq. 2), Πrad and Πinc are the power spectra of the scattered pressure and incident pressure waves, respectively, and [fmin, fmax] are the limits of the bandwidth considered. This calculation was performed for GV in water and exposed to the 20-MHz pulse described previously, at 50, 150 and 300 kPa. The bandwidth of interest was 0 to 70 MHz, which is relevant for the RMV704 probes used in the experiments, and therefore included only the first three harmonics. This scattering cross-section definition is relevant only for the purpose of comparing the level of signal expected from GVs and tissue scatterers, in B-mode imaging.
FEM Modeling
To investigate the mechanical response of GVs of a more realistic shape to the acoustic pressure field, we constructed a finite element (FE) model of a prototypical Halo GV and simulated its response to 20 MHz ultrasound using Abaqus/Explicit (Dassault Systèmes Simulia). This software package allows the analysis of deformations of structures under dynamic loading conditions, including deformations due to buckling, using an explicit finite difference solver. The model treated GVs as a deformable solid shell with the lemon-like shape seen in TEM (Shapiro et al., 2014, Figure 1-c). The shell had homogenous, isotropic, linear elastic properties, and uniform mass density. GV length and radius at its equator were set to 400 nm and 150 nm, respectively, and the shell thickness to 1.8 nm. The shell density, Young’s modulus, Poisson’s ratio and density were 1320 kg/m3, 2.8 GPa, and 0.33, respectively (Walsby, 1994). The inner gas, initially at a pressure of 100 kPa (equal to the atmospheric pressure), remained trapped inside the shell, and its compression/expansion assumed adiabatic (polytropic exponent =1.4). The model did not account for the viscosity of the surrounding liquid, shell viscosity, shell-liquid interfacial tension, and hydrostatic pressure.
The mesh consisted of a mix of 3073 quadrilateral and 102 triangular shell elements with side-lengths of 10 nm in average. In a mesh convergence study, it was shown that quadrupling the number of elements did not have any noticeable effect on the overall behavior of the shell. The shell behavior was modeled using a large-deformation, small-strain formulation. The external load applied to the GV was the summation of atmospheric and acoustic pressures. The acoustic signal consisted of a 6-cycle 20-MHz cosine-tapered pulse, with peak amplitudes varying from 50 kPa to 300 kPa. All external pressures were applied perpendicularly to the outer surface of the shell. The effective radius R of the gas vesicle was computed from the inner volume of the shell as a function of time, and the scattered pressure estimated, using Eq. 2, at a distance r equal to the focal distance of the RMV704 transducer (6.2 mm).
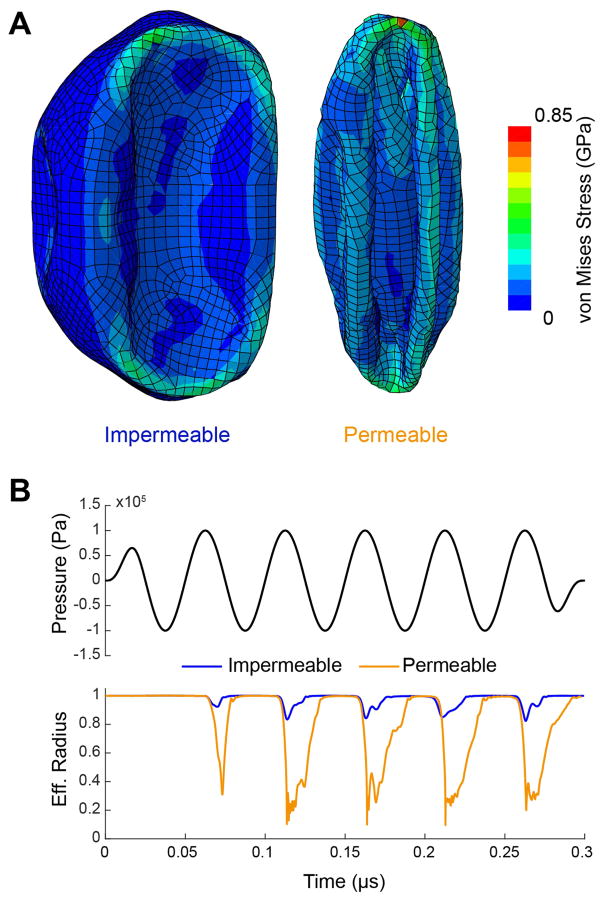
FE simulation was also performed to compare shell deformations and stresses in the case of a shell permeable to gas (with almost no resistance to flow) to those observed when the shell is perfectly impermeable. To simulate a permeable shell, the outer and initial inner gas pressures were set to 0.1 kPa, such that the difference between inner and outer gas pressures remains insignificant relative to stresses in the shell and acoustic pressure, even for large variations of the volume. For the impermeable shell, the initial inner gas pressure was set equal to the outer atmospheric pressure at 100 kPa. In both cases, the amplitude of the acoustic pressure was set to 100 kPa, just above the buckling pressure measured from the first set of simulations. Unlike RP modeling, the FE simulation of the shell deformations does not assume rotational symmetry or simplified shell geometry; it thus allows for detailed investigations of, in principle, arbitrary GV shapes and applied transient loads. However, as for RP simulation, an approximation is introduced when estimating the scattered pressure using Eq. 2, which assumes spherical symmetry.
Results and discussion
Collapse pressure
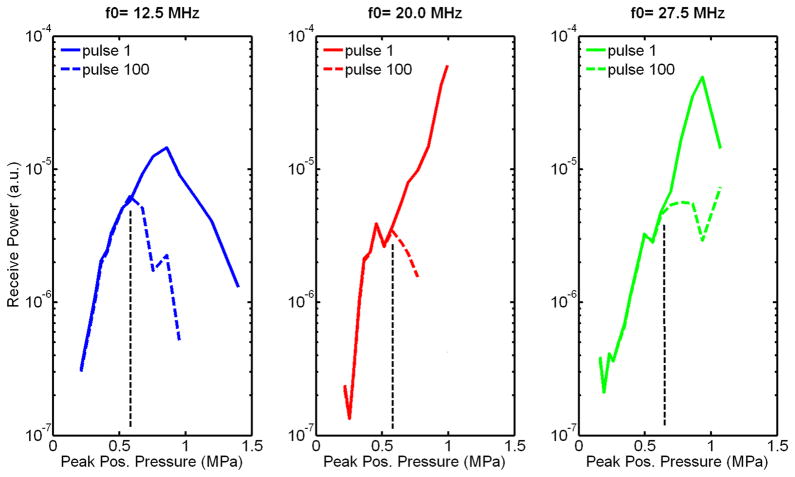
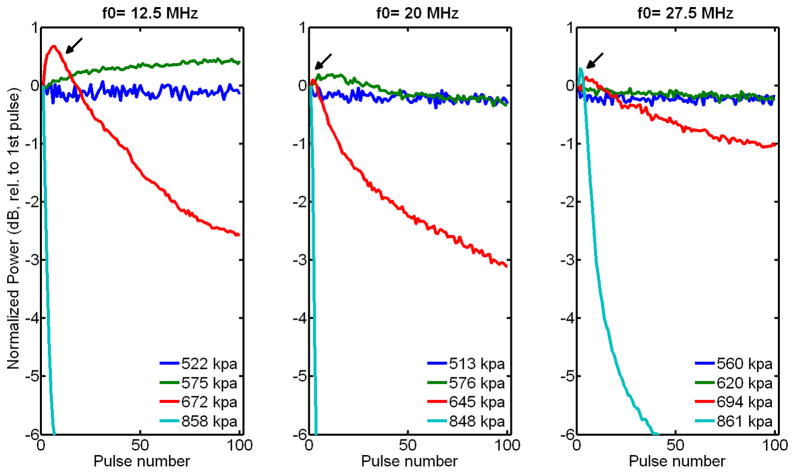
From visual inspection of the B-scan image of GVs embedded in a 1% agar matrix, obtained from the first set of experiments (Figure 5), GVs clearly collapse when exposed to 6-cycle 20 MHz pulses at peak positive pressures above 576 kPa. Furthermore, the depth over which they collapse increases with incident pressure. From the second set of experiments, the comparison of the backscattered powers (in the fundamental band) obtained after transmission of the first and last pulses of a 100-pulses train (Figure 6) seems to indicate that this threshold is higher than 550 kPa at all frequencies in the range investigated. From a closer examination of the backscattered power as a function of pulse number (normalized to the backscatter power from the first transmitted pulse, Figure 7), the collapse pressure can be estimated more precisely to be between 522 and 576 kPa at 12.5 MHz, between 513 and 575 kPa at 20 MHz, and between 620 and 694 kPa at 27.5 MHz. The collapse pressure observed upon exposure to ultrasound is therefore 9 times higher than the collapse pressure observed in quasi-static conditions (Figure 4).
Figure 5.
B-scan image of the strip of agar containing Halo GVs, after exposure to 6-cycles 20 MHz pulses at peak positive pressures ranging from 217 to 1161 kPa. Collapse of GVs is clearly visible starting at an incident pressure of 696 kPa.
Figure 6.
Received power from Halo GVs in the fundamental band as a function of frequency and peak positive pressure after transmission of the 1st and last pulses from a 100 6-cycles pulse train (PRF =1 kHz). A difference in power is clearly observed above 600 kPa, between the first and last transmitted pulse, at all frequencies, indicating collapse of part of the GV population.
Figure 7.
Normalized received power from Halo GVs in the fundamental band as a function of pulse number and frequency, at peak positive pressures around collapse pressure.
This difference could be explained by the difference in rate of application of the compressive forces: in the hydrostatic case, pressure increments are followed by a 7-s equilibration period, allowing for the gas to flow outward due to compression of the GV volume, and preventing the inner gas pressure from building up and contributing to the resistance to compression. In the acoustic case however, GV compression occurs on a half period time scale (40 ns at 12.5 MHz), shorter than the exponential filling (or emptying) time estimated at 1.5 μs. Other mechanisms may also contribute to the observed difference. In simulation work by Vliegenthart and Gompper (2011), compression rate has been indicated to affect spherical shell deformation shape. This could also be the case for other shell geometries, with potential effects on the threshold for shell failure. The surrounding medium could have also played a role. Yang and Church (2005) evaluated the influence of the viscoelastic properties of the surrounding medium on unshelled microbubbles oscillations. Both shear viscosity (μ =15 mPa.s) and modulus (G = 1 MPa) of the medium contribute to the damping of radial oscillations, in the small oscillation regime, with a dominant effect of viscosity by two orders of magnitudes for bubbles 200 nm in radius at 10 MHz (Fig 3-b of the reference).
A slight increase in scattered power is also temporarily observed at pressures above collapse pressure (Figure 7, arrow), the duration of which is decreasing with increasing incident pressure. This temporary increase could potentially be associated with either a decrease in attenuation (due to collapse of part of the GV population), an increase in GV volume oscillation amplitude (and consequently scattering cross section) upon failure of the shell, or both. Furthermore, past this temporary peak, the rate at which the power drops increases with incident pressure. This phenomenon could be associated with an increase in the probability of collapse with increasing pressure, which has been observed by Bevan et al. (2008) with a population of microbubbles. Consequently, at higher pressure, a higher proportion of GVs collapses due to the transmission of each pulse. An increase in material fatigue due to an increase in shell deformation with increasing pressure might have also played a role.
GV acoustic behaviour
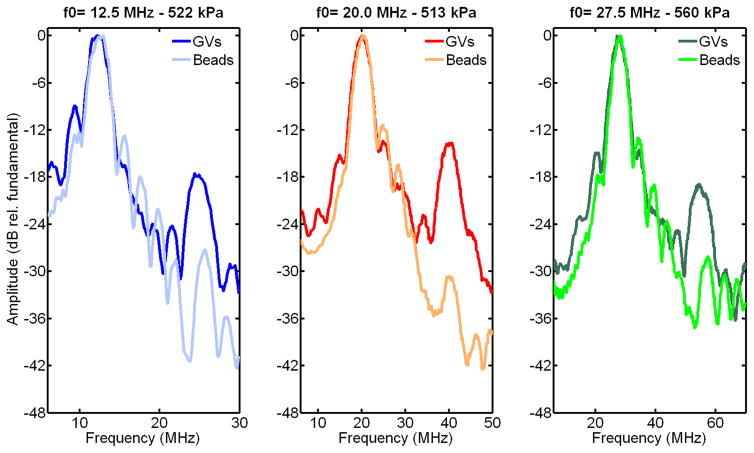
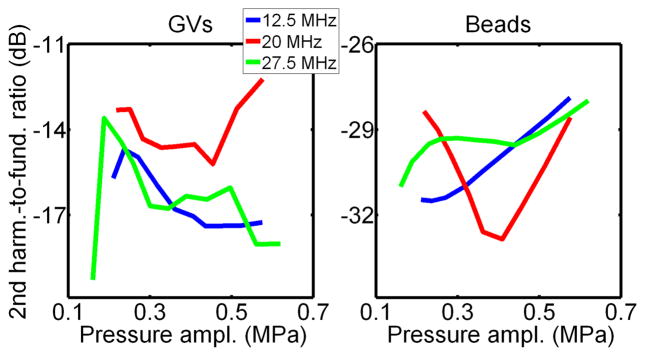
Experimental backscattered spectra obtained from the GVs and beads at an incident pressure just below collapse pressure at the three frequencies investigated are displayed in Figure 8. These spectra were normalized to the maximum in the fundamental band. The second harmonic observed with beads can be associated with linear scattering of a low second harmonic component transmitted by the transducer. The higher level of second harmonic observed with GVs (+10 to 15 dB, approximately, relative to beads) indicates that GVs oscillate nonlinearly when exposed to ultrasound at this positive pressure level, which is consistent with previous observations at 6 MHz (Shapiro et al, 2014, Figure 2-a). Furthermore, the second harmonic-to fundamental ratio was found to be relatively independent of frequency, but possibly decreasing with incident pressure in the 200 – 500 kPa range (Fig. 9). The small harmonic signal from beads is attributed to the linear scattering of a component transmitted by the transducer at the second harmonic frequency, which remains approximately constant at the focus of the transducer (24 to 30 dB below the fundamental, from hydrophone measurements) over the range of pressures eaxamined.
Figure 8.
Spectra of the signals scattered from Halo GVs and polystyrene beads, at incident pressure just below GV collapse pressure, in the frequency band of the transducers. The level of second harmonic relative to the fundamental is 10 to 15 dB higher for GVs than for beads (linear scatters), indicating GVs non linear oscillations.
Figure 9.
Second harmonic-to-fundamental ratio from experiments with Halo GVs and polystyrene beads, at pressure levels below GVs collapse pressure.
RP Simulation
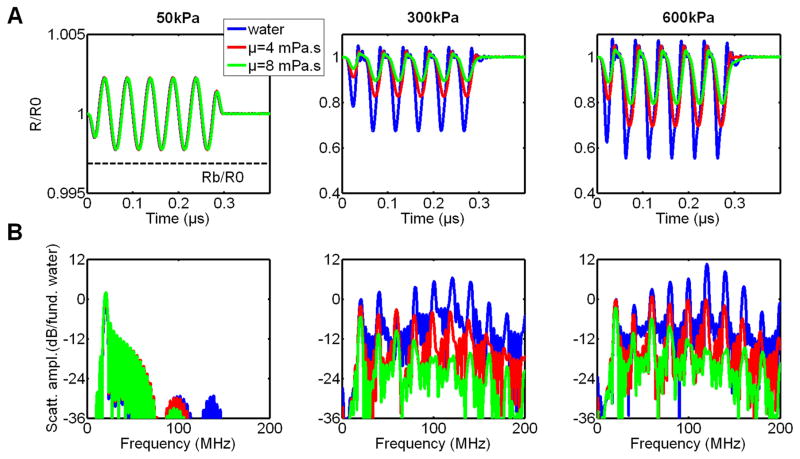
Simulated radial oscillations of GVs exposed to 6-cycle 20 MHz pulses at 50, 300 and 600-kPa peak positive pressure amplitudes and spectra of the corresponding radiated pressures are shown in Figure 10-A and 10-B, respectively, as function of surrounding medium viscosity. All spectra at a given incident pressure are normalized to the maximum in the fundamental band obtained in water.
Figure 10.
RP simulations of GV oscillations induced by a 6-cycles 20 MHz ultrasound pulse, at 50, 300 and 600 kPa peak positive pressure: radial excursion (A), scattered pressure spectrum (B), as a function of surrounding medium viscosity (4 mPa.s corresponds to viscosity in blood).
At 50 kPa acoustic pressure (i.e. below buckling pressure), the effective radius oscillates linearly around the radius at rest, R0, with a relative oscillation amplitude of less than 0.25 %. Due to these low amplitude oscillations, the wall velocity is also low, therefore the effects of medium viscosity are negligible. No harmonic components of the fundamental frequency are generated. Above buckling pressure, the oscillations are compression dominated, with maximal relative decreases in the effective radius (in water) of around 30% and 45%, at 300 and 600 kPa incident pressure, respectively. The oscillation asymmetry leads to a scattered pressure rich in harmonics. Furthermore, the wall velocity, on compression, becomes large enough for the effects of surrounding medium viscous damping to play a role in the radial oscillations, and consequently on the harmonic level.
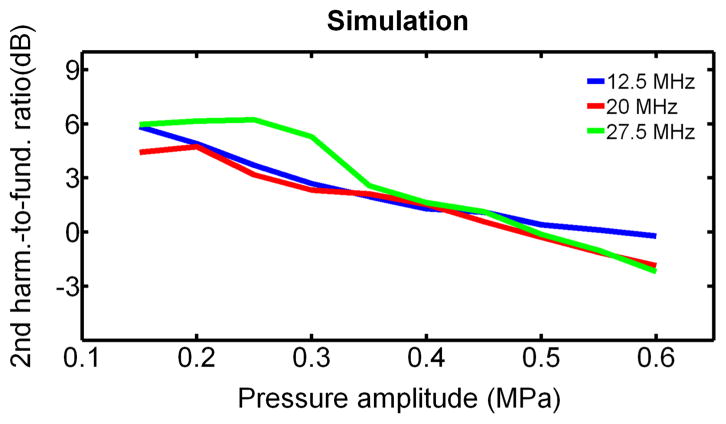
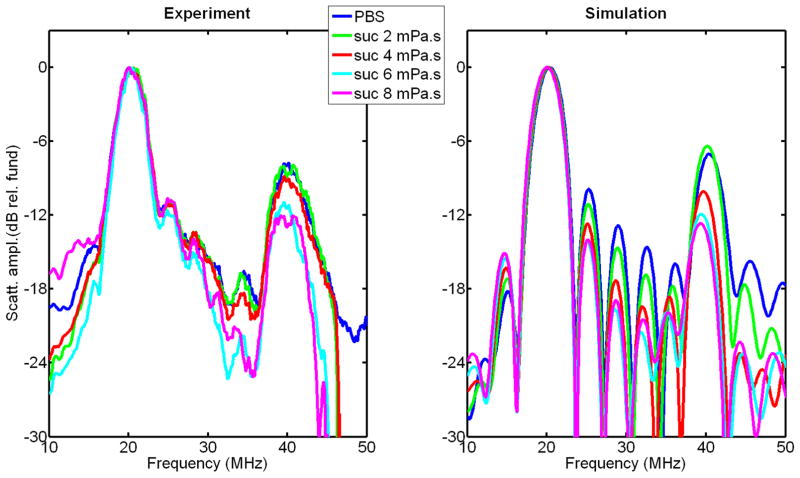
The second harmonic-to-fundamental ratio predicted by RP is relatively independent of frequency but varies with applied pressure above the buckling pressure, as shown in Figure 11. The lower pressure dependence in agarose-embedded GV measurements warrants further investigation. The difference in the overall level of this ratio between simulation and experiments (Figure 9) is due to the fact that experimental data were not corrected for attenuation and diffraction. Experimental spectra of the scattered pressure from a population of GVs in solutions of different viscosities were compared to the spectra of the simulated scattered pressures from a GV population in the same solutions in Figure 12. This comparison, which was performed at 20 MHz, with a 6-cycle cosine-tapered pulse at 576 kPa, shows a relative agreement between experimental data and simulation, both in terms of amplitude of the second harmonic relative to the fundamental, and in its variations with surrounding medium viscosity. After correction of diffraction and attenuation on the receive path, the level of second harmonic is estimated to range from 2 to 6 dB below the fundamental for surrounding medium viscosity ranging from 0.9 to 8 mPa.s.
Figure 11.
Second harmonic-to-fundamental ratio obtained from RP simulation of GV oscillations in water, as function of frequency and incident peak positive pressure.
Figure 12.
Spectra of backscattered signals from Halo GVs in PBS and sucrose solutions, with a 6-cycles 20-MHz ultrasound pulse, at 576 kPa: experimental results (left), RP simulation results (right). Spectra are normalized to the maximum in the fundamental frequency band.
FEM simulation
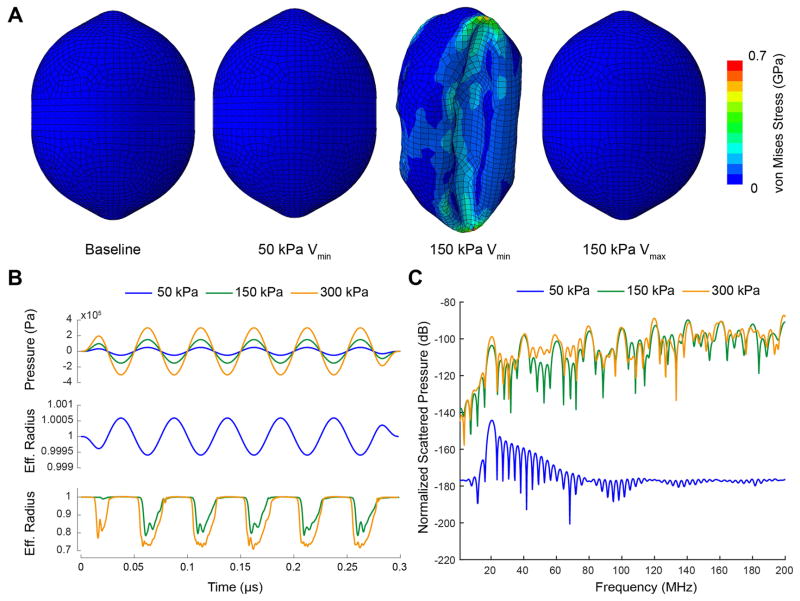
Snapshots of the simulated GV deformation during exposure to 50 kPa and 150 kPa ultrasound pulses are shown in Figure 13-A (supplementary movies 1 and 2). The GV surfaces are color-rendered using the local von Mises stress (VMS). VMS is a metric of the overall local stress related to material distortion, which is often used to predict the points of plastic deformation or rupture in the material. The most significant VMS are observed in the buckled state, with a maximum located at the points of maximal shell deformation. The maximum VMS observed at an acoustic pressure of 150 kPa is 630 MPa, within in the maximal range of tensile strengths observed in strong protein structures such as spider silk (Vollrath and Porter, 2006. Vepari and Kaplan, 2007).
Figure 13.
FEM simulations of the deformation of a Halo GV. (A) Deformation and von Mises stress of a Halo GV filled with nitrogen gas at atmospheric pressure (100 kPa) and room temperature (300 K) for different acoustic pressures. The peak acoustic pressure and the state of the GV (i.e. maximal expansion or minimal compression volume) are indicated below each image. (B) Applied acoustic pressure (top) and the effective radius, as a function of time and peak positive pressure (middle, and bottom). (C) Fourier transforms of the radiated sound pressure due to volume changes for the different acoustic loads.
A 50 kPa amplitude appears insufficient to cause buckling and the effective radius R oscillates linearly with incident pressure. The maximal change in R is less than 0.05% (Figure 13-B), i.e. five times lower than what was predicted by the RP simulation. This difference is explained by a difference in the gas vesicle bulk modulus, which, due to its coupling with the buckling pressure (through Eq. 6), was underestimated in the RP simulation. The impact on the overall behavior of GVs at acoustic pressures above buckling pressure is, however, very limited.
At 150 kPa, a robust and consistent buckling behavior is observed with a 22% reduction in R at the time of maximum loading. At peak negative pressure, expansion of the GV shell remains extremely small. A 300 kPa stimulus results in a larger compression, with a maximal reduction in effective radius of 28%. In both the 150 kPa and 300 kPa scenarios, buckling starts to occur when the acoustic pressure rises to approximately 96 kPa in the first cycle, and at lower pressure for the following cycles. This empirical pressure level is 50% higher than the average critical pressure observed in hydrostatic measurements shown in Figure 4, but of the order of the critical pressure of Halo GV when packed in the bacteria. This discrepancy could either be attributed to a misestimation of the shell Young’s modulus and/or Poisson’s ratio, or due to the fact that shell-liquid interfacial tension and hydrostatic pressure, which would act as a preload on the shell, have not been considered in this simulation. As in the RP modeling, when the acoustic pressure amplitude is above the buckling pressure a compression only behavior is predicted.
Frequency spectra of the estimated radiated sound pressure Prad (r = 6.2mm, t) by a single GV, normalized to the atmospheric pressure, are shown in Figure 13-C for all excitation amplitudes. At acoustic pressure amplitude under the buckling pressure, the amplitude at the fundamental frequency detected at the surface of the transducer is predicted to be 145 dB below the atmospheric pressure, whereas it is approximately 100 dB below the atmospheric pressure for acoustic pressures above buckling pressure. In agreement with the RP modeling, the compression-only behavior of the gas vesicles at acoustic pressure above buckling pressure leads to a rich content in harmonics.
The difference in collapse pressure observed experimentally between quasi-hydrostatic and acoustic conditions suggests that the gas inside GVs is unable to escape in sufficient proportion during ultrasound compression, and plays a significant role in resisting deformation and collapse. This is illustrated by the difference in the maximal volume compression observed in simulation between a shell permeable to gas and an impermeable shell, when exposed to an acoustic pressure just above the buckling pressure. For a permeable shell, larger deformations are observed (Figure 14-A, supplementary movie 3) with a maximal reduction of the effective radius of 90%, compared to 15% for the impermeable wall (Figure 14-B). This was accompanied by significantly larger maximal von Mises stress (730 MPa vs. 460 MPa), which, assuming that GV collapse results from shell failure, could explain the difference in collapse pressures observed between quasi-static and ultrasound conditions.
Figure 14.
FEM simulations of a Halo GV with different internal gas pressures. (A) Deformation and von Mises stress for an impermeable shell containing a gas at atmospheric pressure at rest (left) or almost no gas (0.001 atm) (right), both under an acoustic load of +100 kPa. This load is just above the initial buckling pressure of 96 kPa. (B) Applied acoustic pressure (top) for a 20 MHz stimulus with an amplitude of 100 kPa and the effective radius of the GVs during simulation for the two gas contents conditions (bottom).
Scattering cross-section
The bandwidth limited differential scattering cross-section calculated from RP and FEM models with the transmitted pulse at 20 MHz, at 50, 150 and 300 kPa amplitudes is summarized in Table 3, along with the differential cross section of two types of cell calculated at 20 MHz. These types of cells were selected due to their low mismatch in acoustic properties relative to their surrounding medium, which makes them weak ultrasound scatterers at the frequency considered. The comparison with cells shows that single GVs are predicted to be weak scatterers, due in part to their small sizes, the stiffness of their shell, and their compression only behaviour (upon buckling). In RP simulation, an increase of 27dB in scattering cross-section is observed between 50 kPa and 150 kPa incident pressures. This increase is 43dB in FEM. The increase difference is largely due to the larger effective radius excursions observed in RP at the lowest incident pressure (accounting for 13 out of the 16dB difference), which results from the choice of RP mechanical parameters, as previously discussed. This jump in scattering cross-section would make amplitude modulation a potentially good candidate as a nonlinear imaging scheme, when the lowest and highest pulse amplitudes are, respectively, below and above buckling pressure.
Table 3.
GV bandwidth limited differential scattering cross section as a function of incident pressure (left). Differential backscattering cross-section of two types of weakly scattering cell at 20 MHz.
|
|
|
||||
|---|---|---|---|---|---|
| Incident pressure amplitude (kPa) |
|
Cell type | σ 20MHz (m2.sr−1) | ||
| RP | FEM | ||||
|
|
|
||||
| 50 | 1.8×10⁻¹⁷ | 7.7×10⁻¹⁹ | Red blood cell | 4.8×10⁻¹⁵ | |
|
|
|
||||
| 150 | 1.0×10⁻¹⁴ | 1.5×10⁻¹⁴ | Acute myeloid leukemia cell | 2×10⁻¹⁴ | |
|
| |||||
| 300 | 4.5×10⁻¹⁵ | 3.3×10⁻¹⁵ | |||
|
|
|
||||
Conclusion
In the frequency range investigated, gas vesicles from Halobacterium salinarum collapse at acoustic pressure amplitudes 9 times higher than the critical pressure observed in quasi-hydrostatic conditions isolated GVs. FEM simulation supports the hypothesis that the coefficient of gas permeability of the shell in relation to the rate of pressure increase is a critical parameter in determining the collapse pressure. At acoustic pressure amplitudes above the hydrostatic critical pressure and below the acoustical collapse pressure, gas vesicles behave non-linearly and generate a strong second harmonic, which correlates well with predictions from a phenomenological spherical Rayleigh-Plesset type model that includes buckling. Acoustic buckling is also predicted in a FEM simulation for a realistic shell geometry and elastic modulus, at a pressure level of 96 kPa. Both FEM and RP simulations predict a rich harmonic content upon buckling, accompanied by a 43 dB increase (in FEM) in the fundamental scattered pressure between 50 kPa and 150 kPa. This should allow the use of established microbubble nonlinear contrast mode (pulse inversion, amplitude modulation) for GV detection. As expected, due to their size and compression-only behavior, the radiated pressure level predicted for individual gas vesicles is of the same order of magnitude as for red blood cells, and much lower than for individual microbubbles, which will make them difficult to detect as single particles. Experimental observation of the pressure threshold at which buckling occurs, which is an important factor in validating the hypothesis of the importance of buckling in our model, has not yet been possible with the experimental setup used in this study.
Supplementary Material
Supplementary movie 1: GV deformation with 50 kPa peak ultrasound (6 cycles).
Supplementary movie 2: GV deformation with 150 kPa peak ultrasound (6 cycles).
Supplementary movie 3: GV (permeable shell) deformation with 100 kPa peak ultrasound (6 cycles).
Acknowledgments
We thank Dave Goertz for insightful discussions regarding microbubble dynamic and modeling, Anupama Lakshmanan and Suchita Nety for advice on GV and phantom preparation, Jordan Dykes for building the hydrostatic collapse measurement system and Flavien Saenz Molina for assistance with FEM.
This research was supported by the Canadian Institute of Health Research (MOP: 136842), the National Institute of Health (1R01EB018975), the Burroughs Wellcome Career Award at the Scientific Interface and FUJIFILM VisualSonics.
Footnotes
Publisher's Disclaimer: This is a PDF file of an unedited manuscript that has been accepted for publication. As a service to our customers we are providing this early version of the manuscript. The manuscript will undergo copyediting, typesetting, and review of the resulting proof before it is published in its final citable form. Please note that during the production process errors may be discovered which could affect the content, and all legal disclaimers that apply to the journal pertain.
References
- Bevan P, Karshaffian R, Burns PN. The influence of fragmentation on the acoustic reponse of shrinking bubbles. Ultrasound Med Biol. 2008;34(7):1152–1162. doi: 10.1016/j.ultrasmedbio.2007.12.016. [DOI] [PubMed] [Google Scholar]
- Campbell RB. Tumor physiology and delivery of nanopharmaceuticals. Anticancer Agents in Medicinal Chemistry. 2006;6:503–512. doi: 10.2174/187152006778699077. [DOI] [PubMed] [Google Scholar]
- Cobbold RSC. Foundations of Biomedical Ultrasound. Oxford University Press; 2007. [Google Scholar]
- Chin CT, Burns PN. Investigation of the effects of microbubble shell disruption on population scattering and implications for modeling contrast agent. IEEE Trans Ultrason Ferroelectr Freq Control. 2004;51(3):286–292. [PubMed] [Google Scholar]
- Landau L, Lifshitz E. Course of theoretical physics, Vol. 7: Theory of elasticity. Butterworth-Heinemann; Oxford: 1997. [Google Scholar]
- Marmottant P, van der Meer S, Emmer M, Versluis M. A model for large amplitude oscillations of coated bubbles accounting for buckling and rupture. J Acoust Soc Am. 2005;118(6):3499–3505. [Google Scholar]
- Marmottant P, Bouakaz A, de Jong N, Quilliet C. Buckling resistance of solid shell bubbles under ultrasound. J Acoust Soc Am. 2011;129(3):1231–1239. doi: 10.1121/1.3543943. [DOI] [PubMed] [Google Scholar]
- Pfeifer F. Distribution, formation and regulation of gas vesicles. Nature Rev Microbiol. 2012;10:705–715. doi: 10.1038/nrmicro2834. [DOI] [PubMed] [Google Scholar]
- Quilliet C, Zoldesi C, Riera C, van der Blaaderen A, Imhof A. Anisotropic colloid through non-trivial buckling. Eur Phys J E. 2008;27:13–20. doi: 10.1140/epje/i2007-10365-2. [DOI] [PubMed] [Google Scholar]
- Rosenson RS, MacCormick A, Uretz EF. Distribution of blood viscosity values and biochemical correlates in healthy adults. Clin Chem. 1996;42(8):1189–1195. [PubMed] [Google Scholar]
- Shapiro MG, Goodwill PW, Neogy A, Yin M, Foster FS, Schaffer DV, Conolly SM. Biogenic gas nanostructures as ultrasonic molecular reporters. Nat Nanotechnol. 2014;9(4):311–316. doi: 10.1038/nnano.2014.32. [DOI] [PMC free article] [PubMed] [Google Scholar]
- Sprague MR, Cherin E, Foster FS. A new transducer receive transfer function calibration method: application to microbubbles backscattering cross-section measurements at high frequency. IEEE Trans Ultrason Ferroelectr Freq Control. 2011;58(6):1159–1168. doi: 10.1109/TUFFC.2011.1926. [DOI] [PubMed] [Google Scholar]
- Vepari C, Kaplan DL. Silk as a biomaterial. Prog Polym Sci. 2007;32(8–9):991–1007. doi: 10.1016/j.progpolymsci.2007.05.013. [DOI] [PMC free article] [PubMed] [Google Scholar]
- Vliegenthart GA, Gompper G. Compression, crumpling and collapse of spherical shells and capsules. New J Phys. 2011;13:045020. [Google Scholar]
- Vollrath F, Porter D. Spider silk as archetypal protein elastomer. Soft Matter. 2006;2:377–385. doi: 10.1039/b600098n. [DOI] [PubMed] [Google Scholar]
- Walsby AE. Gas vesicles. Microbiol Rev. 1994:94–144. doi: 10.1128/mr.58.1.94-144.1994. [DOI] [PMC free article] [PubMed] [Google Scholar]
- Walsby AE, Revsbech NP, Griffel DH. The gas permeability coefficient of the cyanobacterial gas vesicle wall. J Gen Microbiol. 1992;138:837–845. [Google Scholar]
- Yang X, Church C. A model for the dynamics of gas bubbles in soft tissue. J Acoust Soc Am. 2005;118(6):3595–3606. doi: 10.1121/1.2118307. [DOI] [PubMed] [Google Scholar]
Associated Data
This section collects any data citations, data availability statements, or supplementary materials included in this article.
Supplementary Materials
Supplementary movie 1: GV deformation with 50 kPa peak ultrasound (6 cycles).
Supplementary movie 2: GV deformation with 150 kPa peak ultrasound (6 cycles).
Supplementary movie 3: GV (permeable shell) deformation with 100 kPa peak ultrasound (6 cycles).


