

Abstract
In the event of a radiological or nuclear attack, advanced clinical countermeasures are needed for screening and medical management of the exposed population. In such a scenario, minimally invasive biomarkers that can accurately quantify radiation exposure would be useful for triage management by first responders. In this murine study, we evaluated the efficacy of a novel combination of radiation responsive proteins, Flt3 ligand (FL), serum amyloid A (SAA), matrix metalloproteinase 9 (MMP9), fibrinogen beta (FGB) and pentraxin 3 (PTX3) to predict the received dose after whole- or partial-body irradiation. Ten-week-old female C57BL6 mice received a single whole-body or partial-body dose of 18 Gy from a Pantak X-ray source at a dose rate of 2.28 Gy/min. Plasma was collected by cardiac puncture at 24, 48, 72 h and 1 week postirradiation. Plasma protein levels were determined via commercially available ELISA assay. A multivariate discriminant analysis was utilized to generate best-fit dose prediction models for whole-body exposures using the selected biomarker panel and its potential application to partial-body exposures was examined. The combination of values from FL, SAA, MMP9, FGB and PTX3 between 24 h and 1 week postirradiation yielded novel dose-response relationships. For day 1 postirradiation, the best-fit model yielded a predictive accuracy of 81% utilizing FL alone. The use of additional proteins did not enhance the model accuracy whereas, at day 2 postirradiation, the addition of PTX3 and FGB to FL increased the accuracy to 100%. At day 3 the use of FL and PTX3 yielded a predictive accuracy of 93% and at day 7 use of FL and SAA had an accuracy of 90%. Dose prediction of partial-body exposures based on the TBI model had a higher predictive accuracy when the percentage of the body exposed to radiation increased. Our findings indicate that this novel combination of radiation responsive biomarker proteins are an efficient method for predicting radiation exposure and are more accurate when used in concert compared to using any single biomarker protein alone.
INTRODUCTION
The potential for future radiological events either from a “dirty bomb” attack or from an industrial accident involving nuclear power or misplaced radioactive sources represents an unmet need for biological diagnostics to determine radiation exposure. In the case of a radiological event, mass screenings of large sections of the relevant population will be required to triage exposed individuals from the nonexposed and to determine the severity of the received dose in those with a confirmed radiation exposure. The identification of biomarker protein expression profiles that can be used to quantify radiation exposure is critical for management of such an event (1).
In this study, a combination of previously identified radiation responsive proteins including fms-like tyrosine kinase (Flt3) ligand (FL), serum amyloid A (SAA), matrix metalloproteinase 9 (MMP9) and Fibrinogen beta (FGB) were evaluated using a multivariate approach to develop dose prediction models after irradiation. Pentraxin 3 (PTX3), a biomarker associated with vascular injury to the brain but previously unassociated with radiation exposure was also included in this study (2). FL is a cytokine known to induce proliferation and differentiation of bone marrow stem cells of myeloid and lymphoid origin and has recently been described as a biomarker of radiation exposure (3). The apolipoprotein SAA is a major acute phase reactant protein playing a central role in the inflammatory response and has been characterized as a marker of radiation exposure in heterogeneous radiation exposure profiles (4–6). MMP9 is active in extra-cellular matrix (ECM) degradation and FGB, the principle protein involved in clot formation, were also included in the study having been previously shown to be radiation responsive (4). PTX3, an acute phase reactant protein belonging to the same family as SAA and C-reactive protein has been newly identified in this study as radiation responsive and is included in our combination of biomarkers of radiation exposure (7).
Flt3 Ligand, SAA, MMP9 and FGB were selected based on our previous studies which identified these proteins as being radiation responsive (3, 4). FL and SAA have also been previously characterized in other biodosimetry studies modeling total-body irradiation (TBI) and partial-body irradiation (PBI) (5, 8–10). In the current study, this combination of proteins was evaluated for its efficacy in predicting received dose in plasma from total-body and partial-body irradiated mice. We believe evaluation of the combined expression pattern of these five radiation responsive proteins may provide useful diagnostic information for determining unknown radiation dose in future radiological events.
MATERIALS AND METHODS
Animal Model
For the dose predictive model, ten-week-old female C57BL6 mice received a single TBI dose of 1–8 Gy or sham irradiation. All mice receiving TBI were confined using a standard pie jig preventing movement. PBIs were conducted while anesthetized with either 120 mg/kg ketamine or 16 mg/kg xylazine (ip) and fully restrained mice using lead shielding to expose only the desired body fractions. All animal studies were conducted in accordance with the principles and procedures outlined in the NIH Guide for the Care and Use of Animals and procedures were approved by the NIH Lab Animal Safety Program under an approved protocol. Blood was collected by cardiac puncture at 24, 48 and 72 h postirradiation, as well as one week postirradiation in lithium heparin blood collection tubes (BD Biosciences). Mice received 2.5–5.5% Isoflurane anesthesia during cardiac puncture for blood collection. Blood was spun at 10,000 RCF for 10 min at room temperature and all plasma samples were stored at −80°C.
Dosimetry
Murine in vivo models utilized a Pantak X-ray source at a dose rate of 2.28 Gy/min. Dose rate was calibrated based upon the procedures described in American Association of Physicist in Medicine (AAPM) Task Group Report 61 (TG-61) with regard to the following conditions: X-ray tube potential was 300 kV, half-value layer is 0.8 mm copper, source-to-surface distance was 50 cm. Dose rate was measured at 2 cm depth in solid water phantom using a PTW model: N23342 ion chamber and Inovision, model 35040 electrometer.
Mouse ELISA
Potential biomarker proteins were screened in mouse plasma using commercially available ELISAs; SAA (Invitrogen), MMP9, PTX3 and FL (RnD Systems) and FGB (Genway). All plasma samples were run according to manufacturer’s instructions.
Statistical Analysis
In vivo experiments were analyzed independently of each other and unless otherwise indicated the data presented are specific to each individual animal. The data included radiation dose and time of exposure on total- and partial-body irradiation. Statistical data analysis was performed using R statistical software (11). We assessed the biomarker levels as a function of time and dose using multivariate analysis. Model selection was performed using “glmulti” function in the glmulti package.
Multiple-linear-regression analysis was used to develop dose-response relationships for multiple proteins for radiation dose assessment at each time point. Because, there were 5 proteins, we generated 2^5 = 32 candidate models. To determine the best model against the all combinations of competing models, we used the Akaike Information Criterion (AIC), an information theoretic based method. AIC measures the relative quality of a statistical model which was computed for all possible models for each time point. Model weight was computed from the AIC score with larger the model weight, the possibilities to be the best “true” model. In general, AIC >2 is considered as a golden rule in model selection (12). In brief, if the difference of AIC between the first and second best model is more than 2, the first model is taken as best model. If the difference is <2, we considered model averaging of top models with a difference of AIC <2. Prediction accuracy was estimated based on the selected best or averaged model using a linear discriminant analysis. We have stratified the model accuracy by each measured dose for a given time point, in addition to overall accuracy for all doses (Supplemental Table S1; http://dx.doi.org/10.1667/RR14558.1.S1). A separate regression model was made for each dose to estimate the predictive accuracy, in comparison to weighted average model used for overall accuracy.
Pooled Expression Values
In the current study, we wished to characterize dose and time response expression patterns for multiple biomarkers of radiation exposure including MMP9, FGB and PTX3. To expand our panel, we included FL and SAA biomarkers whom we had previously demonstrated to be radiation responsive (3, 4). In the current study, we incorporated raw data from these previous studies to improve the strength of our modeling prediction.
Tables 1 and 2 show the number of animals used for each data point and clarifies which data are new and which data has been taken from previously published studies for both TBI and TBI cohorts as represented by the bolded text. Animal numbers for each treatment group vary across markers as this multivariate analysis represents an effort to pool marker data from previous experiments. The previously published SAA and FL studies were large studies using many animals and all usable data points were included resulting in some disparity in animal numbers across target cohorts. Table 1 shows all TBI data points for MMP9, FGB and PTX3 represent new data excepting the 1, 4 and 8 Gy data points at the 24 h time point for MMP9. SAA and FL raw data were used from previous studies. Table 2 shows all partial-body exposure data for MMP9, FGB and PTX3 represent new data. SAA and FL partial-body exposure data was taken from previous studies (3, 4).
TABLE 1.
The Number of Animals Used for Each TBI Dose and Time Point for Each Study Including MMP9, FGB, PTX3, SAA and FL
| Timepoint | Dose (Gy) | 1 | 2 | 4 | 8 | Control |
|---|---|---|---|---|---|---|
| Target | MMP9 | 21 | ||||
| 24 h | 10 | 8 | 10 | 10 | ||
| 48 h | 10 | 8 | 10 | 10 | ||
| 72 h | 10 | 8 | 10 | 10 | ||
| 1 week | * | * | 10 | 10 | ||
| Target | FGB | 3 | ||||
| 24 h | 3 | 3 | 3 | 4 | ||
| 48 h | 3 | 5 | 3 | 3 | ||
| 72 h | 3 | 3 | 3 | 3 | ||
| 1 week | * | * | 3 | 3 | ||
| Target | PTX3 | 12 | ||||
| 24 h | 3 | 3 | 3 | 3 | ||
| 48 h | 7 | 3 | 3 | 3 | ||
| 72 h | 3 | 3 | 3 | 3 | ||
| 1 week | * | * | 3 | 3 | ||
| Target | SAA | 113 | ||||
| 24 h | 26 | 8 | 26 | 21 | ||
| 48 h | 30 | 10 | 25 | 21 | ||
| 72 h | 23 | 8 | 33 | 38 | ||
| 1 week | * | * | 10 | 10 | ||
| Target | FL | 110 | ||||
| 24 h | 38 | 19 | 28 | 21 | ||
| 48 h | 8 | 8 | 8 | 8 | ||
| 72 h | 23 | 8 | 33 | 33 | ||
| 1 week | * | * | 10 | 10 |
TABLE 2.
The Number of Animals Used for Each PBI Type, Dose and Time Point for Each Study Including MMP9, FGB, PTX3, SAA and FL
| Postirradiation | ||||||||
|---|---|---|---|---|---|---|---|---|
| 24 h | 72 h | |||||||
| Dose (Gy) | 2 | 4 | 8 | 2 | 4 | 8 | Control | |
| Target | MMP9 | 3 | ||||||
| 25% | 3 | 3 | 3 | * | * | * | ||
| 50% | 3 | 3 | 3 | * | * | * | ||
| Head | 3 | * | 8 | 3 | * | 3 | ||
| Limbs | 3 | * | 3 | 3 | * | 3 | ||
| Trunk | 3 | * | 3 | 3 | * | 3 | ||
| Trunk and limbs | 3 | * | 3 | 3 | * | 3 | ||
| Target | FGB | 3 | ||||||
| 25% | 3 | 3 | 3 | * | * | * | ||
| 50% | 3 | 3 | 3 | * | * | * | ||
| Head | 3 | * | 9 | 3 | * | 3 | ||
| Limbs | 3 | * | 3 | 3 | * | 3 | ||
| Trunk | 3 | * | 3 | 3 | * | 3 | ||
| Trunk and limbs | 3 | * | 3 | 3 | * | 3 | ||
| Target | PTX3 | 12 | ||||||
| 25% | 3 | 3 | 3 | * | * | * | ||
| 50% | 3 | 3 | 3 | * | * | * | ||
| Head | 3 | * | 9 | 3 | * | 3 | ||
| Limbs | 3 | * | 3 | 3 | * | 3 | ||
| Trunk | 3 | * | 3 | 3 | * | 3 | ||
| Trunk and limbs | 3 | * | 3 | 3 | * | 3 | ||
| Target | SAA | 10 | ||||||
| 25% | 6 | 6 | 6 | * | * | * | ||
| 50% | 6 | 6 | 6 | * | * | * | ||
| Head | 8 | * | 11 | * | * | * | ||
| Limbs | 8 | * | 8 | * | * | * | ||
| Trunk | 8 | * | 3 | * | * | * | ||
| Trunk and limbs | 8 | * | 3 | * | * | * | ||
| Target | FL | 10 | ||||||
| 25% | 6 | 6 | 6 | * | * | * | ||
| 50% | 6 | 6 | 6 | * | * | * | ||
| Head | 3 | * | 9 | 3 | * | 3 | ||
| Limbs | 3 | * | 3 | 3 | * | 3 | ||
| Trunk | 3 | * | 3 | 3 | * | 3 | ||
| Trunk and limbs | 3 | * | 3 | 3 | * | 3 | ||
RESULTS
TBI Expression Profiles of Biomarker Panel Proteins
Elevation of MMP9 was observed in the plasma of TBI mice at 24 h postirradiation at 1, 2, 4 and 8 Gy doses. This elevation was significant over control at every dose examined (P < 0.01). At 48 h postirradiation MMP9 was significantly elevated over control at doses of 4 and 8 Gy (P <0.01). At 72 h there was no significant elevation over control at any dose and at one week MMP9 values were significantly lower than control values at 4 and 8 Gy (P <0.01) (Fig. 1A).
FIG. 1.
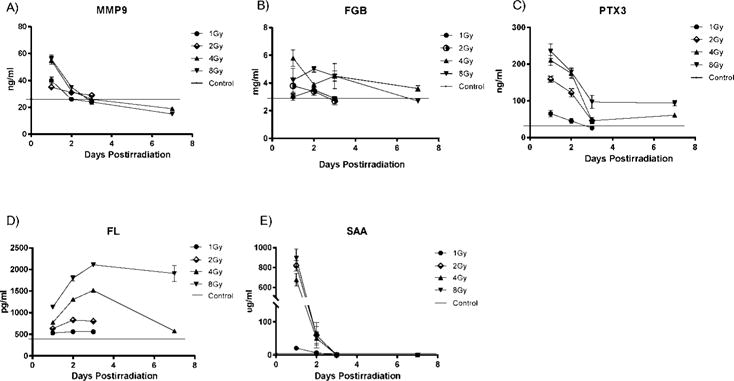
Markers of TBI response. Plasma expression in C57BL6 mice over a time course of 1, 2, 3 and 7 days after TBI for MMP9 (panel A), FGB (panel B), PTX3 (panel C), FL (panel D) and SAA (panel E). Values reflect the mean ± SEM. Note: FL (panel D) and SAA (panel E) data were shown in previous studies (3, 4).
Fibrinogen beta expression was elevated at 24 h postirradiation in TBI mice, but only the 4 Gy dose was significant (P <0.05). At 48 h postirradiation, significant elevation of FGB over control was seen at 1, 4 and 8 Gy doses (P <0.01) and at 72 h at 4 Gy dose (P <0.05). At one week postirradiation there was significant elevation of FGB at 4 Gy and a significant decrease at 8 Gy (P <0.05). (Fig. 1B)
Elevation of PTX3 was observed in the plasma of TBI mice at 24 h post-irradiation at 1, 2, 4 and 8 Gy doses. This elevation was significant over control at every dose examined (P <0.01). Significant elevation of PTX3 at 48 h postirradiation was seen at 2, 4 and 8 Gy doses and at one week postirradiation at 4 and 8 Gy doses (P <0.01). At 72 h postirradiation, there was a significant decrease in PTX3 relative to control at 1 Gy dose (P <0.05) and significant elevation of PTX3 at 2, 4 and 8 Gy doses (P <0.01) (Fig. 1C).
Increased expression of FL over control was seen in the plasma of TBI mice at doses between 1–8 Gy at 24, 48 and 72 h postirradiation. Elevation of FL was also seen at one week postirradiation at 4 and 8 Gy doses. Significant elevation of FL was seen at all doses and time points examined (P <0.001) (Fig. 1D).
Significant elevation of SAA was seen in TBI mice at doses between 2–8 Gy at 24 h postirradiation (P <0.001). Elevation of SAA for the 1 Gy dose at 24 h postirradiation was not significant. There was no significant elevation of SAA observed at 48 and 72 h and one week postirradiation for any dose (Fig. 1E).
MMP9, FGB and PTX3 Response to Partial-Body Exposures
MMP9, FGB and PTX3 response to radiation was also characterized using partial-body exposure patterns of 25 and 50% total-body mass or exposure of only the head, limbs, trunk or trunk and limbs together (Fig. 2A). At 24 h postirradiation significant increases in MMP9 expression over control was seen for 25% partial-body exposures at 2 and 8 Gy doses and for 50% partial-body exposures at 4 and 8 Gy doses (P <0.05) (Fig. 2B1) A significant elevation of MMP9 was also seen for trunk alone and trunk and limbs together at 24 h postirradiation at 8 Gy doses (P <0.05) (Fig. 2B2) There was no significant elevation of MMP9 over control for any exposure pattern at 72 h postirradiation, although there was significant decreases in expression for head only at 8 Gy and trunk only 2 Gy (P <0.05) (Fig. 2B3).
FIG. 2.
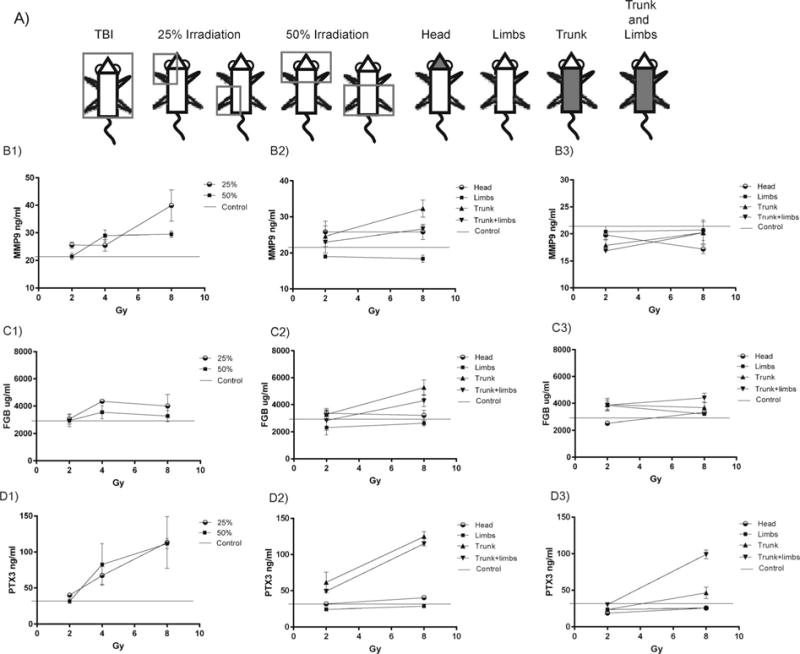
Partial-body irradiation response patterns for MMP9, FGB and PTX3. Panel A: C57BL6 mice were partially shielded to radiation using the represented partial-body diagrams with 25 and 50% gross exposures to either upper or lower quadrants or to only the head, limbs, trunk or trunk and limbs exposed. Plasma expression following 25 and 50% body-mass exposures at 24 h postirradiation for MMP9 (panel B1), FGB (panel C1) and PTX3 (panel D1). Plasma expression after heterogeneous partial-body irradiation patterns at 24 h postirradiation for MMP9 (panel B2), FGB (panel C2) and PTX3 (panel D2) and at 72 h postirradiation for MMP9 (panel B3), FGB (panel C3) and PTX3 (panel D3). Values reflect the mean ± SEM
Elevation of FGB plasma expression was seen over control at all partial-body irradiation patterns of 25 and 50% but was only significant for the 25% exposure at 4 Gy dose (P <0.01) (Fig. 2C1). At 24 h postirradiation for other partial-body irradiation patterns, only trunk alone and trunk and limbs together were significantly elevated over control at 8 Gy doses (P <0.05) (Fig. 2C2). At 72 h postirradiation, partial exposures for limbs alone at 2 Gy and trunk and limbs together at 8 Gy were significantly elevated over control (P <0.05). A significant decrease in FGB expression relative to control was also seen for head exposures at 2 Gy doses (P <0.01) (Fig. 2C3).
Pentraxin 3 was significantly elevated over control for partial-body irradiation patterns of 25% at 2 and 4 Gy and 50% irradiation at 2 and 8 Gy (P <0.05) (Fig. 2D1) For other partial-body irradiation patterns at 24 h postirradiation significant elevation of PTX3 over control was seen for head and trunk exposures at 8 Gy and for trunk and limbs together at both 2 and 8 Gy (P <0.01). A significant decrease relative to control was seen in PTX3 expression at 2 Gy doses to the limbs for this time point (P <0.01) (Fig. 2D2) At 72 h postirradiation significant elevation of PTX3 over control was seen at 8 Gy for exposure of trunk and limbs together (P <0.01) and a significant decrease was seen for head and limbs exposures at 2 and 8 Gy and for trunk exposures of 2 Gy (P <0.05) (Fig. 2D3)
Multivariate Modeling of TBIs
Pooled expression values were used to generate best-fit multivariate models for each time point after exposure using the Akaike Information Criterion (AIC) method (12). For each time point, model accuracy using both the single-best model and combination of the top three models was determined. The best-fit models are graphically represented according to their AICc score with a cut-off threshold set for models which fell within two standard deviations of the top model. Predictive accuracy scores were generated by testing the top models using a linear discriminant analysis. As shown in Fig. 3A, day 1 postirradiation, the biomarker profile with the strongest predictive accuracy was use of FL alone (AICc 56.4) and no other models fell within range of the top model (AICc values within two standard deviations of the top model). For this method a lower AICc score corresponds with increasing accuracy of the test model and in addition to the top three ranked models, the AICc scores and rank are included for each of the other individual markers used alone (Fig. 3A). Addition of other biomarkers did not increase the predictive accuracy score of the top model of 81%, as shown in Fig. 3D, the predictive accuracy score from the addition of models ranked 2 and 3 to the top model was lower than the use of model 1 alone. In addition, the predictive accuracy scores for the individual markers alone was lower than the top model and correlates with their higher AICc scores and lower ranking (Fig. 3A and D). Plasma FL expression had a linear dose-response relationship at this time point (Fig. 3B and C).
FIG. 3.
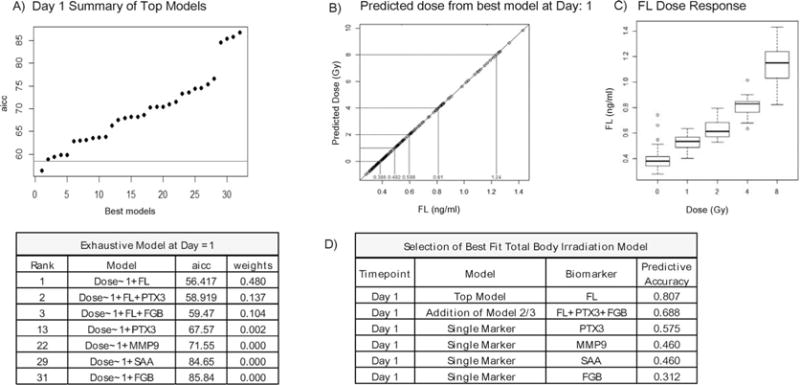
TBI multivariate model at day 1 postirradiation. Panel A: Summary of the best-fit biomarker models for TBI at day 1 postirradiation ranked according to AICc score and graphically represented with a threshold cutoff set for models falling outside of 2 standard deviations of the top model. Also included are the ranking and AICc score for each individual marker alone. Panel B: The linear relationship between predicted dose and FL. Panel C: Illustrates FL distribution relative to actual dose within the data set. Values reflect the mean ± SEM. Panel D: Shows the predictive accuracy score of the top model and the predictive accuracy of the top three models combined. Also included are the predictive accuracy scores for each individual marker alone.
Figure 4A–D shows that for day 2, the best single predictive model used FL with a predictive accuracy of 94%. However, for the day 2 time point, the addition of FGB and PTX3 from models 2 and 3, respectively, increased the predictive accuracy to 100% (Fig. 4D). On day 3 the best-fit model utilized the combination of PTX3 and FL (AICc 35.4) with a predictive accuracy of 93% (Fig. 4B/D). For this time point the addition of MMP9 did not increase predictive accuracy (Fig. 4D). The best predictive model for day 7 used a combination of FL and SAA (AICc 37.3) with a predictive accuracy of 89% with no additional benefit from including PTX3. It should be noted that the expression pattern of SAA at this time point is near zero, but here the addition of a negative marker increased the predicative accuracy of the model (Fig. 4C/D). It is also relevant to note that second and third ranking models which fell outside of the two standard deviation cut-off did not increase the predictive accuracy score when added to the top model. The overall predictive accuracy scores for the top models at each time point are shown in Fig. 4D. The specific predictive accuracy scores of the top model for each time point relative to each dose is provided in Supplemental Table S1 (http://dx.doi.org/10.1667/RR14558.1.S1).
FIG. 4.
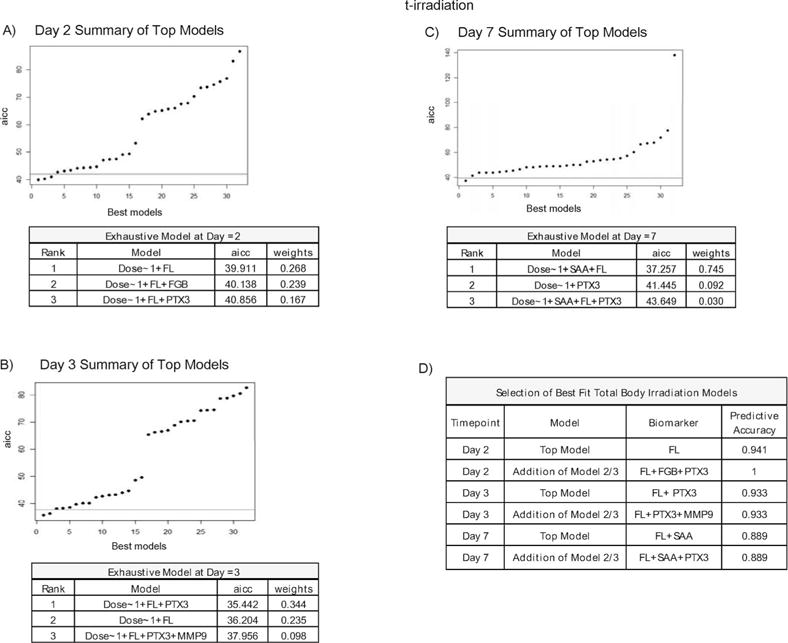
TBI multivariate models at day 2, 3 and 7 postirradiation. Summary of the best-fit biomarker models for TBI at day 2 (panel A) at day 3 (panel B) at day 7 (panel C) postirradiation ranked according to AICc score and graphically represented with a threshold cutoff set for models falling outside of 2 standard deviation of the top model. Panel D: Shows the predictive accuracy scores for both the top model and top three models combined for each time point post- exposure.
For this combination of proteins including FL, SAA, MMP9, FGB and PTX3, determination of the most useful biomarker for dose prediction over a range of different dose and time points was not obvious through evaluation of each individual trend of expression alone (Fig. 1) but could be determined using a mathematical modeling approach. This data illustrates the value of a multivariate analysis to determine best-fit single marker and multiple biomarker combinations with the greatest efficacies for dose prediction relative to time point of exposure.
Application of TBI Models to PBI
To assess the afore mentioned TBI models of dose prediction for application with heterogeneous partial-body exposures, biomarker profiles of FL, SAA, MMP9, FGB and PTX3 in animals receiving a partial-body exposure were tested using the best-fit TBI model at day 1 and 3 postirradiation. Partial-body exposures included irradiation of 25 or 50% upper and lower body, as well as exposure to only the head, limbs, trunk or trunk and limbs together at a dose rate of 2.28 Gy/min (Fig. 2A). Using the TBI day 1 model (dose <1 + FL) we accurately measured partial-body exposures to the trunk with a predictive accuracy of 67%. All other partial-body exposures had unacceptable predictive accuracy rates (≤56%) (Fig. 5). Using the TBI day 3 model (dose ~1 + FL + PTX3) we accurately predicted exposure to the trunk alone (67%) and trunk and limbs together (100%), but not to the head or limbs alone (33%) (Fig. 5). For partial-body exposures at both time points after irradiation, we observed higher predictive accuracy as the percentage of body area exposed increased.
FIG. 5.
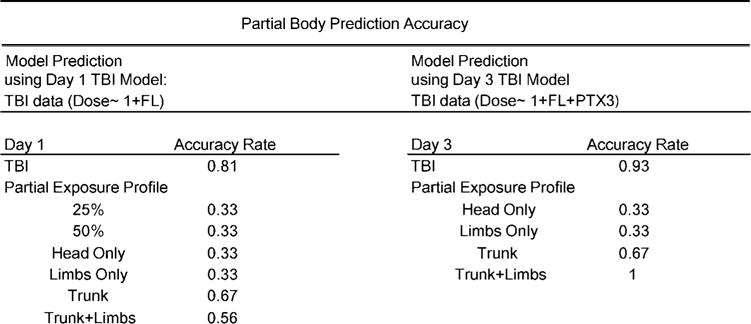
Partial exposure prediction. Partial-body prediction accuracies for day 1 PBI using the day 1 TBI best-fit model and for day 3 PBI using the day 3 TBI best-fit model.
DISCUSSION
Characterization of the biological response of the body to ionizing radiation is understood at its most fundamental level to be the result of damage to DNA either directly from high-energy photons or indirectly through generation of reactive oxygen species. What is not fully characterized is the molecular response and interaction of complex body systems to radiation. Dose estimates correlating level of received dose to onset of each phase of acute radiation syndrome have been well established but biological methods to estimate unknown quantity of received dose have not (13). In the current study, we examine the ability of a panel of previously identified radiation responsive proteins FL, SAA, MMP9 and FGB coupled with the novel radiation responsive protein PTX3, to predict unknown radiation exposure using both TBI and PBI models. As it is unlikely that a single protein biomarker of radiation exposure will be sufficient for accurate prediction at all doses and time points postirradiation, nonetheless we used a multivariate analysis to generate best fit models at day 1, 2, 3 and 7 postirradiation. It is also expected that as each protein exhibits a unique expression profile for both TBI and PBI models and is involved in disparate biological processes, a combinatorial approach will yield a stronger dose prediction model.
Using this methodology, we identified the use of a single biomarker FL as the most accurate predictor of received dose at day 1 postirradiation. This is not surprising as FL also demonstrated a linear relationship between plasma expression and amount of exposure at this time point which corroborates similar studies demonstrating the dose-response relationship of FL at day 1 postirradiation (14, 15). The strength of FL as a predictive marker of radiation dose should be highlighted as FL contributed to the predictive accuracy at every time point examined a trend similar to another multivariate study of protein markers of radiation exposure, which also identified FL as a best predictive marker at comparable time points postirradiation (15). At day 2 postirradiation, the best model for dose prediction utilized a combination of FL, FGB and PTX3 and this study is the first to characterize FGB and PTX3 as useful markers of radiation exposure at this time point. Use of FL and PTX3 at day 3 and FL and SAA at day 7 postirradiation are also novel findings.
During a radiological event, it is unlikely that the received pattern of exposure will be uniform. Partial-body exposures are far more likely in the form of external exposure to ionizing radiation or internal contamination from inhaled or ingested radionuclides (16, 17). In this study we tested our TBI generated models for their accuracy predicting partial-body exposures to either percentages of whole-body mass or to specific regions of the body. Predictive accuracy of the TBI model at day 1 postirradiation was not as high when used to evaluate partial-body exposures at day 1 postirradiation. Similarly, the day 3 TBI model did not have as high a predictive accuracy when evaluating at day 3 after partial-body irradiation. A trend of increasing predictive accuracy correlating with increasing percentage of body mass exposed however, was seen at both time points. It may be expected that the TBI model became a better fit for partial-body exposures as the area of exposed body mass approached a TBI profile.
In the case of a deployment of a radiation dispersal device (RDD) or a nuclear event, it is likely that a large population will be affected and medical management and triage of such an event will necessitate rapid point of care diagnostics which can assess the level of radiation exposure. As radiation exposures from this type of event will be predominantly heterogeneous, development of partial-body irradiation models is necessary both for injury assessment and determination of unknown dose. Further development of partial-body irradiation models is needed to improve dose assessment and to evaluate the contribution of radiation exposure to combined injury. Better characterization of partial-body exposures will also aid in the discovery of novel organ specific biomarkers of radiation injury relevant to mass casualty management of radiological events. Methods to assess amount of exposure in persons without physical injury will also be useful for separation of the exposed from nonexposed and to assure the “worried well” (18).
Methodologies for dose assessment will also be improved through the use of a panel of multiple biomarker proteins, as it is unlikely that any single marker alone will be sufficient to determine level of exposure at all time points. In the current study, at every time point evaluated other than day 1 postirradiation, use of multiple biomarkers yielded a stronger model than use of a single marker alone. Other studies have also shown increased efficacy of radiation dose prediction when multiple biomarkers of radiation exposure were combined (5, 8, 14, 15, 19). Our study has yielded models for dose prediction of unknown radiation exposure which are time point specific and identify the minimum number of biomarkers which provide sufficient statistical robustness for diagnostic evaluation and early treatment decisions. We also show the potential utility of applying dose prediction models of TBI to PBI. Proteomic biomarkers of radiation exposure hold great potential for medical management of future radiologic events.
Supplementary Material
Table S1. Predictive accuracy scores for each individual dose for the best TBI prediction model at day 1, 2, 3 and 7 postirradiation.
Acknowledgments
This research was supported in part by funding from the Radiation and Nuclear Countermeasures Program, #Y2-OD-0332-01 NIAID and by the Intramural Research Program of the National Institutes of Health, National Cancer Institute, #ZIA SC 010373.
Footnotes
Editor’s note. The online version of this article (DOI: 10.1667/RR14558.1) contains supplementary information that is available to all authorized users.
References
- 1.Pandey BN, Kumar A, Tiwari P, Mishra KP. Radiobiological basis in management of accidental radiation exposure. Int J Radiat Biol. 2010;86:613–35. doi: 10.3109/09553001003746059. [DOI] [PubMed] [Google Scholar]
- 2.Ryu W-S, Kim CK, Kim BJ, Kim C, Lee S-H, Yoon B-W. Pentraxin 3: A novel and independent prognostic marker in ischemic stroke. Atherosclerosis. 2012;220:581–86. doi: 10.1016/j.atherosclerosis.2011.11.036. [DOI] [PubMed] [Google Scholar]
- 3.Sproull M, Avondoglio D, Kramp T, Shankavaram U, Camphausen K. Correlation of plasma FL expression with bone marrow irradiation dose. PLoS ONE. 2013;8:e58558. doi: 10.1371/journal.pone.0058558. [DOI] [PMC free article] [PubMed] [Google Scholar]
- 4.Sproull M, Kramp T, Tandle A, Shankavaram U, Camphausen K. Serum amyloid A as a biomarker for radiation exposure. Radiat Res. 2015;184:14–23. doi: 10.1667/RR13927.1. [DOI] [PMC free article] [PubMed] [Google Scholar]
- 5.Blakely W, Sandgren DJ, Nagy V, Kim SY, Ossetrova NI. Murine partial-body radiation exposure model for biodosimetry studies-preliminary report. Radiat Measure. 2011 [Google Scholar]
- 6.Ossetrova NI, Sandgren DJ, Blakely WF. Protein biomarkers for enhancement of radiation dose and injury assessment in nonhuman primate total-body irradiation model. Radiat Prot Dosimetry. 2014;159:61–76. doi: 10.1093/rpd/ncu165. [DOI] [PubMed] [Google Scholar]
- 7.Mantovani A, Garlanda C, Doni A, Bottazzi B. Pentraxins in innate immunity: from C-reactive protein to the long pentraxin PTX3. J Clin Immun. 2008;28:1–13. doi: 10.1007/s10875-007-9126-7. [DOI] [PubMed] [Google Scholar]
- 8.Blakely WF, Sandgren DJ, Nagy V, Kim S-Y, Sigal GB, Ossetrova NI. Further biodosimetry investigations using murine partial-body irradiation model. Radiat Prot Dosimetry. 2014;159:46–51. doi: 10.1093/rpd/ncu127. [DOI] [PubMed] [Google Scholar]
- 9.Ossetrova NI, Sandgren DJ, Blakely WF. Protein biomarkers for enhancement of radiation dose and injury assessment in nonhuman primate total-body irradiation model. Radiat Prot Dosimetry. 2014;159:61–76. doi: 10.1093/rpd/ncu165. [DOI] [PubMed] [Google Scholar]
- 10.Ossetrova NI, Sandgren DJ, Blakely WF. C-reactive protein and serum amyloid A as early-phase and prognostic indicators of acute radiation exposure in nonhuman primate total-body irradiation model. Radiat Measure. 2011;46:1019–24. [Google Scholar]
- 11.Team RC. R: A language and environment for statistical computing. Vienna, Austria: R Foundation for Statistical Computing; 2015. [Google Scholar]
- 12.Burnham KP, Anderson DR. Model selection and multimodel inference: a practical information-theoretic approach. Springer; 2002. [Google Scholar]
- 13.Heslet L, Bay C, Nepper-Christensen S. Acute radiation syndrome (ARS) – treatment of the reduced host defense. Int J Gen Med. 2012;5:105–15. doi: 10.2147/IJGM.S22177. [DOI] [PMC free article] [PubMed] [Google Scholar]
- 14.Kim D, Marchetti F, Chen Z, Zaric S, Wilson RJ, Hall DA, et al. Nanosensor dosimetry of mouse blood proteins after exposure to ionizing radiation. Sci Reports. 2013;3:2234. doi: 10.1038/srep02234. [DOI] [PMC free article] [PubMed] [Google Scholar]
- 15.Ossetrova NI, Condliffe DP, Ney PH, Krasnopolsky K, Hieber KP, Rahman A, et al. Early-response biomarkers for assessment of radiation exposure in a mouse total-body irradiation model. Health Phys. 2014;106:772–86. doi: 10.1097/HP.0000000000000094. [DOI] [PubMed] [Google Scholar]
- 16.Prasanna PG, Blakely WF, Bertho JM, Chute JP, Cohen EP, Goans RE, et al. Synopsis of partial-body radiation diagnostic biomarkers and medical management of radiation injury workshop. Radiat Res. 2010;173:245–53. doi: 10.1667/RR1993.1. [DOI] [PMC free article] [PubMed] [Google Scholar]
- 17.Etherington G, Rothkamm K, Shutt AL, Youngman MJ. Triage, monitoring and dose assessment for people exposed to ionising radiation following a malevolent act. Radiat Prot Dosimetry. 144:534–9. doi: 10.1093/rpd/ncq420. [DOI] [PubMed] [Google Scholar]
- 18.Koenig KL, Goans RE, Hatchett RJ, Mettler FA, Jr, Schumacher TA, Noji EK, et al. Medical treatment of radiological casualties: current concepts. Ann Emerg Med. 2005;45:643–52. doi: 10.1016/j.annemergmed.2005.01.020. [DOI] [PubMed] [Google Scholar]
- 19.Blakely WF, Ossetrova NI, Whitnall MH, Sandgren DJ, Krivokrysenko VI, Shakhov A, et al. Multiple parameter radiation injury assessment using a nonhuman primate radiation model-biodosimetry applications. Health Phys. 2010;98:153–9. doi: 10.1097/HP.0b013e3181b0306d. [DOI] [PubMed] [Google Scholar]
Associated Data
This section collects any data citations, data availability statements, or supplementary materials included in this article.
Supplementary Materials
Table S1. Predictive accuracy scores for each individual dose for the best TBI prediction model at day 1, 2, 3 and 7 postirradiation.