Abstract
In this work, we report an integrated microfluidic device for cell co-culture under different concentrations of oxygen, in which the secreted protein VEGF165 was on-line qualitatively and semi-quantitatively analyzed by functional nucleic acid, hemin, ABTS and peroxide system. This microfluidic platform allowed investigation of various oxygen and distances effect on cell-to-cell communication. Besides, the microfluidic device was used for real-time analysis of VEGF165 protein by aptamer-functionalized microchannels. Under 5% O2 condition, we found that the migration of CaSki cells was faster than the migration of human umbilical vein endothelial cells. However, the migration of CaSki cells was slower than the migration of HUVECs under 15% O2 condition. Moreover, the shorter intercellular distances, the quicker cells migration. Furthermore, HIF-1α and VEGF165 genes, ROS were analyzed, and the results would provide new perspectives for the diagnosis and medical treatment of cervical cancer.
Oxygen level plays an important role in tumor growth, invasion and metastasis1,2. Low level of oxygen (hypoxia, <1%) induces tumor cell invasion into neighboring healthy vasculatures, resulting in metastasis3,4. Great efforts have been devoted into understanding the effects of oxygen level on tumor development in vivo. However, it is still difficult to study tumor development under different oxygen conditions because it is technically challenging in precisely controlling the conditions in vivo and in vitro, as well as monitoring cell-cell communication in the microenvironments. Although hypoxic culture chamber system is usually applied, it remains a challenge to mimic the in-vivo cellular microenvironment under biophysical stimuli such as the biomolecular transport gradient.
Microfluidic device has been increasingly emerging as a suitable platform for in-vitro mimicking oxygen gradient microenvironment because it regulates critical elements such as diffusion distance, and precisely controls the cellular and non-cellular microenvironment especially oxygen condition at the micrometer scale5,6,7. Previous works have been reported that different intercellular distances greatly affected on substance exchange and cell-cell communication8,9. In addition, oxygen gradients are generated in the microfluidic by using a flowing condition of pre-defined gas mixtures through channels10,11. However, there are few studies for different oxygen concentrations affected cell-cell interaction with real-time detection of cell secretions, which could provide insight into the tumor development. A microfluidic system has been designed to co-culture two types of cell in microchannels with channel altitude difference to promote nutrition and material exchange12,13. On-line analysis of cell co-culture metabolites is still challenged for in-situ monitoring biomarkers. An alternative strategy is to use aptamers for specifically capture of cell secreted vascular endothelial growth factor 165 (VEGF165)14,15,16. The captured proteins can be analyzed by functional nucleic acids with G-quadruplex DNAzyme, hemin, ABTS and peroxide system, which produces differences of color17,18. Thus, it can be analyzed semi-quantitatively by naked eyes without specialized instruments.
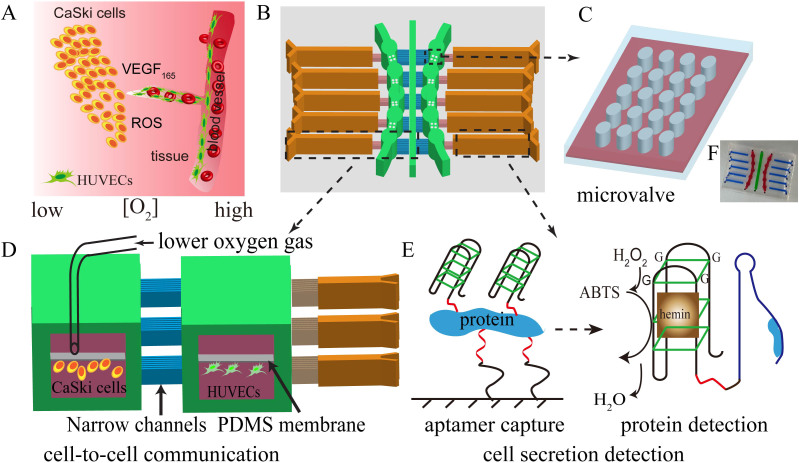
Herein, we presented a feasible investigation of the effects of various oxygen and distances on cell migration and cell communication by designing a two-layered microfluidic system. We presumed that under different oxygen contents, the amount of VEGF165 protein and ROS would be affected, and then influenced cellular behaviors (Fig. 1A). To prove this concept, CaSki cells (derived from cervical cancer) and human umbilical vein endothelial cells (HUVECs) were co-cultured in the microchannels as models of tumor cells (TCs) and endothelial cells (ECs), respectively (Fig. 1A). Under 5% O2 conditions, the migration of CaSki cells was faster than human umbilical vein endothelial cells, which might be a reflection of tumor invasion or tumor metastasis in cervical cancer. In contrast, the migration of CaSki cells was slower than HUVECs under 15% O2 conditions, which would promote angiogenesis. Moreover, the shorter intercellular distances, the quicker cells migration. To demonstrate the cell-cell interactions, the on-line analysis of VEGF165 (protein) was successfully achieved (Fig. 1). Furthermore, HIF-1α and VEGF165 genes, ROS were analyzed, and the results may provide deeper insights into tumor development19,20,21.
Figure 1. An integrated microfluidic device for cell co-culture under oxygen gradient system, in which for determination of the secreted protein VEGF165.
(A) Oxygen effects cell-cell communication and promotes cell migration. (B) Schematic diagrams of the microfluidic device to mimic oxygen gradient and to observe cells migration. (C) The microvalve prepared by micro columns. (D) Two-layer microfluidic device for cells co-culture under low oxygen conditions. (E) Schematic illustration for determination VEGF165 based on nucleic acid aptamer. (F) The actual microfluidic device.
Results
Fabrication of two-layered microfluidic device
Two-layered microfluidic devices were designed with three various distances of channels (Fig. 1B, F). The cell culture chambers were 2.4 mm in diameter and 1.6 mm in width (Fig. 1B). The TCs was spatially cultured into the central microchannels (width 1.6 mm) and the cell-cell interactions were studied by using three different distances of narrow channels (Fig. 1D). The distance between three different chambers and the central channel were designed as 1.50 mm, 2.00 mm, 3.00 mm, respectively. The microchannels with 58 μm altitude differences were designed to control the cell growth microenvironment (Fig. 1D and Fig. S1 in Supporting Information). These altitude differences could prevent the cells entering into next channels and also allow the exchange of cellular soluble factors (see Fig. S2)21. PDMS membrane (20-μm thickness) has an excellent gas diffusion that was used to reduce the shear-stress produced by mixture gas (Fig. 1D and Fig. S1C)5,22. The outlet pressure changed slightly compared to the inlet pressure after applying the PDMS membrane in Fig. S3. We have also evaluated actual oxygen concentration in culture medium by applying Clark oxygen electrode. The results in Fig. S4 showed that the content of oxygen was changed. The shorter distance will lead to larger changes. The PDMS micro-columns were served as microvalves enabled to control the fluidic direction in virtue of its elastic characteristic (Fig. 1C, Fig. S1B and Supplementary Video 1). When the cell secretions were detected, the microchip was overturned. The liquid reflow can be greatly reduced when the microvalves were closed by mechanical force because some liquid was depressed to the low layer channel (Supplementary Video 2). More details of microfluidic device were described and discussed in the supporting information.
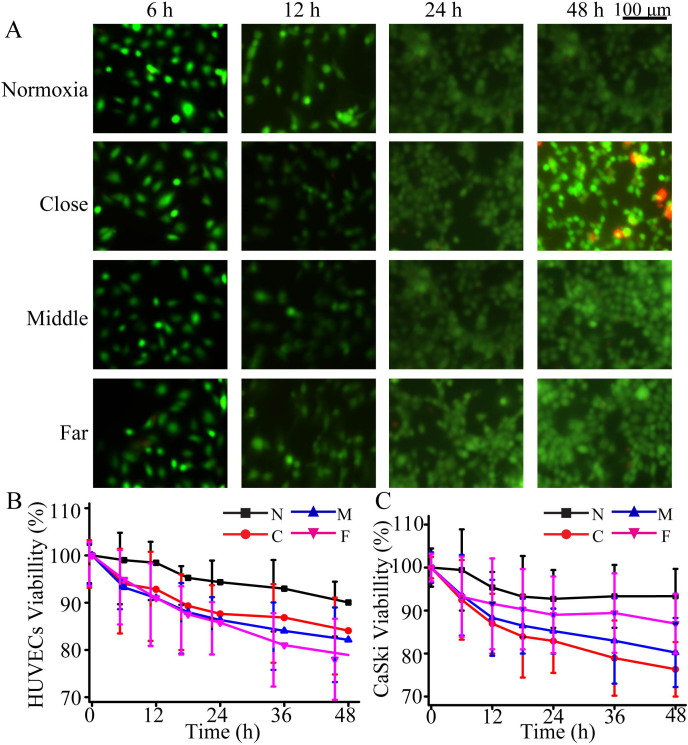
CaSki cells and HUVECs were co-cultured in the microfluidic device to mimic the cellular microenvironment. Specially, CaSki cells were cultured under a mixture gas (5% O2, and 95% N2), while HUVECs were cultured under 21% O2 condition (21% O2 and 79% N2). 21% O2 conditions was set as a control because cells were cultured in 21% O2 conditions, there is little even no changes will be happen for cells in and out of the incubator. Control experiments were performed with the same condition except that both two types of cells were co-cultured in 21% O2 condition. The cell viability was accessed by cell live/dead kit under 5% O2. Fig. 2 (B–C) shows that cell viability was decreased with increasing period within 2 days. After 2 days, the viability of HUVECs and CaSki cells were still up to 80% and 86%, respectively. These results indicated that this microfluidic device can be suitable for cell-to-cell communication.
Figure 2. CaSki cells co-cultured with HUVECs under 5% O2 condition.
(A) Fluorescent images of cells viability with HUVECs; (B) The viability of HUVECs; (C) The viability of CaSki cells. N indicated that cells under 21% O2 condition. C, M and F indicated that cells under 5% O2 condition with close, middle, and far distance between two cell lines, respectively.
Study of cell migration under 5% O2 condition
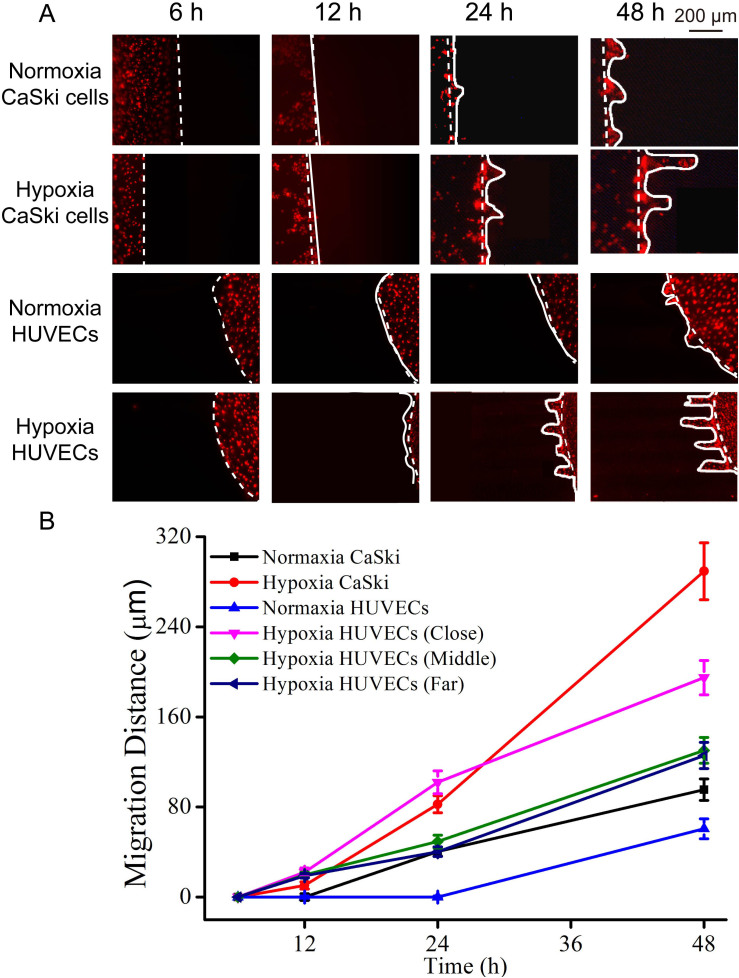
The cell migration of both cell lines was studied under 5% O2 condition. In order to evaluate cellular migration, cells were labeled Dio fluorescent dye before cell seeding. After cell adhesion for 6 h, the distance was set as zero. After that, we introduced the mixture gas (5% O2, 95% N2), and recorded cell migration every 12 h. Finally, we calculated the cellular migration according to the distance of cells movement and the culture period. As shown in Fig. 3(A–B), the migration distance was set as zero when the co-cultured cells were filled with mixture gas in the microfluidic device. After 12 h co-cultured, neither cell lines migrated. For 24 h co-culture, it was clearly observed that both the two cell lines migrated from the original channel to the narrow channel. The migration rate of CaSki cells was higher than that of HUVECs in the far and middle chambers, but lower than that of HUVECs in the close chamber. Interestingly, the CaSki cells migrated faster than HUVECs from 24 h to 48 h. After 48 h co-culture, the farthest migration distances for CaSki cells and HUVECs were (289 ± 22) μm and (194 ± 19) μm, respectively. The migration rate of CaSki cells was higher than that of HUVECs. In addition, both two types of cells under 5% O2 migrated faster than the cells under 21% O2. Furthermore, the closer distance between two cell lines led to farther migration distance for cells movement, indicating the distance was an important factor for cell communication.
Figure 3. Cells migration under co-culturing with 5% O2 condition during 2 days.
(A) Fluorescent images of cells migration. (B) The migration distance of CaSki cells and HUVECs in different chambers. Dashed line represents the cell positions at 0 h; the solid line represents the migration positions of cells in the corresponding time. Both two cells were labeled Dio fluorescent dye before cell seeding. Error bar was calculated by triplicate experiments.
Cell migration under 15% O2 condition
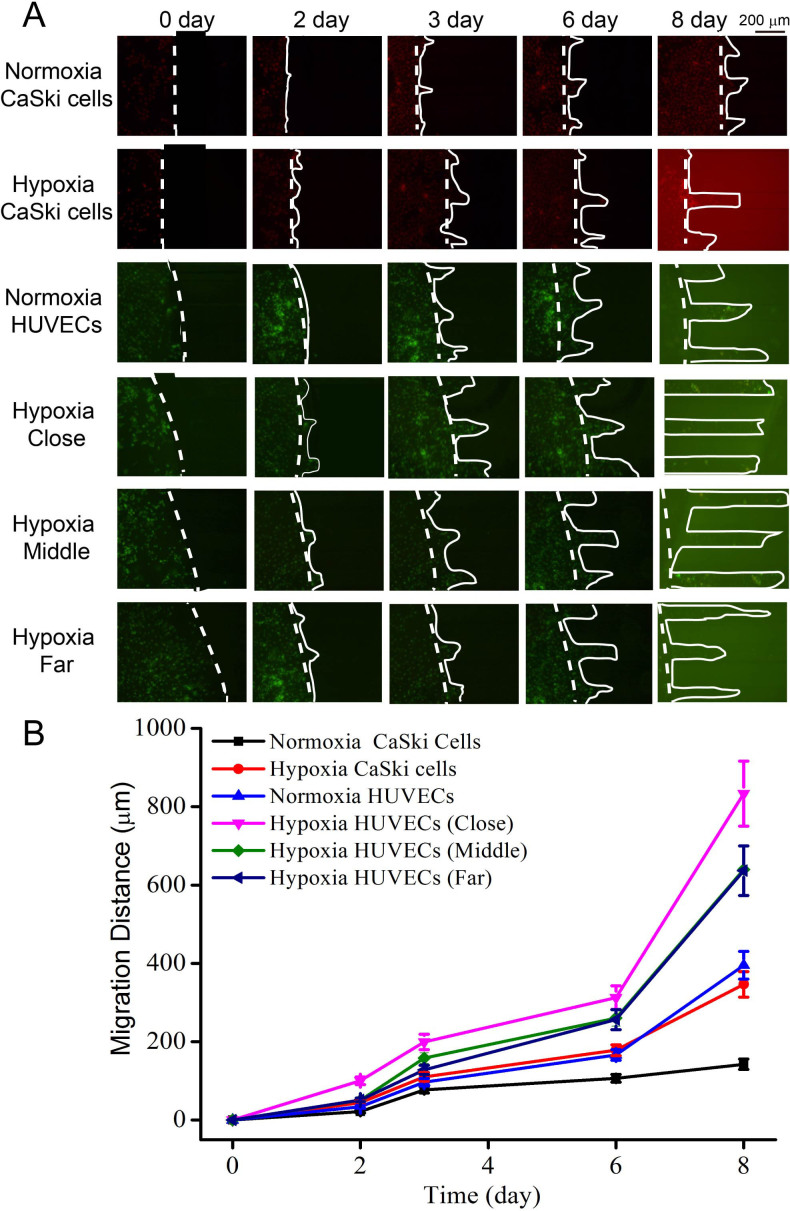
To better understand the effects of oxygen level on cell-to-cell communication, CaSki cells and HUVECs were co-cultured in the microfluidic device under 15% O2 conditions. Choosing 15% oxygen as another level was due to some oxygen loss in the microchip and the level of oxygen in the arterial blood oxygen can be as high as 13%. To track cell movement, CaSki cells and HUVECs were respectively labeled with DiI and Dio dye before co-cultured on-chip. As shown in Fig. 4, after co-cultured 2 days, both two cell lines migrated. The migration rate has accelerated from day 3 and day 6. During day 6 to day 8, the migration rate of cells was greatly accelerated. After day 8, HUVEC cells were significantly migrated away from primary site, and the furthest migration distance was (833 ± 25) μm. In contrast, the CaSki cells only migrated about (350 ± 10) μm. Both two cell lines migrated faster under 15% O2 condition compared to under 21% O2 condition. Furthermore, the migration of CaSki cells was slower than HUVECs under 15% O2 condition. This was very different from under 5% O2 condition. Thus, the closer distance between two cell lines also resulted in higher cell migration ability.
Figure 4. Cells migration under co-culturing at 15% O2 in 8 days.
(A) Fluorescent images of Cells migration. (B) The migration distance of CaSki cells, and HUVECs in different chambers. CaSki cells and HUVECs were respectively labeled DiI and Dio fluorescent dye before cell seeding. Error bar was calculated by triplicate experiments. Dashed line represents the cell positions at 0 hr; the solid line represents the migration positions of cells in the corresponding time. Both two cells were labeled DiI fluorescent dye before cell seeding. Error bar was calculated by triplicate experiments.
Study of HIF-1α and VEGF165 genes, VEGF165 protein, ROS under 5% and 15% O2 conditions
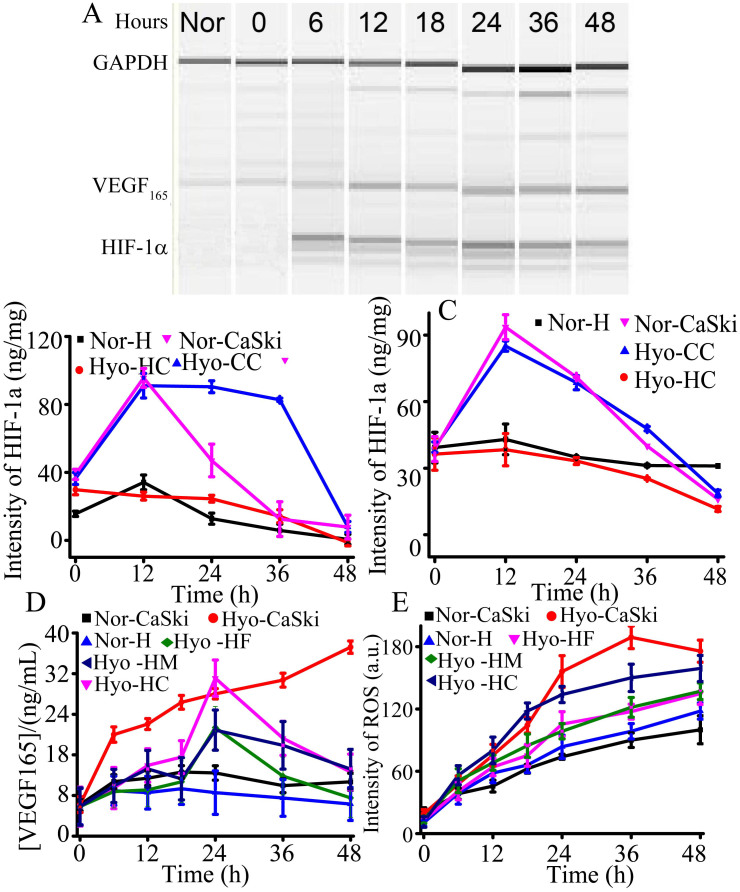
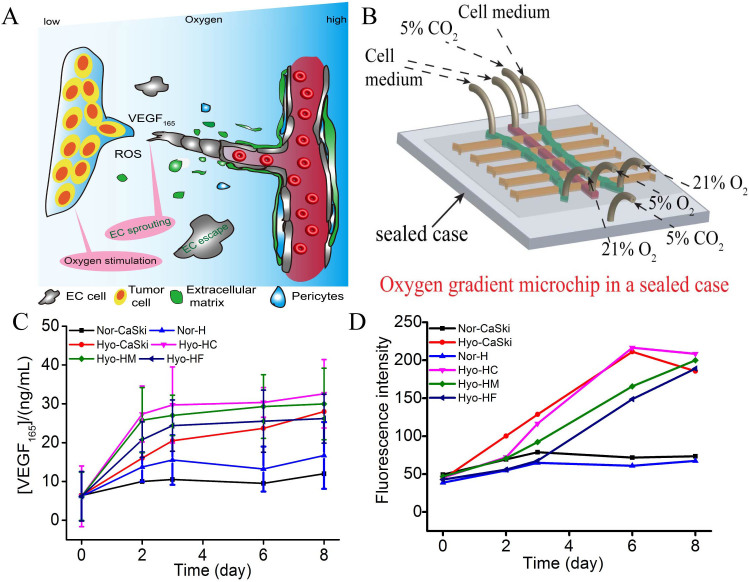
HIF-1α, ROS and VEGF165 are three well-known biomarkers in tumor angiogenesis and tumor invasion. High level of VEGF165 protein enhances the cell permeability to accelerate the tumor cell migration23,24. High ROS generation might result in the slower cell migration because of cell damage, which could cause tumor invasion due to the relatively higher oxygen tension required at the invasive front25,26. To investigate the biological principle under the phenomenon, HIF-1α and VEGF165 genes were analyzed by the combination of RT-PCR and microchip electrophoresis. VEGF165 protein was on-line analyzed by functional nucleic acids consisting of aptamer and G-quadruplex structure in Fig. (S5–S6)17,27. The details of VEGF165 capture and detection were discussed in supporting information. As shown in Fig. 5A and Fig. S7, the HIF-1α gene was raised with time under 5% O2 condition, which indicated that HIF-1α was activated and accumulated under 5% O2 environment. HIF-1α protein was analyzed by the standard ELISA kit (Cloud-clone Corp, USA) and the total protein was analyzed by Bradford kit (BiomigaInc., USA). As shown in Fig. 5B, the content of HIF-1α protein was increased within 12 hours and the intensity remained at about 85 ng/mg from 12 h to 36 h, then was decreased when HUVEC cells was co-cultured in the close chamber during 48 h. The content of HIF-1α protein was increased within 12 h, and then gradually decreased when HUVEC cells was co-cultured in the far chamber during 48 h in Fig. 5C. These results indicated that the closer distance led to the lower oxygen, and then the lower concentration of oxygen can reduce HIF-1α degradation. These results were consistent of the oxygen gradient related to the distance in Fig. S4. Furthermore, the results also indicated that the distance effected cellular communication. Moreover, the VEGF165 gene was also increased depending on the time extension, indicating HIF-1α may up-regulate VEGF165 gene. As shown in Fig. 5D, the VEGF165 protein secreted by CaSki cells increased rapidly during 6 h, and then slowed down from 24 h to 48 h, indicating that 5% O2 stimulation enhanced the VEGF165 protein expression in TCs. In HUVECs, VEGF165 protein also increased with increasing time during the beginning 24 h, and then decreased from 24 h to 48 h. Besides, the shorter distance, the bigger changes of VEGF165 protein led to high migration activity of HUVECs in closer chamber. The expression of VEGF165 protein after 24 h in HUVECs was lower than that of CaSki cells. Under 15% O2 conditions, a number of VEGF165 were secreted during the first two days, and maintained from 2 days to 8 days co-culture in Fig. 6C. To ensure the reliable results, a VEGF Quantitative ELISA kit was used to analyze VEGF165 in cell medium under oxygen stimulation. The trends of VEGF165 protein between using ELISA Kit and the established method are in agreement.
Figure 5. VEGF pathway during 48 hours at 5% O2.
(A) Time-dependence HIF-1α and VEGF165 genes for CaSki cells by 2% hydroxyethyl cellulose electrophoresis. The control gene was GAPDH. (B)HIF-1α protein expression from the close chamber; (C)HIF-1α protein expression from the far chamber; (D) VEGF165 protein expression; (E) ROS intensity. Normoxia indicated that cells culture with 21% O2, the other cells cultured under 5% O2. Nor means both the cells co-culture under normoxic condition. Hyo means the cells co-culture under hypoxia condition. H indicates HUVECs. HF indicates HUVECs cultured in the far chamber. HC indicates HUVECs cultured in the close chamber. HM indicates HUVECs cultured in the middle chamber.
Figure 6. Cells stimulation and secretion at 15% O2.
(A) The possible cell-to-cell communication mode between the CaSki cells and HUVECS model; (B) Oxygen gradient microchip in a sealed case; (C) VEGF165 protein expression; (D) ROS intensity.
ROS is usually contributed to various aspects of malignant tumors, including carcinogenesis, aberrant growth, metastasis, and angiogenesis28,29. Under a 21% O2 microenvironment, the generation of ROS maintained at a low frequency because it could easily be neutralized by antioxidant defenses in Fig. 5E. The content of ROS under 5% O2 was higher than that under 21% O2, indicating that the balance of antioxidant defenses might be broken. During the first 24 h, the generation of ROS in both cells was higher than that after 24 h, which is different for the cell migration. Fig. 6D shows ROS generated quickly in the primary 6 days under 15% O2. After 6 days, the concentration of ROS was also increased except that from CaSki cells and HUVECs in close chamber under hypoxic conditions. Besides, in the close distance, the content of ROS was high, demonstrating that the distance affected the ROS diffusion.
Discussion
In this work, we have successfully developed a two-layered microfluidic system to study the effects of various oxygen and distances on cell migration. The effect of oxygen content for cell migration was investigated by introducing different oxygen of 5% O2 and 15% O2 respectively into the up-layer of the main microchannels. Besides, to keep the pH of culturing cell microenvironment was stable, a mixture gas with 5% CO2, 21% O2 and 74% N2 was incessantly provided (Supplementary Video 3 and Fig. 6B).
In order to get low content of oxygen, we firstly optimized the distance between microchannel and chambers to make sure the substance can be exchanged in time for cells. When the distance of microchannel and chambers was range from 1.20 mm to 3.00, the liquid can be reached adjacent channel and chambers during 30 min. If the larger distances were set, it was hard to exchange substance effectively. When the distances were lower than 1.20 mm, the substance was too earliest to exchange. The stability of oxygen content in the system was studied. When the main channel introduced hypoxia conditions (<1% O2), the oxygen content was increased to 4% during 2 days. Then, to keep the low oxygen content, we take the process by increasing the gas flow rate. Unfortunately, high flow rate enhanced the gas exchange, which is also hard to keep stability of oxygen content under the condition of 1% oxygen. Nevertheless, the system exhibited a good stability when the oxygen content was higher than 4%. Therefore, to mimic physiological growth conditions and to better understand the cell communication31,32,33, we exposed TCs and ECs to 5% O2 condition and the system as following: the lowest distance was set as 1.2 mm, and the low average distance was about 1.5 mm. Finally, we are still looking for new methods or materials for study oxygen effect especially the hypoxic (<1% O2) study.
VEGF has been shown to play an important role in angiogenesis of cardiovascular and cerebral ischemia, which can be overexpressed by activated HIF-1α. Hence, the expression of HIF-1α and VEGF165 were studied by inducing the different content of oxygen. Under 5% O2 condition, HIF-1α accumulated within the first 12 h, and the concentration merely changed from 12 h to 36 h in vicinity chamber (Fig. 5B). On the contrary, it rapidly decreased from 12 h to 36 h in relatively farther chamber (Fig. 5C). These results indicated the oxygen content effect HIF-1α expression during the 48 h. Then we applied a G-quadruplex, hemin, ABTS and peroxide system to detect VEGF165 protein. We observed obvious color change as a marker for different amount of cell secretion VEGF165 protein. Under 5% O2 conditions, VEGF165 increased in the closest TCs culture chamber, where cells also moved a farthest distance. For HUVECs, the concentration of VEGF165 under 5% O2 conditions was also higher than that under 21% O2 conditions, thus promoting a more active cell migration. Besides, a common rule was that shorter the distance between two types of cell culture chamber, the more VEGF165 cell would secrete. More VEGF165 resulted in farther migration, although after 24 h the concentration of VEGF165 decreased anyway. Furthermore, TCs secreted more VEGF165 than ECs under 5% O2, which explained why the migration of TCs was faster than ECs in the same time interval, although ECs themselves are very responsive to VEGF165. Since HUVECs are ECs, the higher viability of TCs may lead to faster movement than HUVECs.
High concentration of ROS is able to stimulate the generation of tumor, and could activate the expression of VEGF165, which accelerated CaSki cell migration in our experiment. Under 5% O2 conditions, the cell apoptosis was time-dependent and accelerated with the increasing period (Fig. S8 and Fig. S9). The apoptosis rate of CaSki cells was lower than HUVECs, indicating that the anti-hypoxia ability of HUVECs was inferior to CaSki cells. Besides, the cell apoptosis rate of HUVECs in vicinity chambers was higher than that in chambers of farther distance, which might be caused by cell damage from high-level ROS and VEGF165 protein30 induced by 5% O2 condition. These results revealed that the HUVECs presented a lower migration activity than CaSki cells. Cell proliferation was also studied in time-dependent growth pattern under 5% O2 condition (Fig. S10). During two days' co-culture, the number of CaSki cells and HUVECs both increased, and the CCK-8 absorbent became stronger. The growth rate of CaSki cells was about 1.25-fold that of HUVECs. The viability of CaSki cells was also higher than HUVECs (Fig. 2), illustrating that CaSki cells were more tolerant to low level of oxygen content than HUVECs. The higher viability and less inhibited proliferation in close co-culture of two cells made the CaSki cells move faster than HUVECs under 5% O2 condition, implying that the distance was an important factor for cell communication. In addition, high cell viability and proliferation rate under 21% O2 conditions indicated that this microfluidic system can be served to study the cell-cell communication under different oxygen content environments.
Under 15% O2 conditions, both types of cells migrated slowly within two days' co-culture. However, from Day 2 to Day 6, the migration rate was accelerated. The migration rate of cells was further accelerated from day 6 to day 8. Combination with cell secreting VEGF165 protein and ROS (Fig. 6), we found that when cells were cultured under 15% O2 condition, VEGF165 protein expressed at a stable level from day 2 to day 6. However, the ROS level was increased with the culture period, which might cause cell damage and lead to reduced VEGF165 expresion from day 6 to day 8. High ROS level also made HUVECs move slowly. During day 6 to day 8, the decline of ROS level in CaSki cells made HUVECs move faster to CaSki cell chamber. Besides, shorter distance between two cell lines can lead to faster migration rate of HUVECs, indicating that the distance was a significant influencing factor on cell migration. It was reasonable to interpret the above fact as that shorter distance accelerated substance exchange and promote cell migration. Thus, our strategy offered an excellent model for investigating the effect of oxygen level on cell migration, and might be potentially useful in predicting prognosis.
In summary, a two-layer microfluidic system was developed to study cell migration under two different low oxygen (5% and 15% O2) levels in vitro, and the cell secretion was monitored in real time. This system varied the distances for cell-cell co-culture, and allowed the substance exchanged by diffusion process. As important influencing factors in tumor development, ROS and VEGF165 were online detected in microfluidic device. The device was used to study cell-cell communication with different distances under 5% O2 and 15% O2 conditions. Hence, this study provides a better understanding of cervical cancer, which may introduce new perspectives for future therapy. Furthermore, the developed device could be employed for 3D cells co-culture, and we anticipate that the integrated device would not only be applied in investigating cell-cell communication, but also be used for therapeutic tumor or drug screening.
Methods
Fabrication of microfluidic device
A two-layer microfluidic device was fabricated using poly-dimethylsiloxane (PDMS, Sylgard 184, Dow Corning) by two steps of standard soft lithography and replicamolding techniques12,13. The top and bottom layers with microchannels were exactly the same. Briefly, negative photoresist SU-8 2050 (Microchem, Newton, MA) was spun onto a silica wafer (Tianjin, China) at a speed of 2500 rpm for 50.0 s using a spin-coater. After baking at 65.0°C for 10 min, UV light exposure and following development were done to generate the layer of narrow channels (24.0 μm thick). Then another layer of SU-8 2050 photoresist was coated onto the same wafer at a speed of 1000 rpm for 50.0 s. After baking at 65°C for 10.0 min, UV light exposure and development were done to generate the layer of cell culture chambers and main channels (82.0 μm heigh). 10.0 μL silylation reagents and the silica master were then put into vacuum kettle together to make the silica master hydrophobic. Then, a premixed 10:1 PDMS preploymer and curing agent (DowCorning, Sylgard 184, Midland, MI, USA) was poured onto the mold and degassed to vacuum for 30.0 min. After curing at 75.0°C for 2 h in an oven, the PDMS was peeled off carefully and cut into the designed shape. 20.0-μm thick PDMS membrane was produced by spin-coating PDMS prepolymer (10:1) on a plastic wafer with 3500 rpm for 60.0 s, and then was baked at 65.0°C for 30.0 min. Then, the bottom chip was sealed with PDMS membrane via oxygen plasma. Finally, the top replica were aligned carefully with bottom PDMS that containing membrane via oxygen plasma.
The Clark electrode for measuring dissolved oxygen in cell medium
The determination of oxygen content in cell medium was conducted by electrochemical sensors based on Clark oxygen electrode34,35. Three kinds of microchips were fabricated for cell-culturing with the same design except a variation of distance between main channel and chambers. The distance was 1.50 mm, 2.00 mm, and 3.00 mm, respectively. These three kinds of microchips can be used to detect dissolved oxygen content relative to different chamber-channel distances. Before the detection process started, the oxygen of cell medium was removed by air blowing of nitrogen. Then, the up-layer channel was filled out with different content oxygen gas, and 10.0 mL treated cell medium was non-stop introduced to the bottom-layer channels. The cell medium was finally collected into a closed-centrifuge tube. After that, the dissolved oxygen of collected cell medium was detected by Clark-type oxygen electrodes according to the manufacturer's instructions of Horiba U-50 (Kyoto, Japan).
Aptamer based microfluidic device for VEGF165 detection
In order to coat the aptamer in the detection regions of microchannel, outlets of cell culture channels were blocked by plugs to stop the liquid from flowing into other region. Then, the microchannels were modified by the injection of specific aptamer reagent. The procedure of coating aptamer on the microchannel was processed according to a developed method which has been described in previous work3. Firstly, channels full of carboxylatedsilancance were put into a vacuum environment for 30 min. After that, the microchannels were washed with PBS buffer (pH 7.4) for three times. Secondly, the carboxylic group was activated by standard amine coupling procedure using freshly prepared mixture solution of NHS solution (0.20 M) and EDC solution (0.80 M). Thirdly, the amino-modified aptamer with 2% BSA was injected into the microchannel for immobilization. The unbound aptamer was removed by washing the channels with 0.010 M PBS buffer containing 0.1% Tween-20 (PBST) for three times. After that, PBST was introduced to block the blank sites, and the device was stored at 4°C for further use. For VEGF detection, a fresh solution with ABTS (1.80 mM) and H2O2 substrate (2.92 mM) was added in each channel after the injection of aptamer and 100.0 μM hemin. Detection aptamer, a functional nucleic acid sequence containing aptamer and G-quadruplex was used to detect VEGF. At last, the green-blue color or absorbance produced by G-quadruplex DNAzyme-hemin-ABTS-peroxide was characterized using naked eye or quantified by UV−vis absorption spectra. The UV−vis absorption spectra detection photos were obtained by microscope equipped with a CCD camera after 10.0 min reaction. In order to ensure the reliability and accuracy of this method, VEGF165 was also detected by the commercial ELISA kit.
Cells co-culture in the microchip under oxygen condition
CaSki cells and HUVECs were cultured in RPMI 1640 media (GIBCO, Grand Island, NY) with 10% fetal bovine serum (FBS), 100.0 μg/mL penicillin, and 100.0 μg/mL streptomycin. Prior to culturing CaSki and HUVEC cells on chip, the microchannels were coated with 2.0% FBS at 4°C overnight and then flushed by water. After that, the microchip was exposed under UV light for 0.50 h. Caski cells and HUVECs with a concentration of 106 cells/mL were injected into central channel and middle channel with chambers, respectively. After culturing for 6.0 h, the cells adhered to the PDMS membrane. The initial medium was replaced by a new medium including only 2% fetal bovine serum (FBS) to decrease the discrepancy. Then, the microchip was overturned. At last, the mixture gas was applied to top layer of the microchip to make a hypoxia microenvironment.
Characterization of cells
CCK-8 kit was utilized to monitor the cell proliferation under hypoxia treatment. Cell apoptosis was characterized by Hoechst 33342. Hoechst 33342 (100.0 μM) was incubated with these two types of cells for 20.0 min at 37°C and the images were collected by fluorescence microscopy (Leica DMI 4000 B, Germany). Cell viabilities of CaSki cells and HUVECs were determined by calcein AM and ethidiumhomodimer (live/dead kit).
RNA Extraction and DNA amplification by PCR
RNA was extracted by EZNA Total RNA kit (Omega Bio-Tek; Doraville, GA) according to the manufacturer's instructions after the two kinds of cells were collected from cell microchannels after trypsin digestion. The kits from TiangenBiotech were employed for cDNA transcription. Using the GAPDH as control gene, PCR process was used to study transcription level of HIF-1α, VEGF165 gene. The primers for HIF-1α, VEGF165 and GAPDH were listed in Table S1.
Supplementary Material
Supplementary Information
Supplementary Video 1
Supplementary Video 2
Supplementary Video 3
Acknowledgments
This work was supported by National Natural Science Foundation of China (Nos. 214350002, 81373373, 91213305) and China Equipment and Education Resources System (No. CERS-1-75).
Footnotes
The authors declare no competing financial interests.
Author Contributions J.M.L. conceived and supervised the project. X.L. and J.M.L. wrote the manuscript. X.L., S.W. and J.M.L. conceived of the experiments. X.L. and J.M.L. performed the experiments, designed research and analyzed data with assistance from Q.C., W.L., J.Z. and Z.L. All authors discussed the results and commented on the manuscript.
References
- Semenza G. L. Hypoxia-Inducible Factors in Physiology and Medicine. Cell 148, 399–408 (2012). [DOI] [PMC free article] [PubMed] [Google Scholar]
- Pugh C. W. & Ratcliffe P. J. Regulation of angiogenesis by hypoxia: role of the HIF system. Nat. Med. 9, 677–684 (2003). [DOI] [PubMed] [Google Scholar]
- Oladipupo S. et al. VEGF is essential for hypoxia-inducible factor-mediated neovascularization but dispensable for endothelial sprouting. Proc. Natl. Acad. Sci. U. S. A. 108, 13264–13269 (2011). [DOI] [PMC free article] [PubMed] [Google Scholar]
- Lee S. L. C. et al. Hypoxia-induced pathological angiogenesis mediates tumor cell dissemination, invasion, and metastasis in a zebrafish tumor model. Proc. Natl. Acad. Sci. U. S. A. 106, 19485–19490 (2009). [DOI] [PMC free article] [PubMed] [Google Scholar]
- Huh D., Hamilton G. A. & Ingber D. E. From 3D cell culture to organs-on-chips. Trends Cell Biol. 21, 745–754 (2011). [DOI] [PMC free article] [PubMed] [Google Scholar]
- Ren L. et al. Investigation of hypoxia-induced myocardial injury dynamics in a tissue interface mimicking microfluidic device. Anal. Chem. 85, 235–244 (2012). [DOI] [PubMed] [Google Scholar]
- Zhang Q., Liu T. & Qin J. A microfluidic-based device for study of transendothelial invasion of tumor aggregates in real time. Lab Chip 12, 2837–2842 (2012). [DOI] [PubMed] [Google Scholar]
- Ma H., Liu T., Qin J. & Lin B. Characterization of the interaction between fibroblasts and tumor cells on a microfluidic co-culture device. Electrophoresis 31, 1599–1605 (2010). [DOI] [PubMed] [Google Scholar]
- Liu T., Lin B. & Qin J. Carcinoma-associated fibroblasts promoted tumor spheroid invasion on a microfluidic 3D co-culture device. Lab Chip 10, 1671–1677 (2010). [DOI] [PubMed] [Google Scholar]
- Funamoto K. et al. A novel microfluidic platform for high-resolution imaging of a three-dimensional cell culture under a controlled hypoxic environment. Lab Chip 12, 4855–486 (2012). [DOI] [PMC free article] [PubMed] [Google Scholar]
- Shiwa T., Uchida H. & Tsukada K. Co-culture microdevice with oxygen gradient for tumor microenvironment model and metastasis imaging. Am. J. Biomed. Eng. 2, 175–180 (2012). [Google Scholar]
- Wei H., Li H., Mao S. & Lin J.-M. Cell signaling analysis by mass spectrometry under coculture conditions on an integrated microfluidic device. Anal. Chem. 83, 9306–9313 (2011). [DOI] [PubMed] [Google Scholar]
- Chen Q. et al. Microfluidic isolation of highly pure embryonic stem cells using feeder-separated co-culture system. Sci. Rep. 3, 2433 (2013). [DOI] [PMC free article] [PubMed] [Google Scholar]
- Lee J.-H. et al. A therapeutic aptamer inhibits angiogenesis by specifically targeting the heparin binding domain of VEGF165. Proc. Natl. Acad. Sci. U. S. A. 102, 18902–18907 (2005). [DOI] [PMC free article] [PubMed] [Google Scholar]
- Sosic A., Meneghello A., Antognoli A., Cretaio E. & Gatto B. Development of a multiplex sandwich aptamer microarray for the detection of VEGF(165) and thrombin. Sensors 13, 13425–13438 (2013). [DOI] [PMC free article] [PubMed] [Google Scholar]
- Kaur H. & Yung L.-Y. L. Probing high affinity sequences of DNA aptamer against VEGF165. PloS One 7, e31196 (2012). [DOI] [PMC free article] [PubMed] [Google Scholar]
- Freeman R. et al. Optical aptasensors for the analysis of the vascular endothelial growth factor (VEGF). Anal. Chem. 84, 6192–6198 (2012). [DOI] [PubMed] [Google Scholar]
- Xiao Y. et al. Catalytic beacons for the detection of DNA and telomerase activity. J. Am. Chem. Soc. 126, 7430–7431 (2004). [DOI] [PubMed] [Google Scholar]
- Nishikawa M. Reactive oxygen species in tumor metastasis. Cancer Lett. 266, 53–59 (2008). [DOI] [PubMed] [Google Scholar]
- Bergers G. & Hanahan D. Modes of resistance to anti-angiogenic therapy. Nat. Rev. Cancer 8, 592–603 (2008). [DOI] [PMC free article] [PubMed] [Google Scholar]
- Saharinen P., Eklund L., Pulkki K., Bono P. & Alitalo K. J. VEGF and angiopoietin signaling in tumor angiogenesis and metastasis. Trends Mol. Med. 17, 347–362 (2011). [DOI] [PubMed] [Google Scholar]
- Huh D. et al. Reconstituting organ-level lung functions on a chip. Science 328, 1662–1668 (2010). [DOI] [PMC free article] [PubMed] [Google Scholar]
- Baumann K. Development: Growing a blood vessel network. Nat. Rev. Mol. Cell Bio. 14, 127–127 (2013). [DOI] [PubMed] [Google Scholar]
- Raja R. et al. Hypoxia-driven osteopontin contributes to breast tumor growth through modulation of HIF1α-mediated VEGF-dependent angiogenesis. Oncogene 33, 2053–2064 (2013). [DOI] [PubMed] [Google Scholar]
- Xia C. et al. Reactive oxygen species regulate angiogenesis and tumor growth through vascular endothelial growth factor. Cancer Res. 67, 10823–10830 (2007). [DOI] [PubMed] [Google Scholar]
- Ray P. D., Huang B.-W. & Tsuji Y. Reactive oxygen species (ROS) homeostasis and redox regulation in cellular signaling. Cellular Signal. 24, 981–990 (2012). [DOI] [PMC free article] [PubMed] [Google Scholar]
- Travascio P., Witting P. K., Mauk A. G. & Sen D. The peroxidase activity of a hemin-DNA oligonucleotide complex: free radical damage to specific guanine bases of the DNA. J. Am. Chem. Soc. 123, 1337–1348 (2001). [DOI] [PubMed] [Google Scholar]
- David R. Development: A good hair day for ROS. Nat. Rev. Mol. Cell Bio. 14, 194–195 (2013). [PubMed] [Google Scholar]
- Raj L. et al. Selective killing of cancer cells by a small molecule targeting the stress response to ROS. Nature 475, 231–234 (2011). [DOI] [PMC free article] [PubMed] [Google Scholar] [Retracted]
- Circu M. L. & Aw T. Y. Reactive oxygen species, cellular redox systems, and apoptosis. Free Radical Bio. Med. 48, 749–762 (2010). [DOI] [PMC free article] [PubMed] [Google Scholar]
- Bracken C. P. et al. Cell-specific regulation of hypoxia-inducible factor (HIF)-1α and HIF-2α stabilization and transactivation in a graded oxygen environment. J. Biol. Chem. 281, 22575–22585 (2006). [DOI] [PubMed] [Google Scholar]
- Papandreou I., Cairns R. A., Fontana L., Lim A. L. & Denko N. C. HIF-1 mediates adaptation to hypoxia by actively downregulating mitochondrial oxygen consumption. Cell Metab. 3, 187–197 (2006). [DOI] [PubMed] [Google Scholar]
- Holmquist-Mengelbier L. et al. Recruitment of HIF-1α and HIF-2α to common target genes is differentially regulated in neuroblastoma: HIF-2α promotes an aggressive phenotype. Cancer Cell 10, 413–423 (2006). [DOI] [PubMed] [Google Scholar]
- Newby D., Marks L. & Lyall F. Dissolved oxygen concentration in culture medium: Assumptions and pitfalls. Placenta 26, 353–357 (2005). [DOI] [PubMed] [Google Scholar]
- Matsue T., Ching-Chou W., Yasukawa T. & Shiku H. Fabrication of miniature Clarkoxygen sensor integrated with microstructure. Sensors and Actuators B 110, 342–349 (2005). [Google Scholar]
Associated Data
This section collects any data citations, data availability statements, or supplementary materials included in this article.
Supplementary Materials
Supplementary Information
Supplementary Video 1
Supplementary Video 2
Supplementary Video 3


