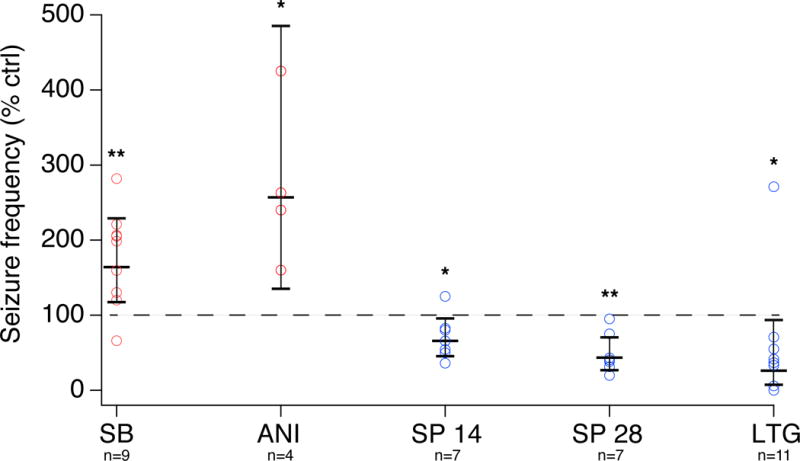
Fig. 5.

Summary of treatment results. Shown is the ratio of seizure frequency as a percentage of baseline frequency for each animal (circles), with treatments that on average were proconvulsive depicted in red and those that were antiepileptic in blue. Mean and 95% CIs for each group are shown, along with statistical significance level of the change in seizure frequency (* = p<.05; ** = p<.01).
