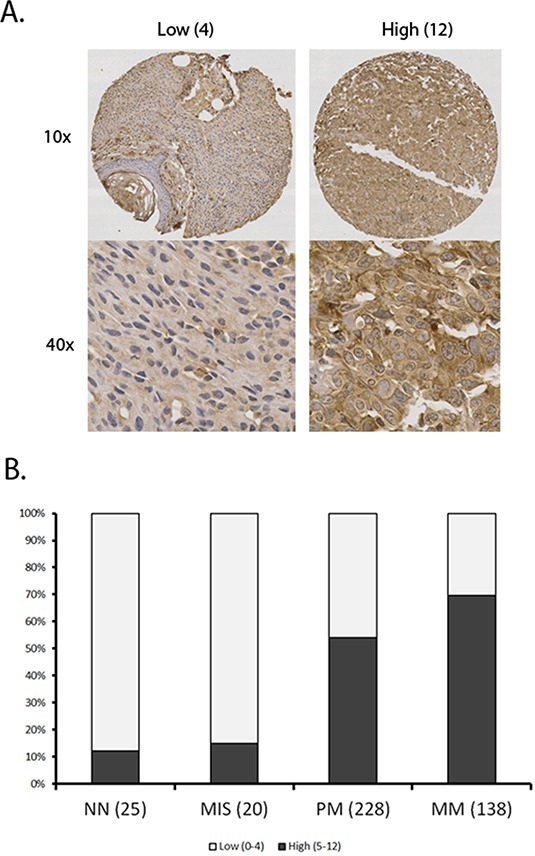
Figure 1. Summary of SERPINA3 staining data in various kinds of melanocytic tumor.

A tissue microarray was stained using immunohistochemistry and scanned. All samples were scored using a previously described 12 point scale involving intensity and percentage of melanoma cells showing staining for SERPINA3 (see materials and methods). Panel A. Representative images of tissues with high and low scores. Panel B. Increased SERPINA3 expression correlates with progression of melanoma. Sample sizes of each group are shown in bracket. A marked increase in percentage of samples with high SERPINA3 expression was shown between MIS and PM (P < 0.0001) and further between PM and MM (p<0.0001). NN, Normal nevi; MIS, Melanoma in situ; PM, Primary melanoma; MM, metastatic melanoma.
