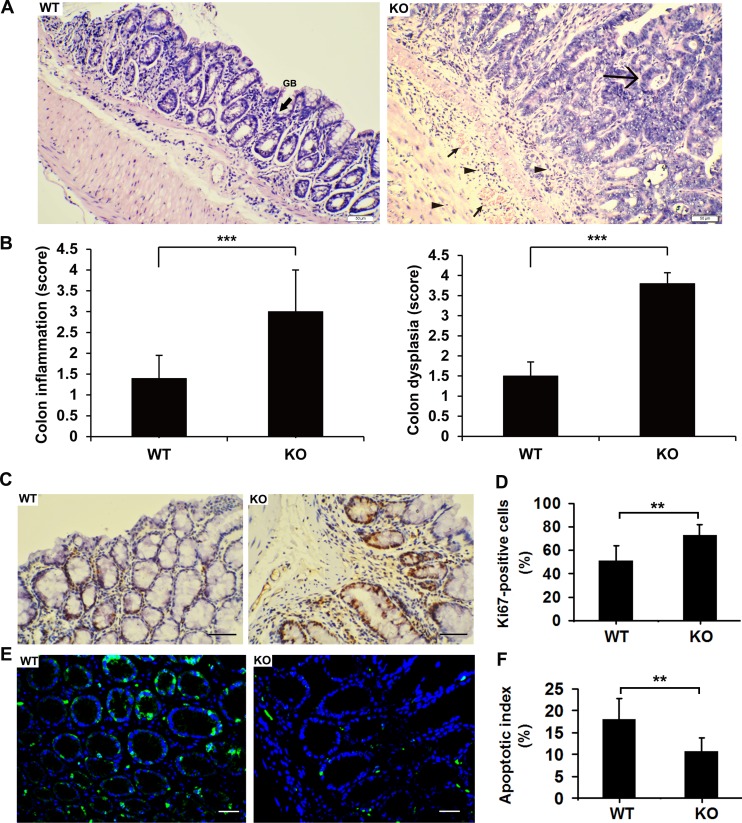
Figure 3. Enhanced tumorigenesis and intestinal inflammation in Adamts18 KO mice.
(A) Hematoxylin and eosin (HE) staining of representative colonic sections. Left panel, colonic sections of WT mice after AOM/DSS treatment. GB, refers to goblet cells (black arrow sign). Right panel, marked histopathological changes were seen in colonic sections of Adamts18 KO mice characterized by severe dysplasia in the mucosa with loss of the gland structures (large arrow sign), inflammatory cell infiltrate around the crypt base and diffuse into the submucosa (small triangle arrows) as well as submucosa congestion (small arrow sign) when compared to WT littermates. (B) Histological inflammation and dysplastic scores determined by specialist in a double-blind fashion as described in methods. (C-D) Ki-67 immunohistochemistry staining (C) and percentage of Ki-67-positive cells (D). (E–F) Tumor cell apoptosis was assessed using TUNEL apoptosis detection kit (green). DAPI (blue) indicates nucleus. TUNEL, TdT-mediated dUTP nick end labeling; DAPI, 4, 6-diamidino-2-phenylindole. Scale bar = 50 μm. Columns mean; bars, SD (**P < 0.01; ***P < 0.001). These experiments are repeated independently at three times.

