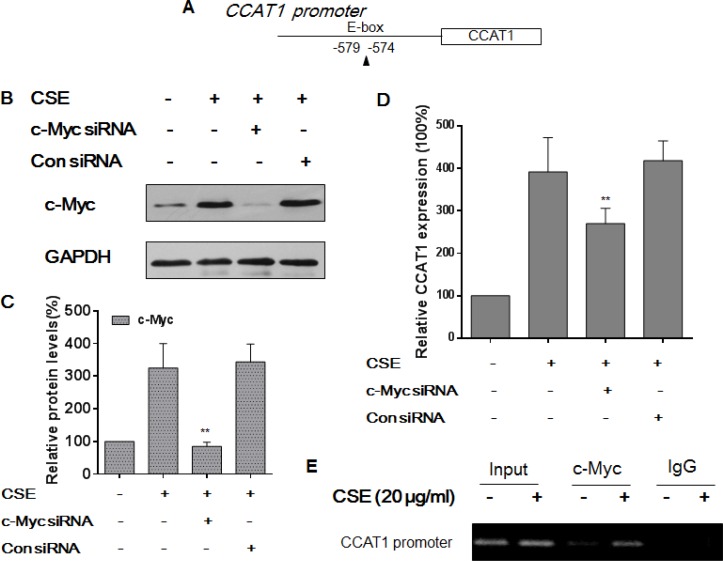
Figure 3. c-Myc regulates CCAT1 expression by binding to the promoter of CCAT1 in HBE cells.
Densities of bands were quantified by Eagle Eye II software. GAPDH levels, measured in parallel, served as controls. (A) Schematic graph illustrating binding sites of c-Myc in the promoter of CCAT1. HBE cells were exposed to CSE (0 or 20 μg/mL) in the absence or presence of 100 ppm c-Myc siRNA or control siRNA for 24 h. (B) Western blots and (C) relative protein levels (means ± SD, n = 3) of c-Myc were determined. (D) The levels (means ± SD, n = 3) of CCAT1 were determined by quantitative RT-PCR. **P < 0.05, different from CSE-treated HBE cells in the absence of the c-Myc siRNA. HBE cells were exposed to CSE (0 or 20 μg/mL) for 24 h. (E) the binding of c-Myc to promoters of CCAT1 was measured by a ChIP assay after chromatin was immunoprecipitated with an antibody against c-Myc.

