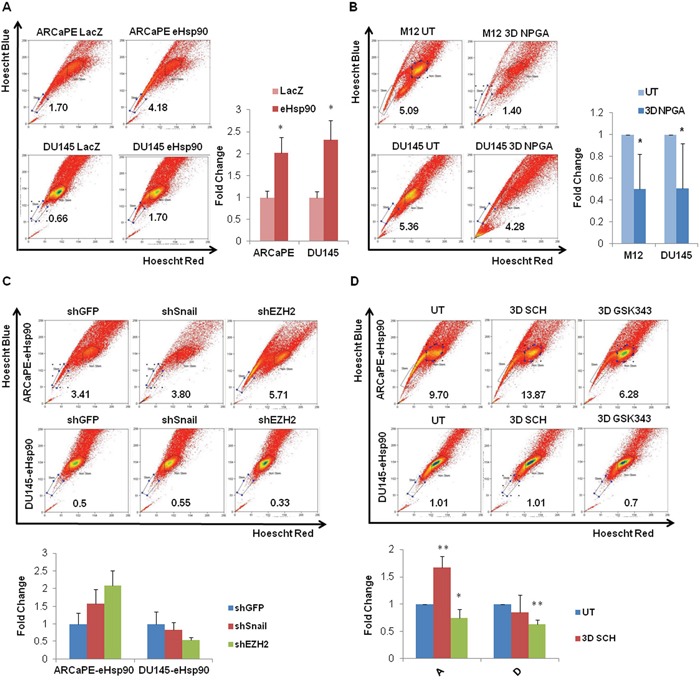
Figure 4. eHsp90 increases the side population in part through an EZH2 dependent pathway.

A. Representative flow cytometry scatter plots for the side population of ARCaPE-LacZ relative to ARCaPE-eHsp90 and DU145-LacZ relative to DU145-eHsp90 are shown, along with graphs demonstrating the results of the combined analysis of replicate assays. B. Representative flow cytometry scatter plots for the side population of M12 and DU145, each treated with 1 uM NPGA for 3 days. Comparisons included eHsp90-expressing cells relative to the matched LacZ control (A) or drug treated relative to untreated control cells (B). Shown are quantified results of the combined analysis of replicate assays. C. Representative flow cytometry scatter plots for the side population of ARCaPE-eHsp90 and DU145-eHsp90, each stably transduced with plasmids encoding shGFP (vector control), shSnail or shEZH2 are shown, along with graphs demonstrating the results of the combined analysis of replicate assays. D. Representative flow cytometry scatter plots for the side population of ARCaPE-eHsp90 and DU145-eHsp90 treated with 100 nM SCH or 500 nM GSK343 over a 3 day period are shown, along with graphs demonstrating the results of the combined analysis of replicate assays. Comparisons included eHsp90-expressing cells relative to the matched LacZ control. As indicated, eHsp90-expressing shRNA cell derivatives were compared relative to matched shGFP transduced cells (C), while eHsp90-expressing drug treated cells were compared to matched untreated controls (D). All statistics were performed using the Student's t-test. * = p<0.05, ** p<0.01.
