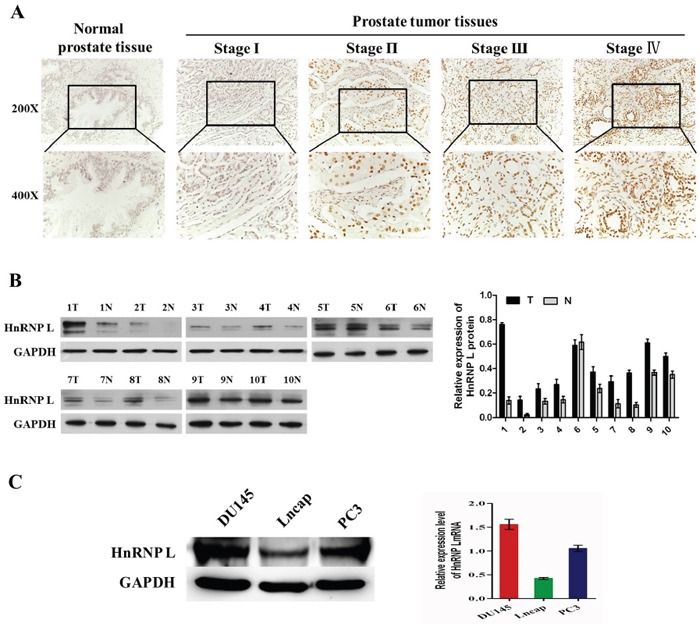
Figure 1. HnRNP L is upregulated in prostate cancer.

A. Expression of HnRNP-L in a tissue microarray containing several prostate cancer and non-prostate cancer tissues (n=192). Representative images of HnRNP-L in Normal and Pca specimens examined by IHC. HnRNP-L was positively detected in Pca tissues (stage I-IV), while it was only weakly or negatively detected in non-prostate cancer tissues. B. Expression of HnRNP-L protein in each of the primary PCA (T) and adjacent noncancerous tissues (N) paired from the same patient by western blotting (left) (n=10). The protein expression levels were quantified by comparing the gray level of each band using Quantity One Software. C. Western blotting (left) and Real-time PCR (right) show the expression levels of HnRNP-L in DU145, Lncap, PC3 cell lines.
