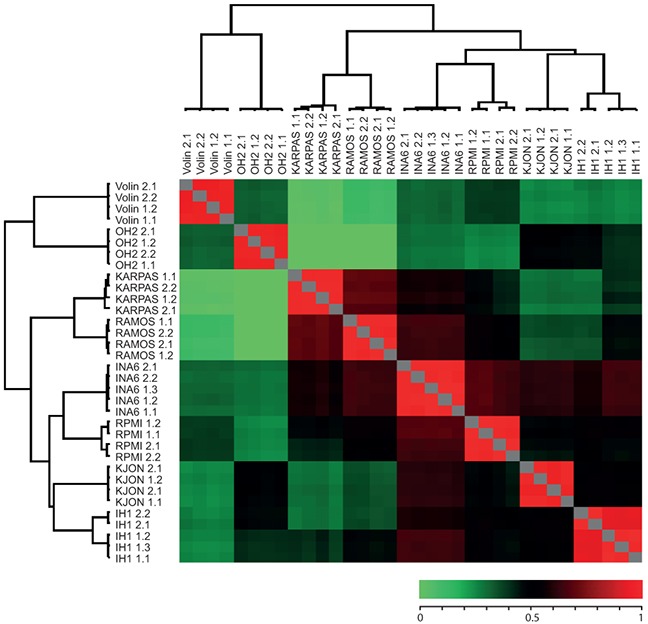
Figure 2. Heat map of Pearson showing reproducibility between replicates as well as similarity between certain cell lines.

Numbers succeeding each cell line indicate biological and technical replicates. The color bar represent the corresponding correlation coefficients.
