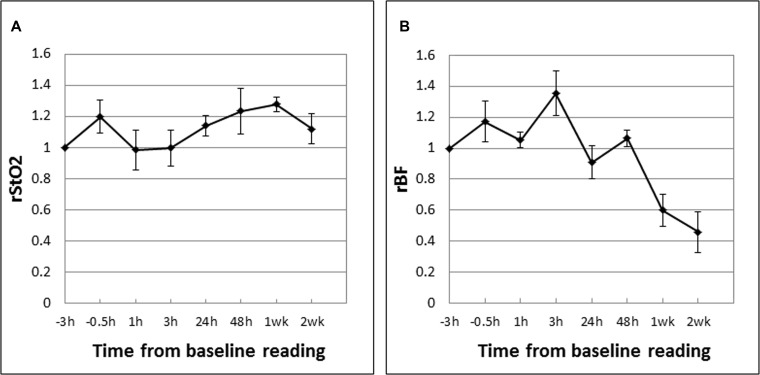
Figure 4.
Mean tumor rStO2 (A) and rBF (B) values in drug-only control tumors (DC; n = 5) expressed as ratios of the baseline readings measured before Ce6 administration at “−3 h”. The standard errors of the mean are presented as error bars. The rStO2 and rBF values fluctuated above the baseline value (up to +35%) during the first 48 hours. The large decrease in rBF at 1 week (−40%) and 2 weeks (−55%) may be due to more “tortuous” tumor vasculature that restricted blood flow as the tumors grew larger (see Figure 6).

