Abstract
The product of the intronless single copy gene RSC1A1, named RS1, is an intracellular 617-amino-acid protein that is involved in the regulation of the Na+-d-glucose cotransporter SGLT1. We generated and characterized RS1 knockout (RS1−/−) mice. In the small intestines of RS1−/− mice, the SGLT1 protein was up-regulated sevenfold compared to that of wild-type mice but was not changed in the kidneys. The up-regulation of SGLT1 was posttranscriptional. Small intestinal d-glucose uptake measured in jointly perfused small bowel and liver was increased twofold compared to that of the wild-type, with increased peak concentrations of d-glucose in the portal vein. At birth, the weights of RS1−/− and wild-type mice were similar. At the age of 3 months, male RS1−/− mice had 5% higher weights and 15% higher food intakes, whereas their energy expenditures and serum leptin concentrations were similar to those of wild-type mice. At the age of 5 months, male and female RS1−/− mice were obese, with 30% increased body weight, 80% increased total fat, and 30% increased serum cholesterol. At this age, serum leptin was increased, whereas food intake was the same as for wild-type mice. The data suggest that the removal of RS1 leads to leptin-independent up-regulation of food intake, which causes obesity.
Glucose absorption in the small intestine is essential for energy supply through carbohydrates. It is mediated by two transporters in the enterocytes, the sodium-dependent d-glucose cotransporter SGLT1 in the brush border membrane and the sodium-independent glucose transporter GLUT2 in the basolateral membrane (11). Na+-d-glucose cotransporter expression and activity in the small intestine exhibits circadian periodicity and is increased following a carbohydrate-rich diet (5, 27). The regulation of SGLT1 can be mediated by adrenergic innervation, insulin, glucagon 37, glucagon-like peptide 2, and cholecystokinin (2, 13, 14, 29, 30). SGLT1 may be regulated by changes in transcription (23, 35), mRNA stability (21), endocytosis (12), and transport activity within the plasma membrane (34).
Previously, several related 67-kDa polypeptides from humans, pigs, and rabbits, termed RS1, which show about 70% amino acid identity and are involved in the regulation of SGLT1, were cloned (17, 18, 26, 36). The RS1 polypeptides are encoded by intronless single copy genes (RSC1A1 on chromosome 1p36.1 in humans). These genes are expressed in many cell types, including small intestinal enterocytes and renal proximal tubular cells (18, 26, 36). RS1 contains consensus sequences for protein kinase C and casein kinase II and a ubiquitin-associated domain that is conserved between different species (33). The RS1 protein is localized intracellularly and associated with the plasma membrane (33).
Coexpression experiments with Xenopus laevis oocytes showed that human RS1 (hRS1) is involved in posttranscriptional down-regulation of hSGLT1 (18, 26, 36, 37). The down-regulation of hSGLT1 by hRS1 was dynamin dependent and increased by activation of protein kinase C (PKC) (37). Remarkably, RS1 also inhibited the transcription of SGLT1 (17). In the renal epithelial cell line LLC-PK1, where endogenous SGLT1 is up-regulated after confluence, the transcription of SGLT1 was increased 10-fold when the concentration of endogenous RS1 was reduced via an antisense strategy (17).
To elucidate the biological significance of RS1 in vivo, we generated a knockout mouse lacking the RS1 protein via homologous recombination in embryonic stem cells. RS1−/− mice develop obesity with increased expression of SGLT1 and enhanced glucose absorption in the small intestine.
MATERIALS AND METHODS
Animals.
Mice were handled in compliance with institutional guidelines and German laws. RS1−/− and wild-type mice on a 129/OLA/C57BL/6 background or a C57BL/6 background were compared. Comparisons were performed either between animals from the same litters after backcrossing with C57BL/6J between the 5th and 9th generations or between animals of mixed litters after the 10th backcrossing. Animals were kept in a temperature-controlled environment with a 12-h-light-12-h-dark cycle. They received standard chow (Altromin GmbH, Large-Lippe, Germany) and water ad libitum.
Materials.
Peroxidase-conjugated goat anti-rabbit immunoglobulin G (IgG) antiserum, alkaline phosphatase-coupled goat anti-rabbit IgG F(ab′)2 antiserum, m-maleimidobenzoyl-N-hydroxysuccimide, and amylogucosidase were obtained from Sigma (Munich, Germany). Indocarbocyanin (Cy3)-conjugated goat anti-rabbit IgG F(ab′)2 antiserum was from Dianova GmbH (Hamburg, Germany), and human insulin (>27.5 USP U per mg) was from ICN Biochemicals (Meckenheim, Germany). Affinity-purified antibodies against rat GLUT2 that cross-reacts with mouse GLUT2 were obtained from Alpha Diagnostic International (San Antonio, Tex.). An enzyme-linked immunosorbent assay (ELISA) for quantification of mouse leptin was supplied by Diagnostic Systems Laboratories (Sinsheim, Germany), and an ELISA for quantification of mouse insulin was supplied by CrystalChem (Chicago, Ill.).
Cloning and transfection of embryonic stem cells.
A fragment of mouse RS1 (mRS1) was cloned from mouse kidney cDNA. The degenerate primers 5′-AATCC(G/C)(C/T)T(A/G)ATGGAAGT(A/G)GA-3′ (forward, position 1099 to 1118 on porcine RS1 [pRS1], accession number X64315) and 5′-GCTTCCTGCAA(A/G)GT(A/G)AAGCC-3′ (reverse, position 2027 to 2008 on pRS1) were used. With this fragment, we screened a bacterial artificial chromosome mouse genomic library (Genome Systems, St. Louis, Mo.). The mRS1 gene with 5′- and 3′-flanking regions was localized on a 120-kb insert and completely sequenced on both strands. To create the replacement target vector, we cloned the 3′-flanking region of mRS1 (1.5-kb HindIII/NheI fragment) into the filled NotI/XhoI sites of the vector pPNT (32) and inserted the 5′-flanking region of RS1 (5.4-kb XhoI/NheI fragment) into the mung bean nuclease-treated KpnI site of this vector. In the resulting targeting vector (Fig. 1a), the complete RS1 coding region is replaced by the neomycin resistance gene that was introduced in the opposite direction compared to the flanking regions of mRS1. The target vector was linearized by NotI, and embryonic stem cells (129/OLA) were transfected by electroporation (400 V, 250 μF). Geneticin (G418)-resistant cells were analyzed by Southern hybridization and PCR. Cells with recombinant alleles were introduced into blastocysts of C57BL/6J mice to generate germ line chimeras.
FIG. 1.
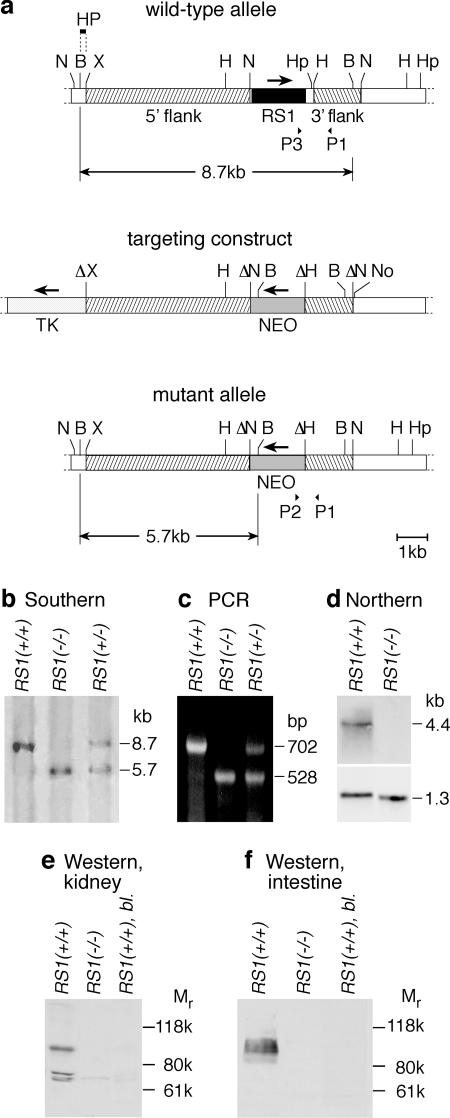
Generation of the RS1 knockout mouse. (a) Targeted deletion of the RS1 gene. The wild-type allele of the RS1 gene, a fragment of the targeting construct with the thymidine kinase gene (TK) and the neomycin cassette (NEO), and the mutant allele are shown. N, NheI; B, BamHI; X, XhoI; H, HindIII; Hp, HpaI; No, NotI. The 200-bp BamHI/XhoI fragment of RS1 (HP) was used as the 5′ probe for Southern hybridization. For the wild-type allele, this probe detects an 8.7-kb BamHI fragment. After homologous recombination, a 5.7-kb BamHI fragment characteristic for the mutant allele is detected. P1, P2, and P3 represent primers that were used for genomic PCR. (b) Southern analysis of genomic DNA from RS1+/+, RS1−/−, and RS1−/+ mice. Genomic BamHI-digested DNA was hybridized with the probe (HP) indicated in panel a, showing the characteristic bands for thewild-type (8.7 kb) and mutant (5.7 kb) alleles. (c) PCR analysis with genomic DNA and primers P1, P2, and P3 as indicated in panel a. Polynucleotides with 702 bp (primers P1 and P3) and 528 bp (primers P1 and P2) were amplified from RS1+/+ and RS1−/− mice, respectively. (d) Expression of RS1 mRNA in kidneys of RS1+/+ and RS1−/− mice. The Northern blots were performed with 5 μg of mRNA per lane, with a cRNA fragment of RS1 as a probe. Hybridization of GAPDH was performed to control loading of the gel. (e) Immunodetection of RS1 protein in kidneys of RS1+/+ and RS1−/− mice with an affinity-purified antibody against mRS1. Per lane, 20 μg of protein of renal brush border membranes was applied. The specificity of the immunoreaction with the wild type was verified by blocking antibody against mRS1 with antigenic peptide (RS1+/+, bl.). (f) Immunodetection of RS1 protein in the small intestines of RS1+/+ and RS1−/− mice. PME fractions of small intestine were analyzed. The experiment was performed as described for panel e.
Southern analysis, genomic PCR, and Northern analysis.
Genomic DNA was digested with BamHI and hybridized with a 200-bp-long BamHI/XhoI fragment from the 5′ end of RS1 (Fig. 1a and b). For genotyping by PCR, primers were derived from the noncoding 3′ end of mRS1 (P1, 5′-CCCCACACCCTTCCCATGGTCATGA-3′; reverse, position 2367 to 2391), from the open reading frame of mRS1 (P3, 5′-GGGAATGCAGACCTTGCCCTTCTTG-3′; forward, position 1689 to 1713), and from the neomycin gene of the pPNT vector (P2, 5′-CCACTTGTGTAGCGCCAAGTGCCAG-3′; reverse, position 93 to 117) (Fig. 1a and c).
Northern blotting was performed with the following radioactively labeled polynucleotide probes: mRS1 (nucleotides [nt] 934 to 1234, GenBank accession no. Y11917), mouse SGLT1 (nt 1 to 315, GenBank accession no. AF163846), mouse GLUT2 (nt 1580 to 1863, GenBank accession no. X15684), mouse stearoyl coenzyme A (stearoyl-CoA) desaturase 1 (SCD1, nt 457 to 836, GenBank accession no. AF509567), and human glyceraldehyde-3-phosphate dehydrogenase (GAPDH, 1.1-kb fragment; Clontech, Heidelberg, Germany).
Generation of antibodies and immunodetection on Western blots.
Polyclonal antibodies against peptides of mRS1 (mRS1-Ab, amino acids 436 to 454, GLSPDREDVRRSTESARKS) and mouse SGLT1 (mSGLT1-Ab, amino acids 586 to 601, KDTIEIDTEAPQKKKG) were raised in rabbits. Peptides with a C-terminal cysteine were coupled to ovalbumin with m-maleimidobenzoyl-N-hydroxysuccimide ester. Affinity purification of the antisera was performed on the antigenic peptides coupled to polyacrylamide beads by using the Sulfolink kit from Pierce (Bonn, Germany). Renal brush border membrane purification, protein determination, sodium dodecyl sulfate-polyacrylamide gel electrophoresis, protein transfer, and immunodetection were performed as described earlier (33). To prepare a plasma membrane-enriched (PME) fraction, the small intestine was homogenized at 4°C in 20 mM Tris-HCl (pH 7.5), 250 mM sucrose, 5 mM EGTA, and 5 mM MgSO4 containing protease inhibitors (17). After 10 min of centrifugation at 2,000 × g, the supernatant was centrifuged for 60 min at 40,000 × g and the PME fraction was collected as a pellet. To test the immunoreactions for specificity, the primary antibodies were preabsorbed for 1 h at 37°C with 100 μg of the respective antigenic peptide/ml.
Immunofluorescence.
The small intestines or kidneys from mice were rapidly frozen in liquid isopentane cooled in liquid nitrogen and sectioned in a cryostat. Five-micrometer-thick cryosections were thawed on silanized glass slides and fixed for 5 min at room temperature in phosphate-buffered saline (PBS) containing 4% (wt/vol) paraformaldehyde. The sections were washed with PBS containing 0.05% (wt/vol) Tween 20 (PBS-T), and nonspecific binding sites were blocked for 30 min with PBS containing 0.1% (wt/vol) Triton X-100 plus 2% (wt/vol) skim milk powder (blocking buffer). Incubation with affinity-purified primary antibodies dissolved in blocking buffer was performed for 16 h at 4°C. After washing with PBS-T, bound antibody was labeled for 1 h at room temperature with PBS-T containing 1:2,000-diluted Cy3-conjugated goat anti-rabbit IgG F(ab′)2 antiserum. After washing with PBS-T, the sections were embedded in fluorescent mounting medium (DAKO Diagnostik GmbH, Hamburg, Germany) that contained 4′,6′-diamidino-2-phenylindole (DAPI) for staining of nuclei. To test for specificity, primary antibodies were preabsorbed for 1 h with 100 μg of the respective antigenic peptides/ml. Fluorescence microscopy and laser scanning confocal fluorescence microscopy were performed on Axiophot 2 and LSM 510 microscopes, respectively (Zeiss, Jena, Germany).
Determination of body composition and estimation of fat cell size.
To determine total fat mass, water content, and dry mass, mice were killed, weighed, dried for 5 days at −90°C, and weighed again. For lipid extraction, each dried mouse was homogenized in 300 ml of chloroform-methanol (3:1). The lipid-free dry tissue was filtered, dried, and weighed. To estimate the size of fat cells, fat tissue was fixed with glutaraldehyde (2.5% vol/vol), formaldehyde (2% vol/vol), and OsO4 (2% wt/vol), embedded in Epon 812, semithin sectioned (0.5 μm), examined by electron microscopy, and photographed. The cross-sectional areas of fat cells from RS1+/+ and RS1−/− mice were compared by using an overlaid grid. For a comparison of fat cell volumes, the relative cross-sectional areas were transformed to relative volumes by assuming a spherical shape of the fat cells.
Analysis of food consumption, energy balance, energy expenditure, and motor activity.
Feeding experiments were performed with mice that were supplied continuously with a standard chow ad libitum and had free access to water. Food uptake and body weight were determined daily. The energy balance was established by measuring the energy content of food and feces by bomb calorimetry. The energy expenditure of individual mice was measured using indirect calorimetry (15). Oxygen consumption and CO2 production were determined every 6 min in an open respiratory system, and energy expenditure was calculated according to the method of Weir (38). The respiratory quotient is carbon dioxide produced divided by oxygen consumed. Motor activity was determined in cages with running wheels in which revolutions were counted irrespective of direction.
Analytical determinations.
The d-glucose concentration was determined with glucose dehydrogenase (29). Concentrations of triglycerides, cholesterol, and high- and low-density lipoproteins were measured enzymatically (Roche GmbH, Mannheim, Germany). Free fatty acids and glycerin were determined by enzymatic tests from Randox GmbH (Crumlin, United Kingdom), leptin was determined by an ELISA from Diagnostic Systems Laboratories, and insulin was determined by an ELISA from CrystalChem. For glycogen determination, individual livers were homogenized in 0.6 N HClO4, glycogen was hydrolyzed with amyloglucosidase at pH 4.8, and the concentration of d-glucose was determined.
Measurement of glucose tolerance and insulin tolerance.
Mice were starved for 16 h overnight but had access to water. At 10 a.m., body weights and basal d-glucose concentrations in serum were determined. Then a plastic tube was introduced into the esophagus, and 2.5 mg of d-glucose per g of body weight, dissolved as a 1.1 M solution in water, was applied within 1 min. Ten, 20, 60, and 120 min later, blood samples were taken from the tail vein and analyzed for d-glucose and insulin. Insulin tolerance was tested by observing the blood glucose level for 2 h after intraperitoneal injection of 1 USP U of insulin per g of body weight.
Determination of intestinal glucose absorption.
d-Glucose absorption from the small bowel was measured during a nonrecirculating joint perfusion of the isolated small bowel and liver. These organs were perfused via the coeliac trunk and the superior mesenteric artery (SMA), and intestinal glucose absorption was determined from the increase of portal glucose concentration and the calculated portal flow rate. The experiments were carried out as described previously (28, 29). After anesthesia with pentobarbital, the abdomen was opened. A cannula was introduced into the SMA, the inferior vena cava was cut open, and perfusion of the intestine and liver was started at a hydrostatic pressure of 120 cm of H2O and a flow rate of 8 ml/min. The perfusion solution was Krebs-Henseleit buffer (pH 7.4) supplemented with 5 mM d-glucose, 2 mM lactate, 0.2 mM pyruvate, 1 mM glutamine, 3% (wt/vol) dextran, and 1% (wt/vol) bovine serum albumin. It was equilibrated with a gas mixture of O2/CO2 (19:1). Another cannula was introduced into the thoracic aorta, positioned close to the outlet of the coeliac trunk, and also perfused with perfusion solution (120 cm of H2O, 5 ml/min). For intestinal application of glucose, a catheter was placed in the duodenal lumen. The cecum was incised, and the intestinal content was washed out with warmed saline. Two flexible catheters were introduced into the portal vein: one to collect samples for the determination of d-glucose concentrations and the other for infusion of insulin. Finally, the intestine and liver were excised and transferred into warmed saline. After 20 min of preperfusion, 0.25 ml of saline containing 100 mg of d-glucose was infused within 1 min into the duodenum. Every minute thereafter, samples were collected from the portal vein. The flow rates in the SMA, coeliac trunk, and inferior vena cava were determined, and the flow rate in the portal vein was estimated as described previously (29). The intactness of each preparation was verified as described previously (29).
Statistical analysis.
The band intensity on Northern blots and Western blots was quantified by densitometry (17). Values are given as means ± standard errors of the means. Unpaired Student's t test was used to assess differences between mean values. Linear regression was performed with PRISM (GraphPad software, Inc., San Diego, Calif.).
RESULTS
Cloning of RS1 from mouse.
The mRS1 gene (GenBank accession number Y11917) was intronless and contained an open reading frame coding for 582 amino acids (aa). The amino acid sequence of mRS1 was 58, 57, and 54% identical to hRS1, pRS1, and rabbit RS1, respectively (18, 26, 36). It contained a C-terminal consensus sequence for a ubiquitin-associated domain that is conserved in the four species. This domain included two conserved dileucine motifs (aa 570 and 571 and aa 573 and 574) and a conserved consensus sequence of casein kinase II (aa 551). Moreover, mRS1 contained conserved consensus sequences for phosphorylation by casein kinase II (aa 111 and 329) and for phosphorylation by protein kinase C (aa 351 and 381).
Targeted disruption of RS1.
The coding region of the mRS1 gene was replaced by an inverted neomycin cassette via homologous recombination in embryonic stem cells (Fig. 1a). From two independent clones, mice with a targeted mutation of mRS1 were generated as determined by Southern analysis and PCR on genomic DNA (Fig. 1b and c). Northern blots on kidney mRNA demonstrated the complete absence of RS1 mRNA in RS1−/− animals (Fig. 1d). Consistently, on Western blots performed with renal brush border membranes (Fig. 1e) or with a PME fraction isolated from the small intestine (Fig. 1f), no mRS1 protein could be detected in RS1−/− mice. In reducing sodium dodecyl sulfate-polyacrylamide gel electrophoresis, mRS1 protein showed an atypically slow migration at about 100 kDa, as observed previously for RS1 proteins of other species (17, 33).
Distribution of mRS1 protein in small intestine of wild-type mice.
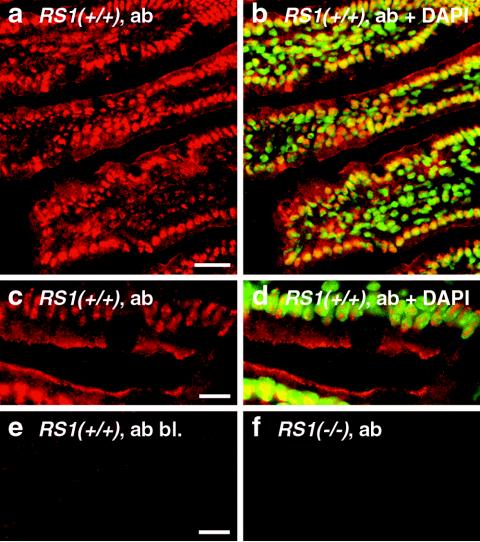
Affinity-purified peptide antibody directed against mRS1 was used to determine the localization of mRS1 in the small intestine. Figure 2a to d shows that RS1 was expressed in epithelial and subepithelial cells. In both cell types, mRS1 was localized within the nuclei. In small intestinal enterocytes, mRS1 was also localized below the plasma membrane. The immunoreaction could be blocked with antigenic peptide (Fig. 2e) and was not observed in RS1−/− mice (Fig. 2f).
FIG. 2.
Distribution of RS1 protein in the small intestines of C57BL/6J wild-type mice. Cryosections of the jejunum from 5-month-old RS1+/+ mice (a to e) and RS1−/− mice (f) were fixed with paraformaldehyde and incubated with affinity purified RS1 antibody (ab). The immunoreaction was visualized with Cy3-coupled secondary antibody against rabbit IgG F(ab′)2 (red fluorescence). Nuclei were counterstained with DAPI (b and d) (blue fluorescence that was converted to green). In panel e, the immunoreaction was blocked with the antigenic peptide (bl.). In panels b and d, the nuclear localization of RS1 is demonstrated by colocalization of red Cy3 fluorescence of RS1 antibody and green DAPI staining of the nuclei. Colocalizations show up in yellow. Bars, 20 μm (a); 5 μm (c and e).
Phenotype of RS1−/− mice.
Heterologous crosses resulted in genotype frequencies according to Mendelian inheritance (87 RS1+/+, 211 RS1+/−, and 95 RS1−/−), indicating that embryonic viability is not reduced. RS1−/− mice were viable and fertile. The body weights of newborn RS1−/− mice of mixed gender after the 10th backcrossing was not significantly different from those of C57BL/6J wild-type mice (RS1−/− mice, 1.37 ± 0.0.01 g, n = 163; RS1+/+ mice, 1.39 ± 0.02 g, n = 49). However, with 3-month-old females, body weights of 21.9 ± 0.3 g and 25.9 ± 1.1 g (n = 12 each, P < 0.001) were measured for RS1+/+ and RS1−/− mice, respectively. For 3-month-old males, the difference in body weight was smaller than for females. The body weights were 28.3 ± 0.2 g (RS1+/+) and 29.8 ± 0.3 g (RS1−/−) (n = 6 each, P < 0.01).
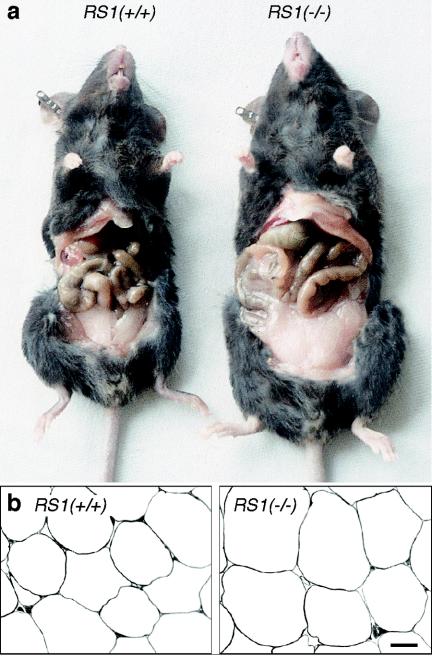
At the age of 5 months, the body weights of female RS1+/+ and RS1−/− mice were 22.4 ± 0.3 g and 29.2 ± 0.4 g, respectively (n = 30 each, P < 0.001). Similar results were obtained with 5-month-old male mice, indicating no gender differences for the effect of RS1 on body weight at this age (RS1+/+ mice, 32.3 ± 0.9 g; RS1−/− mice, 38.2 ± 0.9 g; n = 10 each, P < 0.01). Five-month-old RS1−/− mice were bigger than wild-type mice and showed an increase in abdominal fat (Fig. 3a). In 5-month-old females (n = 5 each group), the total body mass of RS1−/− mice was increased by 25% ± 7% (P < 0.01), body water increased by 22% ± 3% (P < 0.05), dry body mass increased by 22% ± 10% (P < 0.05), fat content increased by 80% ± 34% (P < 0.05), and fat-free dried mass increased by 22% ± 13% (P < 0.05). By far, the greatest relative changes were observed in fat content; however, changes in water content and fat-free dried mass also contributed significantly to the changes in total body mass. The mean fat cell volume was estimated from electron micrographs of abdominal fat tissue (Fig. 3b). It was 40% ± 6% larger than that of wild-type mice (RS1+/+ versus RS1−/− mice, 405 versus 480 cells; 10 sections of 3 mice each, P < 0.01 for difference). This finding indicates that the increase in body fat is partially due to an increase in fat cell size.
FIG. 3.
Obesity phenotype of RS1−/− mice. (a) Appearance of wild-type and RS1−/− mice. A typical 5-month-old female C57BL/6J wild-type mouse (23.7 g) and a typical 5-month-old female RS1−/− mouse of the ninth generation of backcrossing with C57BL/6J (30.3 g) are shown. (b) Low-magnification electron micrographs of abdominal fat tissue from 5-month-old female RS1+/+ and RS1−/− mice from the same litter. Bar, 20 μm.
Food consumption, energy balance, energy expenditure, and motor activity.
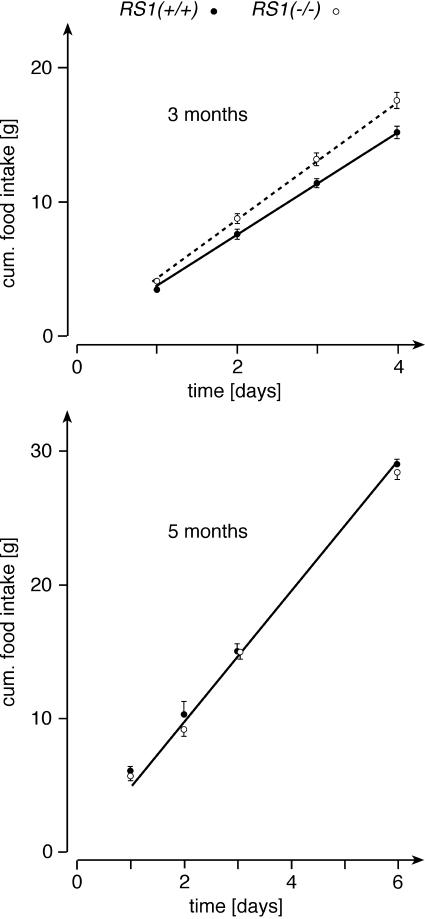
To determine whether the observed obesity can be explained by higher food intake in the RS1−/− mice, we measured food intake over a period of 4 to 6 days. During the experiments, the animals had free access to water and standard chow. Figure 4 shows results from 3- and 5-month-old male mice. At 3 months of age, RS1−/− mice showed a 15% higher cumulative food intake than RS1+/+ mice (n = 6 for each group, P < 0.01 for difference of slopes in Fig. 4). At variance, the food intake at 5 months of age was not significantly different between RS1−/− and RS1+/+ mice (n = 5 for each group). For the 3-month-old mice, we also collected feces for 4 days, measured energy contents of ingested food and feces, and determined the energy balance (Table 1). Due to 15% higher food intake of RS1−/− mice versus wild-type mice, the dry mass of the feces was slightly larger. In the feces of RS1−/− mice, the energy per dry mass was 1.5% lower than that of wild-type mice. This difference showed borderline significance (P = 0.07). It may be explained by up-regulation of intestinal d-glucose absorption in RS1−/− mice (see below). The energy balance, calculated as difference between energy contents of ingested food and feces, differed significantly between RS1−/− mice and wild-type mice (P < 0.01). RS1−/− mice retained 16.3% more energy, resulting in a borderline significant increase in body weight.
FIG. 4.
Food intake in RS1−/− mice. Groups of 3- and 5-month-old male RS1+/+ and RS1−/− mice from identical litters were compared (n = 5 or 6 for each group). Water and standard chow were supplied ad libitum. Linear regression analysis on the curves revealed significantly higher slopes for 3-month-old RS1−/− versus RS1+/+ mice (4.36 ± 0.04 versus 3.79 ± 0.04, P < 0.01 for the difference). For 5-month-old RS1−/− and RS1+/+ mice, nearly identical slopes were obtained (4.85 ± 0.13 versus 4.90 ± 0.15). cum., cumulative.
TABLE 1.
Energy balance in 3-month-old male RS1+/+ and RS1−/− micea
| RS1 genotype | Energy of ingested food (kJ) | Dry mass of feces (g) | Total energy of feces (kJ) | Energy content of feces (kJ × g−1) | Energy balance (kJ) | Changed body wt (g) |
|---|---|---|---|---|---|---|
| +/+ | 262 ± 9 | 4.8 ± 0.2 | 72 ± 3 | 15.12 ± 0.08 | 190 ± 6 | −0.4 ± 0.3 |
| −/− | 300 ± 10* | 5.3 ± 0.3 | 79 ± 4 | 14.89 ± 0.07° | 221 ± 6** | +0.2 ± 0.1° |
For 4 days, ingested food was measured, feces were collected, and changes in body weight were determined. Energy content was determined by bomb calorimetry. Energy balance represents energy of ingested food minus energy content of feces. Means ± standard errors of the means of the results for 6 animals are presented. *, P < 0.05; **, P < 0.01; °, P = 0.07.
To test whether a difference in energy consumption between RS1−/− mice and wild-type mice contributes to the development of obesity, we also measured energy consumption in the same mice that were studied in Table 1. The respiratory quotient of RS1−/− mice (0.85 ± 0.01) and RS1+/+ mice (0.84 ± 0.01) was not significantly different (n = 6 for each group). In RS1−/− mice, the energy consumption was 6.7% higher than that of wild-type mice (n = 6 for each group, P < 0.05 for difference). However, after correcting energy consumption for metabolic body mass (16), no significant difference remained (RS1−/− mice, 705 ± 10 kJ · kg−1 · day−1; RS1+/+ mice, 686 ± 15 kJ · kg−1 · day−1). In 5-month-old mice (n = 10 each group, equal proportions of males and females), we also compared motor activity between RS1−/− and wild-type mice that were fed ad libitum. Motor activity, as estimated by running wheels, was not different. Within 24 h, RS1+/+ and RS1−/− mice ran 3.30 ± 0.22 and 3.26 ± 0.23 km, respectively. The data indicate that the obesity of RS1−/− mice cannot be explained by differences in energy consumption between RS1−/− and wild-type mice.
Serum concentration of leptin.
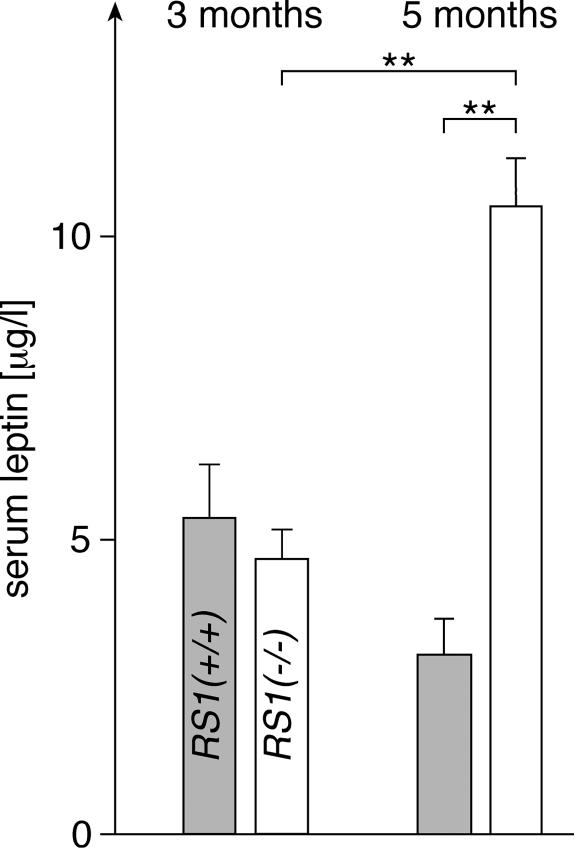
We wondered whether differences in serum leptin could explain the changed feeding behavior of 3-month-old RS1−/− versus wild-type mice. In Fig. 5, we measured the concentrations of leptin in the sera of 3- and 5-month-old male mice. To prevent variations due to individual feeding behavior, the mice were starved overnight. At the age of 3 months, similar serum leptin concentrations were measured in male RS1+/+ and RS1−/− mice. This suggests that the increased food intake in 3-month-old RS1−/− mice compared to wild-type mice is not due to a decrease of serum leptin after removal of RS1. The serum leptin concentration decreased slightly from 3 months to 5 months in RS1+/+ mice, but it increased twofold in RS1−/− mice. Since RS1−/− mice had a 30% higher body weight than and a largely increased fat mass compared to wild-type mice at 5 months of age, whereas the difference in body weight was only 5% at 3 months of age, the data suggest that the increased serum leptin concentration in 5-month-old RS1−/− mice is due an increased secretion by the larger fat mass (7, 22). The data suggest that the concentration of leptin was increased in 5-month-old mice and counteracts the higher food intake, probably the primary effect of the removal of RS1.
FIG. 5.
Serum leptin concentrations in male RS1+/+ and RS1−/− mice at the ages of 3 and 5 months. Leptin concentrations in RS1+/+ mice (grey columns) and RS1−/− mice (white columns) were determined by ELISA. The mice had unlimited access to water and were starved overnight. n = 6 (3 months) or 10 (5 months) for each group. **, P < 0.01.
Serum concentrations of d-glucose, lipids, and insulin.
Serum concentrations were determined in 5-month-old female RS1+/+ and RS1−/− mice fed ad libitum (n = 10 each group). Blood was taken 10 a.m. We found no significantly different concentrations between RS1−/− and RS1+/+ mice, respectively, for d-glucose (10.4 ± 0.6 versus 10.7 ± 0.5 mM), triglycerides (1.3 ± 0.1 versus 1.3 ± 0.1 mM), high-density lipoproteins (2.1 ± 0.1 versus 1.8 ± 0.2 mM), low-density lipoproteins (0.27 ± 0.03 versus 0.25 ± 0.02 mM), free fatty acids (0.89 ± 0.06 versus 0.82 ± 0.05 mM), glycerol (0.36 ± 0.03 versus 0.39 ± 0.02 mM), or insulin (0.55 ± 0.08 versus 0.66 ± 0.10 μg/liter). However, the serum cholesterol concentration in RS1−/− mice was significantly higher than that in wild-type mice (3.0 ± 0.2 versus 2.3 ± 0.2 mM, P < 0.05).
Glucose and insulin tolerance tests.
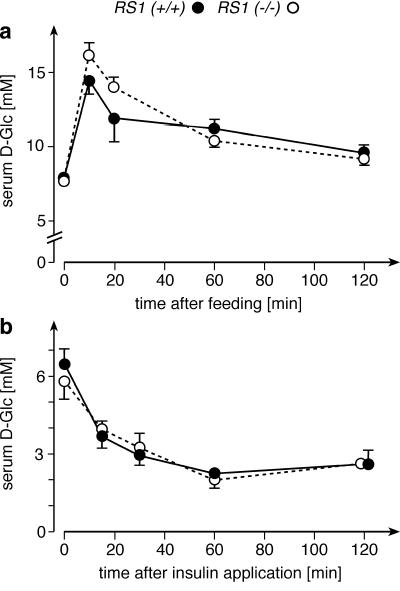
Previous in vitro experiments showed that RS1 is involved in the regulation of the Na+-d-glucose cotransporter SGLT1 (18, 37) and that intestinal glucose absorption is increased by insulin (29). Therefore, we assessed the postprandial regulation of serum d-glucose by a glucose tolerance test in 5-month-old mice that had been starved overnight (Fig. 6a). The serum concentrations of d-glucose in the morning were 7.7 ± 0.2 and 7.9 ± 0.2 mM in RS1+/+ and RS1−/− mice, respectively. A concentrated solution of d-glucose (2.5 mg of d-glucose per g of body weight) was infused into the esophagus of nonanesthetized mice. After 10 min, serum d-glucose was increased by 87% ± 12% in RS1+/+ mice and by 103% ± 11% in RS1−/− mice. Although the difference in the increase of d-glucose was not statistically significant, we considered the possibility that it could indicate a change in intestinal d-glucose absorption that was obscured by an altered glucose uptake by the liver (see next paragraph). The decrease of serum d-glucose following the postprandial d-glucose peaks was similar between RS1−/− and RS1+/+ mice. In one glucose tolerance test performed with 3-month-old male mice, we measured the changes of serum insulin in parallel with the changes of serum d-glucose. We detected no significant difference between RS1−/− and RS1+/+ mice (data not shown).
FIG. 6.
Glucose and insulin tolerance tests of RS1−/− mice. (a) The glucose tolerance test was performed with 5-month-old RS1+/+ and RS1−/− mice (n = 10 for each group, identical proportions of males and females). d-Glucose (2.5 mg per g of body weight), dissolved as a 1.1 M solution, was applied into the esophagus within 1 min, and changes in serum d-glucose concentrations were measured. (b) The insulin tolerance test was performed with 3-month-old mice (n = 6 for each group, male). One unit of insulin per gram of body weight was applied by intraperitoneal injection, and serum d-glucose concentrations were measured.
Figure 6b shows an insulin tolerance test performed with 3-month-old male mice. The animals were starved overnight, and the concentration of d-glucose in the serum was measured at beginning of the experiment. After intraperitoneal injection of insulin (1 USP U per g of body weight), serum d-glucose was measured at various time intervals. In response to insulin, RS1−/− and RS1+/+ mice showed a very similar decrease in serum d-glucose (Fig. 6b). The data exclude an increased sensitivity to insulin as the reason for the obesity of RS1−/− mice.
Measurement of small intestinal glucose absorption.
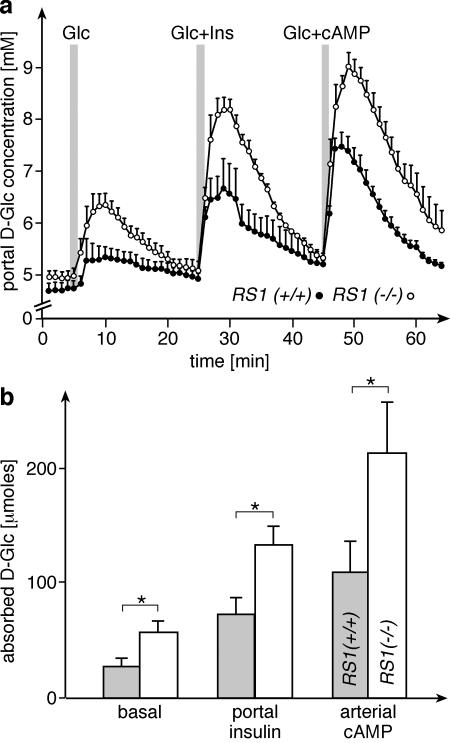
The small intestinal absorption of d-glucose was measured in a perfused ex vivo preparation of the entire small intestine and liver as previously described (28, 29). Glucose absorption by the entire small intestine was determined from the d-glucose concentration in the portal vein after infusing a bolus of 100 mg of d-glucose in 0.25 ml of saline into the duodenum (Fig. 7). Using this model in the rat, it was previously observed that small intestinal d-glucose absorption was increased by insulin applied into the portal vein (29). This up-regulation is supposed to be mediated by stimulation of parasympathetic nerves, since insulin applied into the portal vein does not reach the small intestine in this preparation. Glucose absorption was also stimulated when cyclic AMP (cAMP) was delivered to the small intestine by infusion into the SMA (28). Since up-regulation of sugar absorption by insulin and cAMP was furthermore observed exclusively for monosaccharides that are transported by SGLT1, this effect was attributed to activation of the Na+-d-glucose cotransporter SGLT1.
FIG. 7.
d-Glucose absorption in perfused total small intestines of RS1−/− mice. The measurements were performed as described in Materials and Methods (n = 5 for each group, male). At the indicated times, 100 mg of d-glucose (Glc) dissolved in 0.25 ml of saline was infused into the duodenum. During the second d-glucose administration, insulin (Ins) was provided to the liver via the portal vein. During the third application of d-glucose, cAMP was infused into the SMA. (a) d-Glucose concentrations in the portal outflow are shown; (b) cumulative amounts of absorbed d-glucose are shown, which were calculated from the increase of d-glucose concentrations in the portal outflow and volume. *, P < 0.05.
Figure 7 shows that the regulation of small intestinal d-glucose absorption by insulin and cAMP was also observed in mice. Under basal and insulin- or cAMP-stimulated conditions, the absorption of d-glucose in the small intestine was significantly higher in RS1−/− mice than in wild-type mice. Compared to wild-type mice, the total amount of absorbed d-glucose was increased in RS1−/− mice by 117% ± 43% (basal), 94% ± 13% (insulin), or 91% ± 53% (cAMP) (P < 0.05). After stimulation with cAMP, 37% of total d-glucose applied to the intestine was absorbed. The data suggest that in RS1−/− mice, the basal activity of Na+-d-glucose cotransport is increased, whereas the up-regulation of glucose absorption by insulin or cAMP is not affected by RS1.
Expression of SGLT1 and GLUT2 in mouse small intestine.
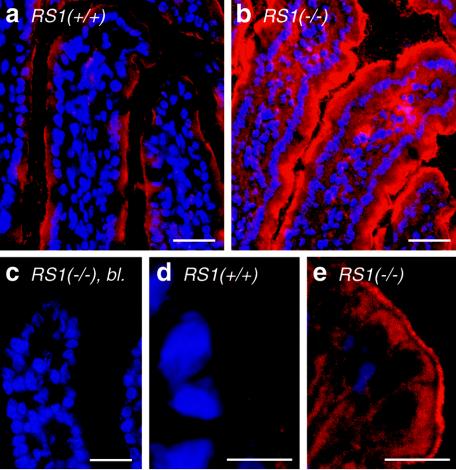
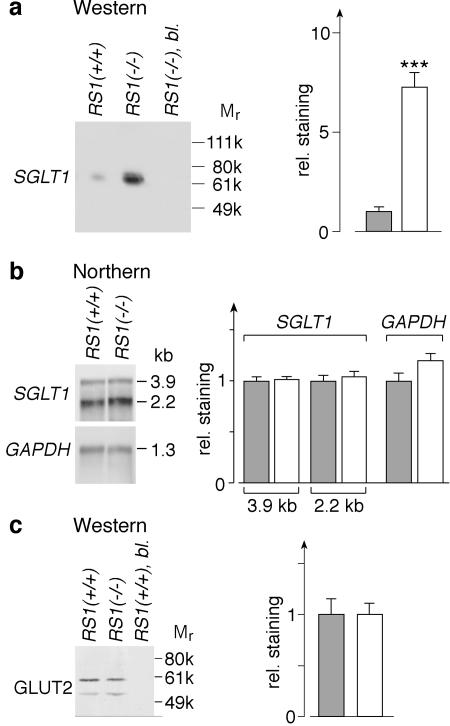
Figure 8 shows the distribution of the Na+-d-glucose cotransporter SGLT1 in the jejunum of RS1+/+ and RS1−/− mice. Staining for SGLT1 with affinity-purified antibody was observed at the brush border membranes of the enterocytes and was abolished after preabsorption with the antigenic peptide (Fig. 8a to c). In RS1−/− mice, the immunoreaction for SGLT1 was much stronger than in wild-type mice (Fig. 8a and b). Laser scanning micrographs showed SGLT1 immunoreactivity at and below the brush border membrane, which was increased in RS1−/− mice at either location (Fig. 8d and e). To quantify the increase of SGLT1 protein, we performed Western blots with PME membrane fractions from the small intestine (Fig. 9a). SGLT1 antibody reacted with a single band of ∼70 kDa. This reaction could be blocked by the antigenic peptide. Western blots on PME fractions from the small intestine of RS1−/− and RS1+/+ mice showed a sevenfold-higher amount of SGLT1 protein in RS1−/− mice (P < 0.001 for difference).
FIG. 8.
Immunolocalization of SGLT1 in the small intestines of RS1−/− mice compared to C57BL/6J wild-type mice. Cryosections of jejunum from RS1+/+ (a and d) and RS1−/− (b, c and e) mice were fixed with paraformaldehyde, reacted with the affinity-purified SGLT1 antibody (1:200), and developed with a Cy3-coupled secondary antibody. (c) The primary antibody reaction was preabsorbed with the antigenic peptide. The sections were also stained with DAPI. Fluorescence was visualized by fluorescence microscopy (a to c) and laser scanning confocal microscopy (d and e). Bars, 10 μm.
FIG. 9.
Quantification of SGLT1 and GLUT2 in small intestine. From small intestines of 10 RS1+/+ or 10 RS1−/− 5-month-old female mice, PME fractions of enterocytes containing luminal and basolateral plasma membranes and mRNAs of enterocytes were prepared and analyzed. Gray columns, RS1+/+ mice; white columns, RS1−/− mice. (a) Western blot with PME fractions from RS1+/+ and RS1−/− mice that were developed with SGLT1 antibody. Per lane, 2.5 μg of protein was applied. The reaction with SGLT1 antibody could be blocked by the antigenic peptide (bl., third lane). A densitometric quantification of six reactions from two independent experiments is shown on the right. ***, P < 0.001. (b) Northern blots of SGLT1 and GAPDH. Per lane, 5 μg of mRNA was applied. On the right, six blots from three independent experiments were quantified. (c) Western blots for GLUT2. The same PME fractions as in panel a were analyzed. Per lane, 10 μg of protein was applied. On the right, in four blots from two independent experiments, both bands were quantified together. rel., relative.
It was previously observed that the rate of transcription of SGLT1 in LLC-PK1-cells was increased when the intracellular concentration of RS1 was reduced via an antisense strategy (17). To determine whether the increase of SGLT1 protein in RS1−/− mice may be explained by up-regulation of transcription, we analyzed whether the SGLT1 mRNA concentration was increased. In Northern blots, no significant differences between RS1−/− and RS1+/+ mice were detected for the 3.9- and 2.2-kb transcripts of the SGLT1 gene (Fig. 9b). Similar transcripts of the SGLT1 gene have been observed in pigs (17). The data indicate that the up-regulation of SGLT1 in RS1−/− mice is exclusively due to posttranslational changes, in contrast to the changes observed in LLC-PK1 cells.
For d-glucose absorption in the small intestine, the d-glucose transporter GLUT2 is required in addition to SGLT1. GLUT2 is localized in the basolateral membrane and mediates d-glucose efflux from the enterocytes (11). To determine whether GLUT2 expression is altered by deletion of the RS1−/− gene, we performed immunoblots for GLUT2 with the PME fraction of enterocytes. Western blots with an affinity-purified subtype-specific antibody against GLUT2 (Fig. 9c) showed a strong band at ∼60 kDa and a weak band at 52 kDa. Both reactions could be blocked by antigenic peptide. Densitometric quantification revealed no significant difference between GLUT2 levels in enterocytes of RS1−/− and RS1+/+ mice (Fig. 9c). Similarly, Northern blots with a specific cDNA probe for GLUT2 showed no significant difference between GLUT2 mRNA in RS1−/− mice compared to wild-type mice (data not shown). The data indicate that the increased absorption of d-glucose in the small intestine of RS1−/− mice is due to up-regulation of SGLT1.
Attempts to detect changes in liver metabolism.
Since the higher capacity of small intestinal d-glucose absorption in RS1−/− versus RS1+/+ mice leads to higher postprandial d-glucose concentration peaks in the portal vein, we wondered whether the metabolism of the liver is changed in RS1−/− mice (1, 6, 9). We compared liver glycogen in 3-month-old male mice. In addition, we tested whether liver glycogen or the glucose-dependent enzyme stearoyl-CoA desaturase 1 (SCD1) were up-regulated to different degrees in 3-month-old male RS1−/− and RS1+/+ mice that were starved for 48 h and then fed for 2 h with d-glucose-enriched chow. SCD1 catalyzes the Δ9-cis desaturation of fatty acids, is expressed in liver, and is up-regulated after a hydrate-rich diet by transcriptional activation (24). Significant differences between RS1−/− and wild-type mice were not detected for the concentration of glycogen (evaluated by chemical determination, n = 6 for each group) or for the concentration of SCD1 mRNA (evaluated by densitometry of Northern blots, n = 6 for each group) (data not shown).
Tissue specificity for up-regulation of SGLT1 in RS1−/− mice.
RS1 is expressed in various tissues and cell types, including epithelial cells, neurons, fibrocytes, and adipocytes (25, 26, 33; unpublished data). Like enterocytes, renal proximal tubular cells and neurons express both RS1 and SGLT1 (25, 26, 33). In addition to the small intestine, we compared SGLT1 protein and SGLT1 mRNA in the kidneys of RS1+/+ and RS1−/− mice. On Western blots of renal brush border membranes, no significant differences in concentrations of SGLT1 protein could be detected between RS1+/+ and RS1−/− mice (data not shown). The same result was obtained by immunofluorescence microscopy (data not shown). Similarly, no significant differences in SGLT1 mRNA levels were detected by Northern blots between kidneys from RS1+/+ and RS1−/− mice (data not shown). The data indicate that the effect of RS1 on the expression of SGLT1 is tissue specific.
DISCUSSION
This work shows that the genetic removal of the regulatory protein RS1 in mice leads to a specific phenotype: first, a posttranscriptional up-regulation of SGLT1 in the small intestine, with an increased d-glucose absorption rate and capacity; second, an increased food intake that results in a visceral type of obesity (8). Up-regulation of SGLT1 in small intestinal enterocytes of RS1−/− mice was cell type specific and selective for SGLT1, inasmuch as the genetic removal of RS1 had no effect on the expression of SGLT1 in renal proximal tubules, of GLUT2 in small intestine, and of the insulin-dependent glucose transporter GLUT4 in fat cells (unpublished data).
RS1 is an intracellular regulatory protein that is down-regulated during cell differentiation (17). If present, it inhibits the expression of several plasma membrane transporters including the Na+-d-glucose cotransporter SGLT1 (18, 26, 37). RS1 inhibits SGLT1 on the transcriptional and posttranscriptional levels. Subconfluent LLC-PK1 cells which are derived from porcine kidney proximal tubules contain large amounts of RS1 protein and small amounts of SGLT1 protein (17). During confluence, the activity of PKC and the intracellular concentration of RS1 protein decrease, whereas the amounts of SGLT1 mRNA and SGLT1 protein increase. Previously, it was shown that a further reduction of RS1 protein in confluent cells expressing antisense RS1 cRNA resulted in a 10-fold increase of the SGLT1 transcription rate (17). By coexpression of SGLT1 and RS1 in oocytes of X. laevis, a posttranscriptional down-regulation of SGLT1 protein in the plasma membrane by RS1 was also demonstrated. This effect was dependent on dynamin and stimulated by PKC (37). In the present study, RS1 was localized below the plasma membrane and within nuclei of small intestinal enterocytes. In keeping with the present localization, RS1 was also localized at the plasma membrane and within the nucleus in LLC-PK1 cells (unpublished data). The localization of RS1 is consistent with its dual transcriptional and posttranscriptional roles.
After genetic removal of RS1, SGLT1 was up-regulated in the small intestine but not in the kidney and the up-regulation occurred only through posttranscriptional mechanisms. This suggests that RS1 regulates the expression of SGLT1 in a tissue-specific manner and that RS1 is specifically involved in the regulation of SGLT1 in the small intestine. The observation that the up-regulation of SGLT1 in the small intestine leads to an increased small intestinal absorption of d-glucose in an ex vivo preparation is consistent with the pivotal role of this secondary active glucose transporter (11). Whereas it is obvious that an inhibition of SGLT1 will decrease the total intestinal d-glucose absorption in vivo (31), it is questionable whether an up-regulation of SGLT1 in vivo will increase the intestinal d-glucose absorption. It is generally believed that d-glucose is quantitatively absorbed in vivo because only minor amounts of d-glucose are detected in the feces (3). Note, however, that most glucose entering the colon should be degraded by bacteria. Our observation that the feces of RS1−/− mice had a borderline significant 1.5% lower energy content per dry mass compared to wild-type mice suggests a more complete absorption of d-glucose or other nutrients; however, it is questionable whether this contributes significantly to the more positive energy balance in RS1−/− mice. Our ex vivo data strongly suggest that the increased expression of SGLT1 in the small intestine leads to higher postprandial d-glucose peaks in the portal vein in vivo. This could influence liver metabolism via a differential up-regulation of glucose-regulated liver enzymes and could change small intestinal functions by differential activation of glucose-sensing neurons (1, 4, 6, 9, 20). We tried to detect an effect of RS1 removal on glucose-dependent regulation of liver metabolism by measuring glycogen and mRNA of stearoyl-CoA desaturase 1 in the liver after feeding starved mice with glucose-enriched food. Although we did not detect significant differences between RS1−/− and wild-type mice, the possibility remains that RS1 influences liver metabolism under physiological conditions that were not covered by our experiments. In summary, the RS1−/− mouse provides a model for the study of the regulation of small intestinal glucose absorption and regulations that are linked to intestinal glucose absorption.
In addition, the RS1−/− mouse is a new model for obesity. At birth and up to the age of 2 months, RS1+/+ and RS1−/− mice have a similar body weight. Thereafter, they develop obesity until the age of 5 months. In 3-month-old RS1−/− mice, we observed a 15% higher food intake than in wild-type mice. For this reason, because the energy expenditure of 3-month-old RS1−/− mice was identical to that of wild-type mice, and because the RS1−/− mice extracted slightly more energy from the food, the energy balance of 3-month-old RS1−/− mice was more positive. This led to a gain of weight and to a considerable increase of fat mass in 5-month-old mice.
The question of how the removal of RS1 leads to an increased intake of food has not been answered. One possibility is that the removal of RS1 changes the function of glucose-sensing neurons in the hypothalamus that have been implicated in the regulation of food intake and body weight (19). The Na+-d-glucose transporter SGLT1 and/or the d-glucose-activated Na+/H+ channel SGLT3, another potential target of RS1, are supposed to be part of glucose-sensing neurons because they mediate glucose-induced membrane depolarization, which may increase the firing frequency in neurons (4, 10). It is probable that SGLT1 and RS1 are expressed in hypothalamic neurons that regulate food intake because we observed in pigs and mice that SGLT1 and RS1 are expressed in neurons all over the central nervous system including the hypothalamus (25; unpublished data). The distribution of SGLT3 in the central nervous system has not been investigated.
After obesity has developed, a counterregulation of food intake takes place. The increase of fat mass and of adipocyte size in the obese mice leads to an up-regulation of leptin secretion. Note that serum leptin levels in 5-month-old RS1−/− mice were significantly higher than in 3-month-old RS1−/− mice. We speculate that an increased leptin secretion reduces the appetite of obese RS1−/− mice, which tends to compensate for the increased food intake due to RS1 removal.
It remains a challenge to elucidate the mechanism by which RS1 contributes to the regulation of food intake, to determine whether mutations in human RS1 are correlated with increased food intake and obesity, and to investigate whether up-regulation of RS1 in the small intestine leads to a down-regulation of SGLT1 and can be employed for the treatment of obesity. RS1−/− mice may help to further explore the regulation of d-glucose absorption in the small intestine.
Acknowledgments
This work was supported by Deutsche Forschungsgemeinschaft grant SFB 487/C1 (to H.K. and V.G.).
Footnotes
The paper is dedicated to Kurt Jungermann, who passed away in May 2003.
REFERENCES
- 1.Bollen, M., S. Keppens, and W. Stalmans. 1998. Specific features of glycogen metabolism in the liver. Biochem. J. 336:19-31. [DOI] [PMC free article] [PubMed] [Google Scholar]
- 2.Cheeseman, C. I. 1997. Upregulation of SGLT-1 transport activity in rat jejunum induced by GLP-2 infusion in vivo. Am. J. Physiol. Regul. Integr. Comp. Physiol. 273:R1965-R1971. [DOI] [PubMed] [Google Scholar]
- 3.Debnam, E. S., E. E. Denholm, and G. K. Grimble. 1998. Acute and chronic exposure of rat intestinal mucosa to dextran promotes SGLTI-mediated glucose transport. Eur. J. Clin. Investig. 28:651-658. [DOI] [PubMed] [Google Scholar]
- 4.Díez-Sampedro, A., B. A. Hirayama, C. Osswald, V. Gorboulev, K. Baumgarten, C. Volk, E. M. Wright, and H. Koepsell. 2003. A glucose sensor hiding in a family of transporters. Proc. Natl. Acad. Sci. USA 100:11753-11758. [DOI] [PMC free article] [PubMed] [Google Scholar]
- 5.Ferraris, R. P., and J. M. Diamond. 1989. Specific regulation of intestinal nutrient transporters by their dietary substrates. Annu. Rev. Physiol. 51:125-141. [DOI] [PubMed] [Google Scholar]
- 6.Foufelle, F., J. Girard, and P. Ferré. 1996. Regulation of lipogenic enzyme expression by glucose in liver and adipose tissue: a review of the potential cellular and molecular mechanisms. Adv. Enzyme Regul. 36:199-226. [DOI] [PubMed] [Google Scholar]
- 7.Frederich, R. C., B. Löllmann, A. Hamann, A. Napolitana-Rosen, B. B. Kahn, B. B. Lowell, and J. S. Flier. 1995. Expression of ob mRNA and its encoded protein in rodents. Impact of nutrition and obesity. J. Clin. Investig. 96:1658-1663. [DOI] [PMC free article] [PubMed] [Google Scholar]
- 8.Fujioka, S., Y. Matsuzawa, K. Tokunaga, and S. Tarui. 1987. Contribution of intra-abdominal fat accumulation to the impairment of glucose and lipid metabolism in human obesity. Metabolism 36:54-59. [DOI] [PubMed] [Google Scholar]
- 9.Girard, J., P. Ferré, and F. Foufelle. 1997. Mechanisms by which carbohydrates regulate expression of genes for glycolytic and lipogenic enzymes. Annu. Rev. Nutr. 17:325-352. [DOI] [PubMed] [Google Scholar]
- 10.Gribble, F. M., L. Williams, A. K. Simpson, and F. Reimann. 2003. A novel glucose-sensing mechanism contributing to glucagon-like peptide-1 secretion from GLUTag cell line. Diabetes 52:1147-1154. [DOI] [PubMed] [Google Scholar]
- 11.Hediger, M. A., and D. B. Rhoads. 1994. Molecular physiology of sodium-glucose cotransporters. Physiol. Rev. 74:993-1026. [DOI] [PubMed] [Google Scholar]
- 12.Hirsch, J. R., D. D. F. Loo, and E. M. Wright. 1996. Regulation of Na+/glucose cotransporter expression by protein kinases in Xenopus laevis oocytes. J. Biol. Chem. 271:14740-14746. [DOI] [PubMed] [Google Scholar]
- 13.Hirsh, A. J., and C. I. Cheeseman. 1998. Cholecystokinin decreases intestinal hexose absorption by a parallel reduction in SGLT1 abundance in the brush-border membrane. J. Biol. Chem. 273:14545-14549. [DOI] [PubMed] [Google Scholar]
- 14.Ishikawa, Y., T. Eguchi, and H. Ishida. 1997. Mechanism of β-adrenergic agonist-induced transmural transport of glucose in rat small intestine-regulation of phosphorylation of SGLT1 controls the function. Biochim. Biophys. Acta 1357:306-318. [DOI] [PubMed] [Google Scholar]
- 15.Klaus, S., H. Münzberg, C. Trüloff, and G. Heldmaier. 1998. Physiology of transgenic mice with brown fat ablation: obesity is due to lowered body temperature. Am. J. Physiol. Regul. Integr. Comp. Physiol. 274:R287-R293. [DOI] [PubMed] [Google Scholar]
- 16.Kleiber, M. 1961. The fire of life, p. 177-216, John Wiley & Sons, Inc., New York, N.Y.
- 17.Korn, T., T. Kühlkamp, C. Track, I. Schatz, K. Baumgarten, V. Gorboulev, and H. Koepsell. 2001. The plasma membrane-associated protein RS1 decreases transcription of the transporter SGLT1 in confluent LLC-PK1 cells. J. Biol. Chem. 276:45330-45340. [DOI] [PubMed] [Google Scholar]
- 18.Lambotte, S., M. Veyhl, M. Köhler, A. I. Morrison-Shetlar, R. K. H. Kinne, M. Schmid, and H. Koepsell. 1996. The human gene of a protein that modifies Na+-d-glucose co-transport. DNA Cell Biol. 15:769-777. [DOI] [PubMed] [Google Scholar]
- 19.Levin, B. E. 2001. Glucosensing neurons do more than just sense glucose. Int. J. Obes. Relat. Metab. Disord. 25:S68-S72. [DOI] [PubMed] [Google Scholar]
- 20.Liu, M., S. Seino, and A. L. Kirchgessner. 1999. Identification and characterization of glucoresponsive neurons in the enteric nervous system. J. Neurosci. 19:10305-10317. [DOI] [PMC free article] [PubMed] [Google Scholar]
- 21.Loflin, P., and J. E. Lever. 2001. HuR binds a cyclic nucleotide-dependent, stabilizing domain in the 3′ untranslated region of Na+/glucose cotransporter (SGLT1) mRNA. FEBS Lett. 509:267-271. [DOI] [PubMed] [Google Scholar]
- 22.Maffei, M., J. Halaas, E. Ravussin, R. E. Pratley, G. H. Lee, Y. Zhang, H. Fei, S. Kim, R. Sallone, S. Ranganathan, P. A. Kern, and J. M. Friedman. 1995. Leptin levels in human and rodent: measurement of plasma leptin and ob RNA in obese and weight-reduced subjects. Nat. Med. 1:1155-1161. [DOI] [PubMed] [Google Scholar]
- 23.Martín, M. G., J. Wang, R. S. Solorzano-Vargas, J. T. Lam, E. Turk, and E. M. Wright. 2000. Regulation of the human Na+-glucose cotransporter gene, SGLT1, by HNF-1 and Sp1. Am. J. Physiol. Gastrointest. Liver Physiol. 278:G591-G603. [DOI] [PubMed] [Google Scholar]
- 24.Ntambi, J. M. 1992. Dietary regulation of stearoyl-CoA desaturase 1 gene expression in mouse liver. J. Biol. Chem. 267:10925-10930. [PubMed] [Google Scholar]
- 25.Poppe, R., U. Karbach, S. Gambaryan, H. Wiesinger, M. Lutzenburg, M. Wiesinger, M. Kraemer, O. W. Witte, and H. Koepsell. 1997. Expression of the Na+-d-glucose cotransporter SGLT1 in neurons. J. Neurochem. 69:84-94. [DOI] [PubMed] [Google Scholar]
- 26.Reinhardt, J., M. Veyhl, K. Wagner, S. Gambaryan, C. Dekel, A. Akhoundova, T. Korn, and H. Koepsell. 1999. Cloning and characterization of the transport modifier RS1 from rabbit which was previously assumed to be specific for Na+-d-glucose cotransport. Biochim. Biophys. Acta 1417:131-143. [DOI] [PubMed] [Google Scholar]
- 27.Rhoads, D. B., D. H. Rosenbaum, H. Unsal, K. J. Isselbacher, and L. L. Levitsky. 1998. Circadian periodicity of intestinal Na+/glucose cotransporter 1 mRNA levels is transcriptionally regulated. J. Biol. Chem. 273:9510-9516. [DOI] [PubMed] [Google Scholar]
- 28.Stümpel, F., R. Burcelin, K. Jungermann, and B. Thorens. 2001. Normal kinetics of intestinal glucose absorption in the absence of GLUT2: evidence for a transport pathway requiring glucose phosphorylation and transfer into the endoplasmic reticulum. Proc. Natl. Acad. Sci. USA 98:11330-11335. [DOI] [PMC free article] [PubMed] [Google Scholar]
- 29.Stümpel, F., T. Kucera, A. Gardemann, and K. Jungermann. 1996. Acute increase by portal insulin in intestinal glucose absorption via hepatoenteral nerves in the rat. Gastroenterology 110:1863-1869. [DOI] [PubMed] [Google Scholar]
- 30.Stümpel, F., B. Scholtka, and K. Jungermann. 1997. A new role for enteric glucagon-37: acute stimulation of glucose absorption in rat small intestine. FEBS Lett. 410:515-519. [DOI] [PubMed] [Google Scholar]
- 31.Tsujihara, K., M. Hongu, K. Saito, H. Kawanishi, K. Kuriyama, M. Matsumoto, A. Oku, K. Ueta, M. Tsuda, and A. Saito. 1999. Na+-glucose cotransporter (SGLT) inhibitors as antidiabetic agents. 4. Synthesis and pharmacological properties of 4′-dehydroxyphlorizin derivatives substituted on the B ring. J. Med. Chem. 42:5311-5324. [DOI] [PubMed] [Google Scholar]
- 32.Tybulewicz, V. L. J., C. E. Crawford, P. K. Jackson, R. T. Bronson, and R. C. Mulligan. 1991. Neonatal lethality and lymphopenia in mice with a homozygous disruption of the c-abl proto-oncogene. Cell 65:1153-1163. [DOI] [PubMed] [Google Scholar]
- 33.Valentin, M., T. Kühlkamp, K. Wagner, G. Krohne, P. Arndt, K. Baumgarten, W.-M. Weber, A. Segal, M. Veyhl, and H. Koepsell. 2000. The transport modifier RS1 is localized at the inner side of the plasma membrane and changes membrane capacitance. Biochim. Biophys. Acta 1468:367-380. [DOI] [PubMed] [Google Scholar]
- 34.Vayro, S., and M. Silverman. 1999. PKC regulates turnover rate of rabbit intestinal Na+-glucose transporter expressed in COS-7 cells. Am. J. Physiol. Cell Physiol. 276:C1053-C1060. [DOI] [PubMed] [Google Scholar]
- 35.Vayro, S., I. S. Wood, J. Dyer, and S. P. Shirazi-Beechey. 2001. Transcriptional regulation of the ovine intestinal Na+/glucose cotransporter SGLT1 gene. Role of HNF-1 in glucose activation of promoter function. Eur. J. Biochem. 268:5460-5470. [DOI] [PubMed] [Google Scholar]
- 36.Veyhl, M., J. Spangenberg, B. Püschel, R. Poppe, C. Dekel, G. Fritzsch, W. Haase, and H. Koepsell. 1993. Cloning of a membrane-associated protein which modifies activity and properties of the Na+-d-glucose cotransporter. J. Biol. Chem. 268:25041-25053. [PubMed] [Google Scholar]
- 37.Veyhl, M., C. A. Wagner, V. Gorboulev, B. M. Schmitt, F. Lang, and H. Koepsell. 2003. Downregulation of the Na+-d-glucose cotransporter SGLT1 by protein RS1 (RSC1A1) is dependent on dynamin and protein kinase C. J. Membr. Biol. 196:71-81. [DOI] [PubMed] [Google Scholar]
- 38.Weir, J., B. 1949. New methods for calculating metabolic rate with special reference to protein metabolism. J. Physiol. 109:1-9. [DOI] [PMC free article] [PubMed] [Google Scholar]


