Abstract
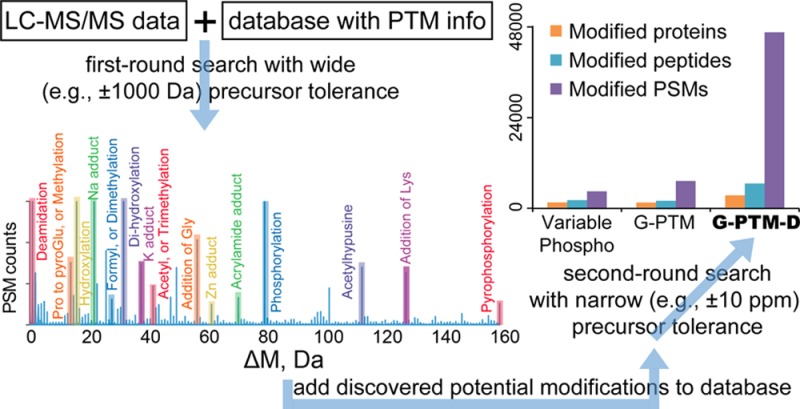
A new global post-translational modification (PTM) discovery strategy, G-PTM-D, is described. A proteomics database containing UniProt-curated PTM information is supplemented with potential new modification types and sites discovered from a first-round search of mass spectrometry data with ultrawide precursor mass tolerance. A second-round search employing the supplemented database conducted with standard narrow mass tolerances yields deep coverage and a rich variety of peptide modifications with high confidence in complex unenriched samples. The G-PTM-D strategy represents a major advance to the previously reported G-PTM strategy and provides a powerful new capability to the proteomics research community.
Keywords: G-PTM-D, post-translational modification discovery, proteomics, database search
Introduction
Protein post-translational modifications (PTMs) modulate critical biological processes such as protein signaling, localization, and degradation and have been implicated in a wide variety of pathologies. Despite their importance, the comprehensive identification and discovery of PTMs in complex biological samples has continued to pose a difficult challenge for proteomics technologies.1
We have recently described a global PTM (G-PTM) identification strategy that enables the rapid and confident identification of numerous PTM types in a single-pass database search.2,3 Identification is accomplished by searching for the presence or absence of PTMs exclusively at curated sites designated in the UniProt repository. However, as such lists of curated PTMs are at present quite incomplete, the G-PTM strategy necessarily misses many important PTMs. For example, hydroxyproline is known to be a prevalent PTM in type I collagen,4,5 but only four of many hydroxyproline sites in type I collagen are included in the human UniProt database. Furthermore, despite containing 470 PTM types as of May 2015 (http://www.uniprot.org/docs/ptmlist), the UniProt database is still missing many additional novel PTMs, chemical derivatives, and sample-specific amino acid variants, which thereby precludes the G-PTM strategy from identifying these modifications.
To search for both known and unknown PTM types at once, several unrestrictive PTM identification approaches, including wide mass tolerance searches, have been devised.6−12 However, these strategies suffer from limitations such as not being readily applicable to large proteomic data sets, requiring the detection of both modified and unmodified forms of a peptide in the sample or sacrificing either sensitivity or confidence of modified peptide detection.
We describe here a global PTM discovery (G-PTM-D) strategy that combines the ability to discover uncurated/unexpected modifications offered by an unrestrictive approach, with the high confidence afforded by the G-PTM approach for identifying curated PTMs. G-PTM-D searches for modifications only at amino acid residue positions corresponding to either curated PTMs from the UniProt repository or potential modifications discovered on specific peptides from an initial search using a wide mass tolerance. Limiting modifications to defined positions in this manner enables the discovery of a large variety of PTMs while maintaining high confidence for all peptide and PTM identifications.
Experimental Procedures
G-PTM-D Search
Stage 1: G-PTM Search with Ultrawide Precursor Mass Tolerance
Software used in this manuscript is freely available at https://github.com/smith-chem-wisc/gptmd. A PTM-curated database in Extensible Markup Language (XML) format was first downloaded from http://www.uniprot.org/proteomes/. A Perl script xml_trimming.pl was first run to delete irrelevant information in the database and retain only the sequence and PTM information to speed up the downstream search. The software program Morpheus13 (revision 149) (freely available at http://cwenger.github.io/Morpheus/) utilized the trimmed UniProt XML database along with data files in either .raw or .mzML format. When an XML database is specified in Morpheus, all curated modifications are automatically extracted, added to the variable modifications box, and selected. During the search process, all protein sequences are read, along with the locations of selected UniProt variable modifications. The precursor mass tolerance (monoisotopic) was set to either ±1000 or ±200 Da for Jurkat, ±200 Da for four common human cell lines, and ±1000 Da for Matrigel. Other settings were as follows: protease = trypsin (no proline rule); maximum missed cleavages = 2; initiator methionine behavior = variable; fixed modifications = carbamidomethylation of C; variable modifications = oxidation of M, and others automatically selected after adding the XML database; maximum variable modification isoforms per peptide = 1024; precursor monoisotopic peak correction = disabled; product mass tolerance = ± 0.01 Da (monoisotopic); maximum false discovery rate = 1%.
Stage 2: Translating ΔM Values into Potential Modifications and Incorporating Them into a New XML Database
The Morpheus output file called PSMs.tsv generated during stage 1 contains each peptide spectral match (PSM) with its associated attributes including the actual precursor mass error (ΔM). A ΔM histogram was constructed with a bin size of 0.002 Da. Peaks in the histogram were examined as possible modifications. A sub_ptmlist.txt file was created and contained a list of the chosen modifications, including the name of the modification type (e.g., phosphoserine), the modified amino acid full name (e.g., serine), as well as the monoisotopic mass difference (e.g., 79.966330). An AA_Name_to_letter.txt file contained a list of the 20 common amino acid full names (e.g., serine) and corresponding abbreviations (e.g., S). The PSMs.tsv file, the two .txt files, and the original XML database were all used as inputs to a Perl script xml_AddOpenSearchResult.pl. The Perl script reads in each PSM along with its ΔM. If the ΔM of a peptide is within ±0.02 Da from a PTM type (e.g., phosphoserine, phosphothreonine, and phosphotyrosine) specified in the sub_ptmlist.txt file, it assigns this PTM type (e.g., phosphorylation) to every amino acid (e.g., serine, threonine, and tyrosine) in that particular peptide by writing these potential modification identities and positions in the new XML database. The .txt files, Perl scripts, Morpheus software, and a user instruction document are placed in Supplementary Software. Note that this software package includes 11 regular modifications in the sub_ptmlist_regular.txt to circumvent the manual construction and examination of the ΔM histogram and to automatically add potential sites of these common modifications to the new XML database (i.e., streamlined G-PTM-D workflow).
Stage 3: Second-Round Search with the New XML Database and Narrow Precursor Mass Tolerance
The output from running the Perl script described in stage 2 is a new XML file that contains not only the UniProt curated PTMs but also potential modifications identified by the wide precursor tolerance search. A second-round Morpheus search was performed with this new database, ±10 ppm precursor mass tolerance and ±0.01 Da product mass tolerance. All other search parameters were kept the same as in stage 1.
pMatch Search
The Matrigel spectra were first searched against a protein database (downloaded from UniProt in FASTA format) with the pFind search engine.14 Carbamidomethylation of cysteine was specified as a fixed modification and oxidation of methionine as variable. Next, pMatch (version 1.5) was used for library construction from the identified spectra, followed by search of all spectra against the library, with precursor mass tolerance of ±500 Da. Default values were used for other parameters.
MODa Search
MODa version 1.23 was used to search the Matrigel spectra with the following parameters: auto parent mass correction enabled; fragment ion mass tolerance = 0.01 Da; minimum/maximum modification size = −200/+200 Da; enzyme = trypsin, KR/C; fixed modification = C, 57.0215; HighResolution = ON. Default values were used for all other parameters. Significant peptide identifications were obtained using anal_moda.jar.
Data Sets
Three separate data sets with deep proteome coverage were used to evaluate the performance of the G-PTM-D strategy.
Human Jurkat Cell Lysate (with 28 Peptide Fractions)
Sample preparation and MS analysis of human Jurkat cells were previously reported.15 The 28 MS raw files consisting of 490 057 MS/MS scans are available via FTP from the PeptideAtlas data repository16 by accessing the following link: http://www.peptideatlas.org/PASS/PASS00215. The curated database was the Homo sapiens reference proteome from UniProt (downloaded on December 23, 2013), limited to those proteins with mRNA transcript abundances exceeding 0.1 transcripts per million.13 This data set was used to illustrate the G-PTM-D workflow in detail and to compare G-PTM-D with a variable phosphorylation search and a G-PTM search.
Four Common Human Cell Lysates (with Six Peptide Fractions of 3 Biological Replicates for Each Cell Lysate)
Sample preparation and MS analyses of human HEK293, A549, HeLa, and K562 cell lysates were previously reported.17 The four cell lines were randomly chosen from the 11 cell lines reported. The curated database was the Homo sapiens reference proteome from UniProt (downloaded on May 15, 2015). These data sets were analyzed with the streamlined G-PTM-D workflow (i.e., automatically adding 11 regular modification types in the supplemented databases, without construction of the ΔM histogram) and were used to demonstrate the wide applicability of G-PTM-D and its improved performance compared with the G-PTM strategy.
Matrigel (with Six Peptide Fractions)
Sample preparation and MS analysis of Matrigel were previously reported.18 The MS raw files consisting of 107 162 MS/MS scans from six peptide fractions are available via FTP from the PeptideAtlas data repository by accessing the following link: http://www.peptideatlas.org/PASS/PASS00557. (The six raw files used are the ones with “Matrigel01” in the file name.) The curated database was the Mus musculus reference proteome from UniProt (downloaded on April 20, 2015). This data set was used to compare the performance of G-PTM-D with pMatch and MODa.
FDR and PEP Calculation
A 1% global FDR at the PSM level was applied when reporting the results. This means that the ratio of the number of decoy PSMs to the number of target PSMs is 0.01.
The FDR for the modified peptides is the ratio of the number of modified decoy PSMs to the number of modified target PSMs from the list of all PSMs meeting the 1% global FDR cutoff.
Posterior error probability (PEP) is a local false discovery rate (FDR) representing the probability that individual peptides are false. The PEP for the modified peptides at a certain score is the ratio of the number of modified decoy PSMs to the number of modified target PSMs among the PSMs that have a score within half of the score bin size from that particular score (e.g., scores 8.5 to 9.5 were binned and plotted as score 9 for Figures 2c and 6c). Peptides that contain only carbamidomethylation of cysteine or oxidation of methionine were not considered as “modified”.
Figure 2.
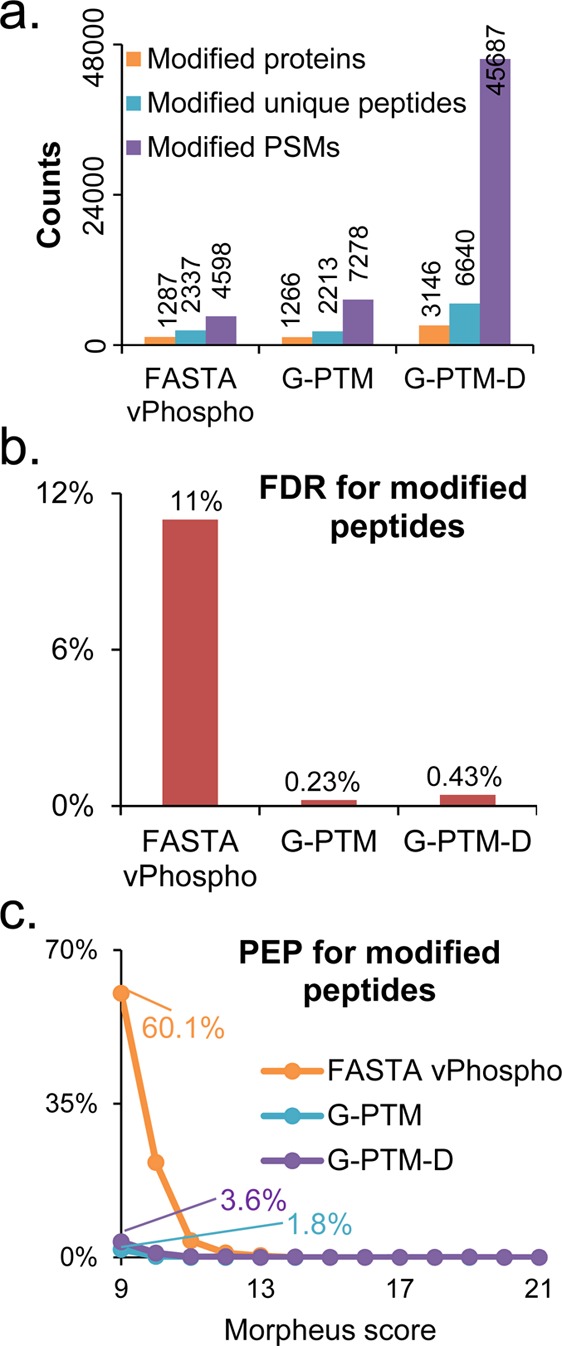
Results from three types of searches of the Jurkat cell data set: a vPhospho search (using the UniProt FASTA database with phosphorylation as a variable modification), a G-PTM search (using the PTM-curated UniProt database), and a G-PTM-D search. (a) Numbers of modified proteins, unique peptides, and PSMs for each search. The 45 687 modified PSMs identified by G-PTM-D are shown in Supplementary Table S2, with a hyperlink to the MS-Viewer report for each PSM. (b) False discovery rate (FDR) for modified peptides. (c) Posterior error probability (PEP) for modified peptides as a function of the Morpheus score. All results are based on 1% global FDR.
Figure 6.
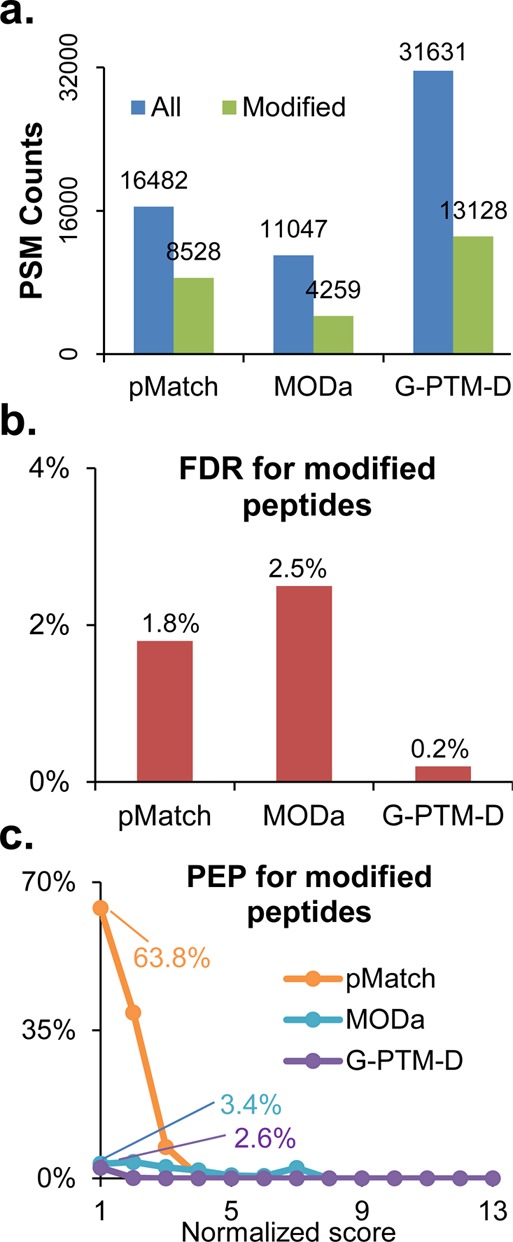
Results from searches of the Matrigel data set using pMatch, MODa, and G-PTM-D. (a) Numbers of identified PSMs (all and modified). (b) False discovery rate (FDR) for modified peptides. (c) Posterior error probability (PEP) for modified peptides as a function of score. Note that the PEP values were plotted versus normalized scores to account for the different score scales of Morpheus, pMatch, and MODa (scores were normalized to a scale from 1 to 13). All results in this Figure met a 1% global FDR.
Results and Discussion
Global PTM Discovery (G-PTM-D) Search Strategy
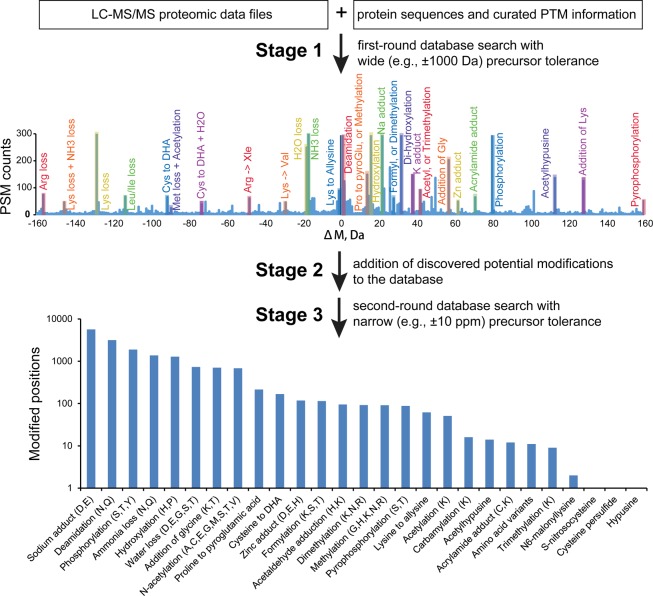
In the G-PTM-D strategy, a protein database that contains both the protein sequences and the curated PTMs is employed for a first-round G-PTM search using a wide (e.g ± 1000 Da) precursor mass tolerance (Figure 1). As previously described,2 the G-PTM search approach differs from the traditional variable modification search approach in that it considers only previously curated PTMs at specific amino acid residue positions, evaluating the data for either the presence or absence of the PTMs at those specific residues. The output file from this first-round wide tolerance search contains each PSM with its associated attributes including the precursor mass error ΔM (i.e., the difference between the measured experimental mass of the peptide and the theoretical mass of the highest scoring peptide from the database). A histogram of all ΔM values from the entire search reveals numerous peaks, which correspond to various modification types. For example, peptides with ΔM corresponding to the +79.966 Da peak in the ΔM histogram are identified as having a probable phosphorylation. For each of those peptides, a phosphorylation site is added to the original database for each serine, threonine, and tyrosine in that peptide. This process is repeated for all of the peaks in the histogram having a ΔM readily attributable to a modification. Finally, the modified database, containing both the UniProt-curated PTMs of the original search and the newly added potential modifications (with both identity and possible locations), is used to conduct a second-round G-PTM search with the usual narrow precursor mass tolerance, resulting in the identification of a myriad site-specific modifications.
Figure 1.
G-PTM-D workflow, illustrated with results from the Jurkat cell data set. An expanded view (±160 Da) of the histogram of precursor mass error (ΔM) searched with ±1000 Da precursor mass tolerance is displayed here; the full histogram and a comparison to a ±200 Da search are shown in Supplementary Figure S1. The numbers of modified sites for each of the 27 identified modification types are also displayed.
The performance of the G-PTM-D search strategy was evaluated by searching a deep proteomic data set obtained from human Jurkat cells (Experimental Procedures). The ΔM histogram shown in Figure 1 is from the G-PTM-D search of this data set with ±1000 Da precursor tolerance. Dozens of peaks in the histogram rise up well above the noise and are readily matched to the masses of known modifications. This first-round wide precursor mass tolerance search yielded 45 198 newly identified positions of potential modification, which were added to the 22 550 curated PTM positions already present in the original UniProt repository. This “supplemented” database was then used for the second-round search, yielding 16 677 site-specific modifications, comprising 27 different types (Figure 1; Supplementary Table S1). In addition to modifications that sometimes result from sample handling (e.g., deamidation) and electrospray ionization mass spectrometry (e.g., ammonia loss, water loss, metal adducts), numerous biologically significant modifications were observed, including PTMs (e.g., phosphorylation, formylation, methylation, and acetylation), cotranslational modifications (e.g., N-terminal acetylation), and amino acid variants.
G-PTM-D can provide amino acid specificity information for ΔM values that do not correspond to known modifications. The process for deriving the likely amino acid residue(s) of modifications having a certain ΔM is as follows: The modification is assigned to any amino acid in the peptides that have that ΔM; all such modifications are incorporated into the new database, the second-round search with regular mass tolerance is performed, and the occurrences of the modification on different amino acids are examined (Supplementary Notes).
Comparison of G-PTM-D with Variable Phosphorylation and G-PTM Searches
The Jurkat data set was further used to compare performance of G-PTM-D with a variable phosphorylation search (“vPhospho”), and a “G-PTM” search that only uses the curated PTM information from UniProt. Compared with the other two searches, G-PTM-D identified nearly triple the number of modified proteins and unique peptides and increased the number of modified peptide PSMs by more than 6-fold (Figure 2a). (The overlap between the 7278 modified spectra identified by G-PTM and the 45 687 modified spectra identified by G-PTM-D is shown in Supplementary Figure S2a.) Notably, the FDR for modified peptides identified by G-PTM-D was only 0.43% (Figure 2b), which is even below the global FDR of 1% (for all peptides, both modified and unmodified). In contrast, the FDR for phosphorylated peptides identified using the variable phosphorylation strategy was much worse (11%). PEP values were calculated from the numbers of target and decoy spectral matches having nearly the same Morpheus score (Experimental Procedures). These PEP values are plotted in Figure 2c as a function of the Morpheus score,17 the peptide spectrum matching score provided by the Morpheus search algorithm. Note that PEP is a local FDR, representing the probability that individual peptides with a given score are false.19 At the lowest Morpheus score (9) that meets 1% global FDR, the probability is only 0.036 (3.6%) that the modified peptides from G-PTM-D are incorrect, whereas the probability is substantially higher (60.1%) for phosphorylated peptides from the variable modification search. For the 6347 modified spectra identified by both G-PTM and G-PTM-D (Supplementary Figure S2a), the PEP values from G-PTM-D are generally smaller, indicating higher confidence (Supplementary Figure S2b). PEP as a function of the ratio of matching products (i.e., the ratio of the number of matching product ions to the number of all product ions in a MS/MS spectrum) also showed higher confidence for modified peptide identification with G-PTM-D (Supplementary Figure S3).
All three of these search strategies employ the target-decoy approach for calculations of FDR. In brief, decoy protein sequences are generated on-the-fly by reversing the order of the amino acid residues (unmodified or modified) for each protein sequence, and PTMs move with their companion amino acid. This results in an equal number of target and decoy sequences. We searched data sets from four additional human cell lines, HEK293, A549, HeLa, and K562 (Experimental Procedures), to demonstrate the target-decoy approach with G-PTM-D. The numbers of unique peptide hits (all or modified, target or decoy) are plotted against Morpheus score in Supplementary Figure S4. The distribution of scores for target and modified-target peptides is bimodal, with the lower group of scores overlapping with the decoy peptide distributions, while the higher group of scores primarily corresponds to target peptides. A 1% FDR criterion corresponds to a Morpheus score of approximately 9, which falls between the decoy and target groups of scores.
Certain types of two-pass searches have been reported to show bias for identification of modified peptides in the second pass search and underestimate the FDR. These artifacts emanate from changes to the target and decoy databases between passes, and they are revealed by large differences in the distributions of mass errors, search scores, and expectation values between modified and unmodified peptide spectral matches. To investigate this issue, we graphed three distributions for modified and unmodified PSMs resulting from G-PTM-D searches (Supplementary Figure S5 and Supplementary Notes). This allowed evaluation of the extent, if any, of differences for these two groups, similar to the analysis performed in Figure 3 from Everett et al.20 We observed nearly complete overlap in all of the plots of the distributions of values (mass error, Morpheus score, and Q-value19,22) for the unmodified and modified PSMs, indicating that the G-PTM-D strategy does not have bias toward identification of modified peptides and further that there is no difference between the FDRs of unmodified and modified peptides. This result is likely due to the fact that all protein sequences used in the database for the first-round search are retained in the second-round search. The search database is merely expanded to include potential modifications on certain target peptides where high-scoring matches with PTM-characteristic mass errors are observed in matches from the first-round search. The unmodified sequences remain the same in the second-round search and serve as a control.
Figure 3.
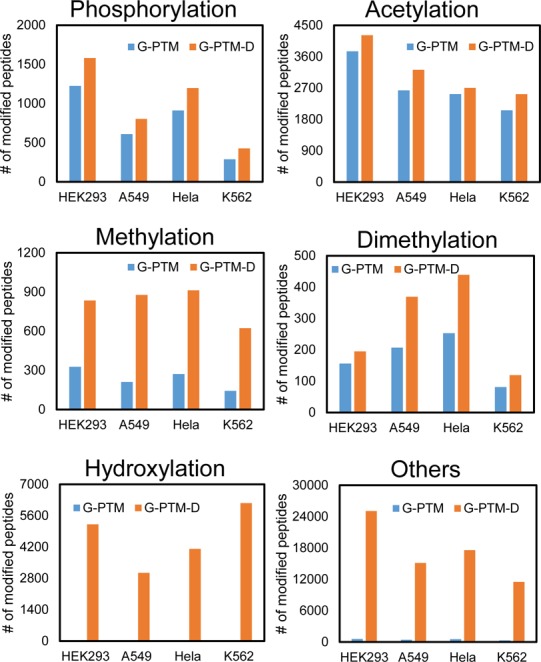
Numbers of peptides with modifications identified by G-PTM or G-PTM-D for the four human cell lines. “Others” include trimethylation, carboxylation, sulfation, water loss, ammonia loss, and deamidation.
The results from the four cell lines were also examined to illustrate the general improvement afforded by G-PTM-D for identification of modified peptides. For these data, we implemented the streamlined G-PTM-D workflow (i.e., automatically adding 11 regular modification types in the supplemented databases, without manual construction of the ΔM histogram). On average, ∼7400 proteins were identified for each cell line. G-PTM-D revealed additional modifications, compared with G-PTM searches (Figure 3). For methylation, dimethylation, and hydroxylation, which are not as well studied or curated as phosphorylation and acetylation, G-PTM-D provided a remarkable increase in the number of modified peptide identifications. These results suggest that modified peptides are more common than previously recognized and that many peptides are routinely missed or misassigned in proteomics experiments on unenriched cell lysate samples where the database search algorithm does not consider PTMs.
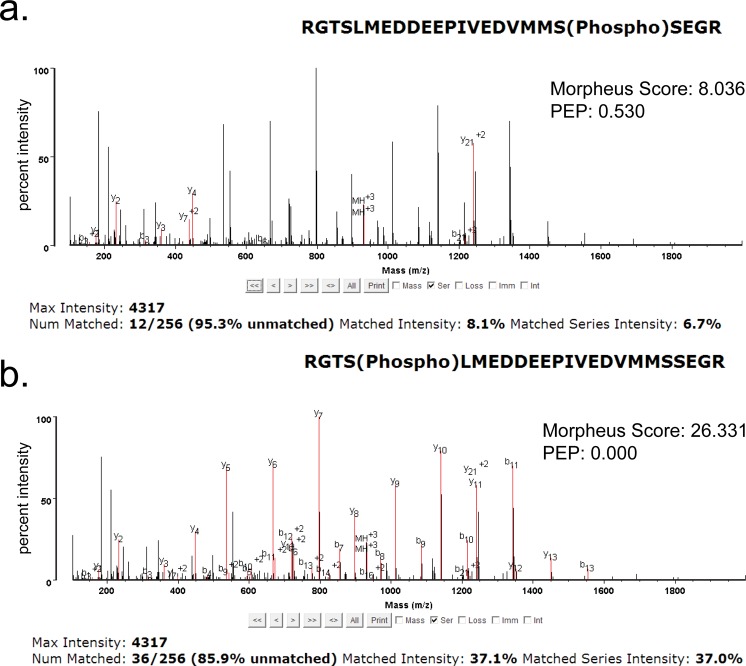
Apart from a remarkable improvement in the number of modified peptide identifications, G-PTM-D also delivered increased/better Morpheus scores than the G-PTM search. Among the PSMs identified by G-PTM-D with 1% FDR in the Jurkat data set, 15% of them had higher scores for the G-PTM-D search compared with the G-PTM search, while the other 85% had the same score (Figure 4). All of the PSMs with increased Morpheus scores were modified, and 98.7% of them were reassigned to different base peptide sequences by the G-PTM-D strategy compared with the G-PTM search. These spectra would have been incorrectly identified without the more complete list of modification types provided by G-PTM-D. Among the relatively few spectra that were assigned the same base peptide but with increased score, some were found to have the same type and number of modifications but at different locations (see example in Figure 5). These results indicate that the curated site information used in a G-PTM search does not always yield the correct site and G-PTM-D may find a better match.
Figure 4.
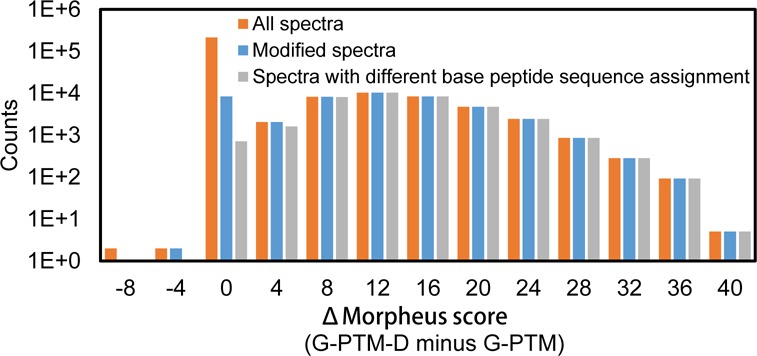
Histogram of Δ Morpheus score, the difference between the Morpheus score by G-PTM-D and the Morpheus score by G-PTM, for all the Jurkat spectra that were identified by G-PTM-D with 1% FDR (orange), for those modified (blue), or for those that were assigned to different base peptide sequence in G-PTM and G-PTM-D (gray). A Δ Morpheus score of zero indicates no difference between the two types of searches. The positive Δ Morpheus scores (15% of all assignments) indicate G-PTM-D found a better match, and all of these improved cases were for modified spectra.
Figure 5.
Annotation of the same spectrum from the Jurkat data set (fraction 6, spectrum number 18675) from (a) G-PTM identification, which includes phosphorylation of serine 20 and (b) G-PTM-D identification, which yields a much better match to fragment ions for this phosphorylation of serine 4. Red font is used to represent ion matches. Note that the G-PTM search employed the curated phosphorylation sites from UniProt, which only included serine 20 for this peptide. G-PTM-D, however, was able to reassign this spectrum to phosphorylation of serine 4, which is likely the correct modification site, given the substantial improvement in fragment ion matches.
Search Time
The first-round search of the Jurkat 28 peptide fractions (490 057 MS/MS scans) with ±1000 and ±200 Da precursor mass tolerances took 13 and 3 days, respectively, on a Dell Precision workstation with Intel Xeon CPU, 2.70 GHz, and a maximum of 24 threads. The second-round search took only 1.4 h. A precursor tolerance of ±200 Da is good enough to capture the vast majority of the important and known modifications, and a total analysis time of 3 days on nearly half a million MS/MS scans is reasonable, considering the wealth of modification information acquired. We searched 3 out of the 28 fractions with ±1000 Da precursor tolerance with either Proteome Discoverer (the search algorithm used by Gygi et al.) or Morpheus, with the same protein database in either FASTA or XML format. The search times for Morpheus (73 h) and for Proteome Discoverer (62 h) were comparable. In cases where computation time/resources are limited, one could choose to perform a G-PTM search with normal precursor mass tolerance and then use only the proteins identified in the G-PTM search or reduce the “Maximum Variable Modification Isoforms per Peptide” in the Morpheus graphical user interface to perform the wide precursor tolerance search. Another option for saving time on repeated analyses of similar types of samples is to only perform the wide-tolerance search on a representative subset of the samples. Then, one could use the XML database of modified peptides generated from this set for narrow-tolerance G-PTM type searches of all other similar samples. We have also modified the source code of the Morpheus search engine so that it is able to accommodate discrete precursor mass tolerance windows that correspond to known modifications to significantly reduce the search time for users who are interested only in certain modification types.
Comparison to Other PTM Identification Strategies
Performing the second-round search with narrow precursor mass tolerance and evaluating the data for either the presence or absence of the modifications only at specific locations is crucial to the confident spectral identification afforded by G-PTM-D compared with other wide precursor mass tolerance search strategies.9,12 In the Jurkat cell data set, 25% (62 289) of the 249 223 PSMs identified at 1% FDR in the second-round G-PTM-D search had not been identified in the first-round wide-tolerance search. The majority of these “rescued” PSMs (44 530) corresponded to unmodified peptides, consistent with the ∼20% loss of unmodified PSMs reported by Gygi and coworkers in their wide-tolerance searches.12 The balance of the “rescued” PSMs was composed of 17 759 PSMs for modified peptides. For example, one spectrum was matched to a decoy (false) peptide during the first-round search with a ΔM of +8.9263 Da, but in the second-round search, it was identified as a phosphorylated peptide from the chromosome alignment-maintaining phosphoprotein 1 with a ΔM of −0.0029 Da (annotated spectrum in Supplementary Figure S6). Thus the narrow-tolerance second-round search of G-PTM-D rescues both unmodified and modified peptides, and it even corrects some assignment errors that are introduced by the wide-tolerance search.
Finally, we compared the performance of G-PTM-D with two other unrestrictive modification search tools, pMatch9 and MODa. This comparison was performed on an alternative and simpler data set obtained from a Matrigel sample (Experimental Procedures) to demonstrate the applicability of G-PTM-D to different data sets and also to limit the CPU hours needed for running pMatch and MODa. pMatch is based on an open MS/MS spectral library search, and MODa uses multiple sequence tags and a dynamic programming spectral alignment algorithm. At 1% FDR, G-PTM-D identifies almost double and triple the number of PSMs compared with pMatch and MODa, respectively, for both modified and unmodified peptides (Figure 6a). The FDR and PEP for modified PSMs identified by G-PTM-D were also smaller than those for pMatch and MODa (Figures 6b,c), indicating higher confidence by G-PTM-D. In addition, G-PTM-D detected more modification types compared with pMatch and MODa (Supplementary Table S3). The modification masses in MODa are in 1 Da intervals, limiting its ability to distinguish different modifications with close mass shifts. Because pMatch uses a spectral library constructed from identified spectra, instead of the entire database, to perform the wide-tolerance search, its search speed is much faster than that of G-PTM-D. However, the use of the spectral library prevents the detection of modified peptides when the unmodified forms are not identified in advance.
G-PTM-D offers a number of additional advantages compared with other PTM identification software tools. The Morpheus algorithm employed with G-PTM-D accepts up to ten modifications per peptide, while the maximum number we detected in all the data sets was seven. Thus the search algorithm does not effectively limit the identification of multiply modified peptides. The fact that G-PTM-D can detect peptides that contain more than one modification extends its analytical capability, especially in cases where different modification types coexist within a single peptide. In addition, most other software tools (such as MS-Alignment,24 ModifiComb,6 MODa,11 PeaksPTM,26 DeltAMT,10 and pMatch9) require the coexistence of the modified and unmodified forms of a peptide in the sample, while G-PTM-D does not. Furthermore, ModifiComb and DeltAMT cannot detect modifications when the modified and unmodified forms are offline separated into different fractions, while G-PTM-D is able to combine any number of fractions in the same search.
In summary, the G-PTM-D search strategy is able to reveal a wide variety of site-specific modifications with high confidence in deep proteomic data sets from unenriched samples. It achieves this by searching for the presence or absence of modifications only at either already curated or at potential new sites discovered in a wide tolerance search. This search strategy greatly reduces the search space compared with conventional PTM variable searches and provides increased confidence in the identification of modified peptides. Importantly, no pre-enrichment of samples for particular PTM types is required, thus providing a broad and unbiased view of a wide range of modifications. G-PTM-D provides a powerful new tool for the identification and discovery of protein variation.
Acknowledgments
We thank the Mann group for providing the deep-coverage MS/MS data for the four common human cell lines used in this study. We thank Dr. Yan Fu and Dr. Eunok Paek for help with questions regarding the pMatch and MODa algorithms, respectively. We also thank Peter Baker for uploading the data to MS-Viewer. This work was supported by the following National Institutes of Health grants: R01GM103315 and R01GM114292 from the National Institute of General Medical Sciences, and R01 DC010777 and R01 DC010777-S1 from the National Institute on Deafness and Other Communication Disorders.
Supporting Information Available
The Supporting Information is available free of charge on the ACS Publications website at DOI: 10.1021/acs.jproteome.6b00034.
Supplementary Notes. Acquiring amino acid specificity information for unknown modifications. Evaluation of bias for identification of modified peptides. Supplementary Figure S1. Histograms of ΔM searched with ±1000 Da or ±200 Da precursor mass tolerances. Supplementary Figure S2. Comparison of modified spectra identification by G-PTM or G-PTM-D. Supplementary Figure S3. PEP for modified peptides as a function of the “ratio of matching products”. Supplementary Figure S4. Histograms of the number of unique peptides (all or modified, target or decoy) against Morpheus score, for the four human cell lines. Supplementary Figure S5. Plots of the distributions of mass errors, search scores, and Q values between modified and unmodified PSMs. Supplementary Figure S6. An annotated spectrum that is assigned differently in the first- and second-round searches. (PDF)
Supplementary Table S1. Modification types identified for the Jurkat data set. Supplementary Table S2. Modified PSMs with MS-viewer links for the Jurkat data set. Supplementary Table S3. Modification types identified for the Matrigel data set. (ZIP)
Supplementary Software. Scripts and Instruction for G-PTM-D implementation. (ZIP)
Author Contributions
Q.L. edited the Perl scripts, performed all database search analyses, processed the results for publication, and wrote the manuscript. M.R.S. conceived of the concept of combining UniProt curated database with wide precursor tolerance search, wrote the initial Perl scripts, and edited the manuscript. C.D.W. modified the Morpheus search software to allow wide precursor tolerance and different data formats. B.L.F. contributed to discussion of the concept and results, helped with figures, and edited the manuscript. L.V.S. performed the analysis of score, delta mass, and Q-value distributions for unmodified and modified PSMs. M.S. helped perform MS analyses of the Jurkat and Matrigel samples. L.M.S. edited the manuscript and directed the entire project.
The authors declare no competing financial interest.
Author Status
‡ No affiliation.
Supplementary Material
References
- Olsen J. V.; Mann M. Status of large-scale analysis of post-translational modifications by mass. Mol. Cell. Proteomics 2013, 12, 3444–3452. 10.1074/mcp.O113.034181. [DOI] [PMC free article] [PubMed] [Google Scholar]
- Shortreed M. R.; Wenger C. D.; Frey B. L.; Sheynkman G. M.; Scalf M.; Keller M. P.; Attie A. D.; Smith L. M. Global identification of protein post-translational modifications in a single-pass database search. J. Proteome Res. 2015, 14, 4714–4720. 10.1021/acs.jproteome.5b00599. [DOI] [PMC free article] [PubMed] [Google Scholar]
- Cesnik A. J.; Shortreed M. R.; Sheynkman G. M.; Frey B. L.; Smith L. M. Human proteomic variation revealed by combining RNA-Seq proteogenomics and global post-translational modification (G-PTM) search strategy. J. Proteome Res. 2016, 15, 800–808. 10.1021/acs.jproteome.5b00817. [DOI] [PMC free article] [PubMed] [Google Scholar]
- Gelse K.; Poschl E.; Aigner T. Collagens--structure, function, and biosynthesis. Adv. Drug Delivery Rev. 2003, 55, 1531–1546. 10.1016/j.addr.2003.08.002. [DOI] [PubMed] [Google Scholar]
- Shoulders M. D.; Raines R. T. Collagen structure and stability. Annu. Rev. Biochem. 2009, 78, 929–958. 10.1146/annurev.biochem.77.032207.120833. [DOI] [PMC free article] [PubMed] [Google Scholar]
- Savitski M. M.; Nielsen M. L.; Zubarev R. A. ModifiComb, a new proteomic tool for mapping substoichiometric post-translational modifications, finding novel types of modifications, and fingerprinting complex protein mixtures. Mol. Cell. Proteomics 2006, 5, 935–948. 10.1074/mcp.T500034-MCP200. [DOI] [PubMed] [Google Scholar]
- Baumgartner C.; Rejtar T.; Kullolli M.; Akella L. M.; Karger B. L. SeMoP: a new computational strategy for the unrestricted search for modified peptides using LC-MS/MS data. J. Proteome Res. 2008, 7, 4199–4208. 10.1021/pr800277y. [DOI] [PMC free article] [PubMed] [Google Scholar]
- Chen Y.; Chen W.; Cobb M. H.; Zhao Y. PTMap--a sequence alignment software for unrestricted, accurate, and full-spectrum identification of post-translational modification sites. Proc. Natl. Acad. Sci. U. S. A. 2009, 106, 761–766. 10.1073/pnas.0811739106. [DOI] [PMC free article] [PubMed] [Google Scholar]
- Ye D.; Fu Y.; Sun R.; Wang H.; Yuan Z.; Chi H.; He S. Open MS/MS spectral library search to identify unanticipated post-translational modifications and increase spectral identification rate. Bioinformatics 2010, 26, i399–i406. 10.1093/bioinformatics/btq185. [DOI] [PMC free article] [PubMed] [Google Scholar]
- Fu Y.; Xiu L.; Jia W.; Ye D.; Sun R.; Qian X.; He S. DeltAMT: a statistical algorithm for fast detection of protein modifications from LC-MS/MS data. Mol. Cell. Proteomics 2011, 10, M110.000455. 10.1074/mcp.M110.000455. [DOI] [PMC free article] [PubMed] [Google Scholar]
- Na S.; Bandeira N.; Paek E. Fast multi-blind modification search through tandem mass spectrometry. Mol. Cell. Proteomics 2012, 11, M111.010199. 10.1074/mcp.M111.010199. [DOI] [PMC free article] [PubMed] [Google Scholar]
- Chick J. M.; Kolippakkam D.; Nusinow D. P.; Zhai B.; Rad R.; Huttlin E. L.; Gygi S. P. A mass-tolerant database search identifies a large proportion of unassigned spectra in shotgun proteomics as modified peptides. Nat. Biotechnol. 2015, 33, 743–749. 10.1038/nbt.3267. [DOI] [PMC free article] [PubMed] [Google Scholar]
- Wenger C. D.; Coon J. J. A proteomics search algorithm specifically designed for high-resolution tandem mass spectra. J. Proteome Res. 2013, 12, 1377–1386. 10.1021/pr301024c. [DOI] [PMC free article] [PubMed] [Google Scholar]
- Wang L.; Li D.; Fu Y.; Wang H.; Zhang J.; Yuan Z.; Sun R.; Zeng R.; He S.; Gao W. pFind 2.0: a software package for peptide and protein identification via tandem mass spectrometry. Rapid Commun. Mass Spectrom. 2007, 21, 2985–2991. 10.1002/rcm.3173. [DOI] [PubMed] [Google Scholar]
- Sheynkman G. M.; Shortreed M. R.; Frey B. L.; Smith L. M. Discovery and mass spectrometric analysis of novel splice-junction peptides using RNA-Seq. Mol. Cell. Proteomics 2013, 12, 2341–2353. 10.1074/mcp.O113.028142. [DOI] [PMC free article] [PubMed] [Google Scholar]
- Desiere F.; Deutsch E. W.; King N. L.; Nesvizhskii A. I.; Mallick P.; Eng J.; Chen S.; Eddes J.; Loevenich S. N.; Aebersold R. The PeptideAtlas project. Nucleic Acids Res. 2006, 34, D655–658. 10.1093/nar/gkj040. [DOI] [PMC free article] [PubMed] [Google Scholar]
- Geiger T.; Wehner A.; Schaab C.; Cox J.; Mann M. Mol. Cell. Proteomics 2012, 11, M111.014050. 10.1074/mcp.M111.014050. [DOI] [PMC free article] [PubMed] [Google Scholar]
- Li Q.; Uygun B. E.; Geerts S.; Ozer S.; Scalf M.; Gilpin S. E.; Ott H. C.; Yarmush M. L.; Smith L. M.; Welham N. V.; Frey B. L. Proteomic analysis of naturally-sourced biological scaffolds. Biomaterials 2016, 75, 37–46. 10.1016/j.biomaterials.2015.10.011. [DOI] [PMC free article] [PubMed] [Google Scholar]
- Käll L.; Storey J. D.; MacCoss M. J.; Noble W. S. Posterior error probabilities and false discovery rates: two sides of the same coin. J. Proteome Res. 2008, 7, 40–44. 10.1021/pr700739d. [DOI] [PubMed] [Google Scholar]
- Everett L. J.; Bierl C.; Master S. R. Unbiased statistical analysis for multi-stage proteomic search strategies. J. Proteome Res. 2010, 9, 700–707. 10.1021/pr900256v. [DOI] [PubMed] [Google Scholar]
- Choi H.; Nesvizhskii A. I. False discovery rates and related statistical concepts in mass spectrometry-based proteomics. J. Proteome Res. 2008, 7, 47–50. 10.1021/pr700747q. [DOI] [PubMed] [Google Scholar]
- Tsur D.; Tanner S.; Zandi E.; Bafna V.; Pevzner P. A. Identification of post-translational modifications by blind search of mass spectra. Nat. Biotechnol. 2005, 23, 1562–1567. 10.1038/nbt1168. [DOI] [PubMed] [Google Scholar]
- Han X.; He L.; Xin L.; Shan B.; Ma B. PeaksPTM: Mass Spectrometry-Based Identification of Peptides with Unspecified Modifications. J. Proteome Res. 2011, 10, 2930–2936. 10.1021/pr200153k. [DOI] [PubMed] [Google Scholar]
Associated Data
This section collects any data citations, data availability statements, or supplementary materials included in this article.


