Abstract
Thyroid-stimulating hormone (TSH)-secreting tumors (TSH-omas) are pituitary tumors that constitutively secrete TSH. The molecular genetics underlying this abnormality are not known. We discovered that a knockin mouse harboring a mutated thyroid hormone receptor (TR) β (PV; TRβPV/PV mouse) spontaneously developed TSH-omas. TRβPV/PV mice lost the negative feedback regulation with highly elevated TSH levels associated with increased thyroid hormone levels (3,3′,5-triiodo-l-thyronine [T3]). Remarkably, we found that mice deficient in all TRs (TRα1−/− TRβ−/−) had similarly increased T3 and TSH levels, but no discernible TSH-omas, indicating that the dysregulation of the pituitary-thyroid axis alone is not sufficient to induce TSH-omas. Comparison of gene expression profiles by cDNA microarrays identified overexpression of cyclin D1 mRNA in TRβPV/PV but not in TRα1−/− TRβ−/− mice. Overexpression of cyclin D1 protein led to activation of the cyclin D1/cyclin-dependent kinase/retinoblastoma protein/E2F pathway only in TRβPV/PV mice. The liganded TRβ repressed cyclin D1 expression via tethering to the cyclin D1 promoter through binding to the cyclic AMP response element-binding protein. That repression effect was lost in mutant PV, thereby resulting in constitutive activation of cyclin D1 in TRβPV/PV mice. The present study revealed a novel molecular mechanism by which an unliganded TRβ mutant acts to contribute to pituitary tumorigenesis in vivo and provided mechanistic insights into the understanding of pathogenesis of TSH-omas in patients.
The thyroid hormone T3 (3,3′,5-triiodo-l-thyronine) is critical for growth, differentiation, and development and for maintenance of metabolic homeostasis. Thyroid hormone receptors (TRs) act as ligand-activated transcription factors and occupy a central position in mediating the functions of T3. TRs are encoded by two genes, TRα and TRβ, located on human chromosomes 17 and 3, respectively (4, 8). Alternative splicing of the primary transcripts gives rise to four major T3-binding TR isoforms: TRα1, β1, β2, and β3. These isoforms differ in their length and amino acid sequence at the amino terminal A/B domain but bind T3 with high affinity to mediate gene regulatory activity. Like other nuclear receptors, these isoforms have an amino terminal A/B domain, a central DNA-binding domain, and a carboxyl-terminal ligand-binding domain. The carboxyl-terminal region also contains multiple contact surfaces that are important for dimerization with its partner, the retinoid X receptor, and for interactions with corepressors and coactivators (4, 8, 20). The expression of TR isoforms is tissue dependent and developmentally regulated (4, 8).
Thyroid-stimulating hormone (TSH)-secreting pituitary tumors (TSH-omas) represent about 2% of all pituitary adenomas in humans. TSH-omas are usually large at diagnosis and are associated with headaches and visual field disturbances. Because diagnosis occurs late in the natural course, the rate of curative surgical resection of TSH-omas remains under 50% (5, 6).
The molecular genetics underlying this abnormality are not well understood. Somatic mutations of the TRβ gene have been found in several patients with TSH-omas. Safer et al. reported R438H mutation in the TRβ gene in a patient with pituitary adenoma (26). This mutation has also been reported in other patients with resistance to thyroid hormone (10). The R438H mutant has impairment in T3 binding and exhibits dominant negative activity (10). Recently, Ando et al. identified mutated TRβ in the TSH-omas of two patients (2, 3). One patient had a somatic mutation in the ligand-binding domain of TRβ2 (His450Tyr) (2), and the other patient had a 165-bp deletion within the sixth exon of the ligand-binding domain of TRβ2 (3). Both TRβ mutants had impaired T3 binding and abnormal regulation of TSHβ and α-glycoprotein common subunit (α-GSU) gene expression. Furthermore, both TRβ mutants interfered with the transcriptional activity of normal TRβ (2, 3). These findings suggest that TRβ mutants could play an important role in the development of TSH-omas.
The availability of a knockin mutant mouse harboring a PV mutation in the TRβ gene locus (TRβPV mouse) (17) has provided an opportunity to address the role of TRβ mutants in the pathogenesis of TSH-omas. The PV mutation was identified in a patient with resistance to thryroid hormone (25). TRβPV/PV mice exhibited severe dysregulation of the hypothalamic-pituitary-thyroid axis with 9- to 15-fold-increased thyroid hormone levels associated with 400- to 500-fold-elevated circulating serum TSH levels (17). Remarkably, as TRβPV/PV mice aged, they spontaneously developed TSH-omas. Mice deficient in both TRα1 and TRβ (TRα1−/− TRβ−/− mice) that also exhibited a similar extent in the increase of serum TSH and thyroid hormone did not develop TSH-omas, indicating that the dysregulation of the pituitary-thyroid axis alone is not sufficient to mediate the pathogenesis of TSH-omas. Comparison of gene expression profiles by cDNA microarrays indicated distinct altered gene expression patterns in the pituitaries of these two mutant mice. Importantly, overexpression of cyclin D1 mRNA was detected in TRβPV/PV but not in TRα1−/− TRβ−/− mice. The overexpression of cyclin D1 protein was accompanied by concurrent activation of the cyclin-dependent kinase (CDK)/retinoblastoma (Rb) protein/E2F pathway only in TRβPV/PV mice. The molecular mechanism by which PV mediated aberrant activation of cyclin D1 expression in TRβPV/PV mice was found to be due at least in part to the loss of the negative regulation of the cyclin D1 promoter activity by wild-type TR. Thus, cyclin D1 is one of the oncogenes that mediate the tumorigenesis of TSH-omas. The present study provides the first direct evidence in vivo to support the oncogenic functions of TRβ mutants.
MATERIALS AND METHODS
Mouse strains.
All aspects of animal care and experimentation were approved by the National Cancer Institute Animal Care and Use Committee. The mice harboring the TRβPV gene (TRβPV mice) were prepared via homologous recombination, as previously described (17). TRβPV mice are derived from the cross of C57BL/6 and 129/SvJ mice (17). TRβPV/PV mice used in the present study were offspring of many generations of intersibling mating over 6 years (more than 30 generations). Mice deficient in both TRα1 and TRβ (TRα1−/− TRβ−/− mice) (13) were derived from the cross of TRα1+/− and TRβ+/− mice obtained from B. Vennström (Karolinska Institute, Stockholm, Sweden) and D. Forrest (Mt. Sinai School of Medicine, New York, N.Y.). Similar to TRβPV/PV mice, these mice were from the cross of C57BL/6 and 129/SvJ mice. TRα1−/− TRβ−/− mice used in the present study were offspring of many generations of intersibling mating of TRα1+/− and TRβ+/− mice. Therefore, TRβPV/PV mice and TRα1−/− TRβ−/− mice have very similar genetic backgrounds. Littermates were used in the phenotypic characterization in all studies. Genotyping was carried out by PCRs as previously described (13, 17).
Hormone assays.
Total serum l-thyroxine (TT4) and total T3 (TT3) were determined by using a Clinical Assay GammaCoat T3 or T4 125I RIA Kit (DiaSolin, Stillwater, Minn.), according to the manufacturer's instructions. Serum TSH levels were measured as previously described with minor modifications (17, 18) but with the RIA kit purchased from the National Hormone and Peptide Program, Harbor-UCLA Medical Center (Torrance, Calif.). Briefly, 50-μl serum samples were incubated with anti-mouse TSH antiserum for 18 h at room temperature. Rat TSH tracer (ICN Diagnostics, Irvine, Calif.) was added and incubated for 4 h. Normal guinea pig serum and anti-guinea pig antiserum were added (Antibodies Incorporated, Davis, Calif.). After 2 h of incubation, immunoprecipitates were washed with phosphate-buffered saline (Ca2+ and Mg2+ free), and the radioactivity was measured with a Gamma 5500B counter (Beckman Instruments, Inc., Fullerton, Calif.). Sera from TRβPV/PV and TRα1−/− TRβ−/− mice were diluted with hyperthyroid mouse serum to obtain appropriate TSH concentrations for the assay. The interassay and intra-assay variations were less than 5%.
Preparation of RNA and quantitative real-time reverse transcription-PCR (RT-PCR).
Total RNA of pituitaries from TRβPV/PV mice, TRα1−/− TRβ−/− mice, or wild-type siblings was prepared with TRIzol (Invitrogen, Carlsbad, Calif.) according to the manufacturer's instructions. The LightCycler-RNA amplification kit and SYBR Green I was used according to the manufacturer's protocols (Roche Molecular Biochemicals, Mannheim, Germany). A typical reaction mixture contained 5.2 μl of H2O, 2.4 μl of MgCl2 stock solution, 4 μl of LightCycler-RT-PCR Mix SYBR, 2 μl of Resolution solution, 0.4 μl of LightCycler-RT-PCR Enzyme Mix, 2.5 μl of forward primer (2 μM), 2.5 μl of reverse primer (2 μM), and 1 μl of total RNA (200 ng). The thermal cycle initiated a reverse transcription on RNA templates at 55°C for 30 min, followed by amplification with the following cycles: 95°C for 15 s, 58°C for 30 s, 72°C for 30 s, and heating from 65 to 95°C with a heating rate of 0.1°C/s and a cooling step to 40°C.
Primers for target genes and endogenous control genes were chosen with the assistance of the GENETYX-MAC Multi-Sequences computer program, version 9 (Software Development Co., Ltd., Tokyo, Japan).
The primers used were as follows. For cyclin D1, the forward primer was 5′-TACCGCACAACGCACTTTCT-3′ and the reverse primer was 5′-TCCACATCTCGCACGTCGGT-3′. For glyceraldehyde-3-phosphate dehydrogenase (GAPDH), the forward primer was 5′-CCCTTCATTGACCTCAACTACAT-3′ and the reverse primer was 5′-ACAATGCCAAAGTTGTCATGGAT-3′.
After PCR amplification, melting-curve analysis was carried out to determine the PCR products. Under these conditions, the crossing points were all below 30 cycles of those that were in the linear range of amplification. Experiments were performed with duplicates for each data point. Relative quantification was performed against the expression of the endogenous control gene, based on the crossing point of the sample and the efficiency of the PCR.
Plasmid construction and transfection.
To build promoter and reporter fusion constructs, different portions of the cyclin D1 promoter region were synthesized by PCR. The luciferase constructs pD1Δ-944pXP2 and pD1Δ-78pXP2 containing human cyclin D1 promoter were obtained from Rolf Muller (Philipps-Universität Marburg, Germany) and were used as PCR templates. The upstream primers h-C-D1-P7 (5′-CGC GGA TCC AAA AAT GAG TCA GAA TGG-3′) and h-C-D1-P6 (5′-CGC GGA TCC TAA CAA CAG TAA CGT CAC-3′) and the downstream primers h-C-D1-P8 (5′-CGC GGA TCC CCC CTG TTG TTA AGC AAA-3′) and h-C-D1-P2-3 (5′-CGC GGA TCC CCC CTG GGG AGG GC-3′), all of which have BamHI sites (underlined in the sequences above), were used to amplify the promoter region of cyclin D1. To generate construct pD1Δ-944∼-52pXP2, the PCR product amplified by h-C-D1-P7 and h-C-D1-P8 was digested with BamHI and cloned into the pXP2 reporter. To generate construct pD1Δ-61pXP2, the PCR product amplified by h-C-D1-P6 and h-C-D1-P2 to 3 was digested with BamHI and inserted into the pXP2 reporter.
For transfection, CV-1 cells (4 × 10⁵/well) or α-TSH cells (1.2 × 10⁶/well) (kindly provided by E.C. Ridgway, University of Colorado) were seeded into six-well plates (2 ml of medium/plate) plate for 5 or 2 h, respectively, before transfection. The reporter plasmid D1Δ-944pXP2 (1 μg) was transfected with 0.2 μg of TRβ1 (pCLC51) or PV (pCLC51-PV) into cells. Empty vectors were used to supplement equal amounts of DNA in each transfection. Transfection was carried out by using FuGENE 6 (Roche Molecular Biochemicals) according to the manufacturer's protocol. Five hours after transfection, 2 ml of fresh Dulbecco's minimal essential medium with 20% T3-depleted fetal bovine serum (2XTd serum) and 20 mM HEPES (for α-TSH cells only) was added to each well. Cultures were induced with 100 nM T3 24 h after transfection. Forty-eight hours posttransfection, cells were lysed in reporter lysis buffer (Promega, Madison, Wis.). Lysates were assayed for luciferase activity and normalized to total protein concentration. All experiments were performed in triplicate and repeated three times.
Microarrays, hybridization, and scanning.
The mouse arrays contained 30,336 cDNAs. Hybridization, scanning, and image analysis were performed as described previously (www.nhgri.nih.gov/DIR/microarray) (7, 19, 23). Briefly, fluorescence-labeled cDNA was synthesized from 20 μg of pooled RNA of 10 wild-type mice and 3 TRβPV/PV mice or 4 TRα1−/− TRβ−/− mice by oligo(dT)-primed polymerization in the presence of aminoallyl-dUTP (Amersham Biosciences, Piscataway, N.J.) and coupled with either Cy-3 or Cy-5. Image analyses were performed using DeArray software (Signal Analytics, Vienna, Va.) (7, 23). The two fluorescent images (red and green channels) obtained from one array constituted the raw data from which differential gene expression ratio values were calculated. The ratios of the red intensity to the green intensity (R/G ratios) for all targets were determined, and the data were stored in a FileMaker Pro database (FileMaker, Santa Clara, Calif.). The ratio values within each array were normalized to a median value of 1. The ratio values associated with quality factors between 0.5 and 1.0 were included for further analyses.
Western blot analysis.
For Western blot analysis, TRβPV/PV and TRα1−/− TRβ−/− mice and their gender-matched littermates were sacrificed to obtain the pituitaries. The pituitary was washed with phosphate-buffered saline (Ca2+ and Mg2+ free) and homogenized on ice in cell lysis buffer containing 50 mM Tris, 100 mM HCl, 0.1% Triton X-100, 0.2 μM okadaic acid, 100 mM NaF, 0.2 mM Na3VO4, and a proteinase inhibitor tablet (Complete Mini EDTA-free; Roche), followed by incubation of the tissue on ice for 10 min with occasional shaking. The lysate was then centrifuged for 15 min at 12,000 × g at 4°C, and the supernatant was collected. The protein concentration was determined by the method of Bradford (Pierce Chemical Co., Rockford, Ill.) with bovine serum albumin (Pierce Chemical Co.) as the standard. For detection of cyclin D1, CDK4, CDK6, p21, p27, and the Rb protein, the samples (each, 50 μg) were separated by sodium dodecyl sulfate-polyacrylamide gel electrophoresis (SDS-PAGE). After electrophoresis, proteins were electrotransferred to a polyvinylidene difluoride membrane (Immobilon-P; Millipore Corporation, Bedford, Mass.) with Transblot buffer (Quality Biological, Inc., Gaithersburg, Md.). After being blocked with 10% nonfat dry milk (Bio-Rad Laboratories, Inc., Hercules, Calif.), membranes were incubated with monoclonal antibody against cyclin D1 (1:100 dilution) (sc-450), CDK4 (1:100 dilution) (sc-260), CDK6 (1:100 dilution) (sc-7180), p21 (1:100 dilution) (sc-6246), p27 (1:100 dilution) (sc-1641), or with polyclonal antibody against Rb (1:100 dilution) (sc-50). These antibodies were all from Santa Cruz Biotechnology, Inc. (Santa Cruz, Calif.). After being washed, the membranes were incubated with horseradish peroxidase-conjugated goat anti-mouse immunoglobulin G (IgG) or anti-rabbit IgG (1: 2,000 dilution; Amersham Biosciences) as the secondary antibody and subsequently detected by means of an ECL system (Amersham Biosciences). For control of protein loading, the blots were stripped and rereacted with rabbit polyclonal antibodies against protein disulfide isomerase (PDI; 0.5 μg/ml of anti-PDI antibody 3632) (9).
For coimmunoprecipitation of CREB and TRβ1 or PV, CV-1 cells were transfected with the expression vector of CREB (pSG5-CREB, 4 μg) and Flag-TRβ1 (pCMVZUS-Flag-TR461, 4 μg; a generous gift from Brian West) or PV (pCLC51PV, 4 μg) in the absence or presence of T3 (100 nM) as described above. Cells were extracted with lysis buffer (100 mM Tris, 500 mM NaCl, 10 mM EDTA, and 1% NP-40) in the presence of 0.2 μM okadaic acid, 100 mM NaF, 0.2 mM Na3VO4, and a proteinase inhibitor tablet (Complete Mini EDTA-free; Roche). Cellular lysates (each, 600 μg) were immunoprecipitated with 4 μg of anti-CREB antibody [CREB-1 (240), catalogue no. SC-58; Santa Cruz Biotechnology], followed by Western blot analysis as described above using anti-Flag antibody (anti-Flag M2, catalogue no. F-3165, Sigma Co.,) for detecting Flag-TRβ1 or anti-PV antibody (monoclonal antibody 302) to detect PV.
Analysis of the interaction of cyclic AMP (cAMP) response element-binding (CREB) protein with TRβ1 or PV.
A glutathione S-transferase (GST)/glutathione (GSH)-binding system was used to assess the physical interaction of CREB with TRβ1 or PV. Binding of 35S-labeled CREB to GST-TRβ1 or GST-PV was carried out similarly as described previously, with modifications (30). Escherichia coli-expressed GST (2 μg) or GST-TRβ1 (2 μg) or GST-PV (2 μg) noncovalently bound to GSH-Sepharose beads was preincubated in 500 μl of buffer (20 mM Tris-Cl [pH 7.5], 100 mM NaCl, 2 mM EDTA, 0.1% Lubrol, 2 mM dithiothreitol, 0.05% bovine serum albumin, 5% glycerol) at 4°C for 1 h. Untreated Sepharose bead suspension was added to normalize the volume of Sepharose beads per samples. In vitro-translated 35S-labeled CREB (10 μl) synthesized by using the TNT kit was added to the above pretreated beads in 500 μl of the same buffer. The mixture was incubated at 4°C for 2 h with constant shaking. The beads were washed five times with 1 ml of ice-cold buffer (2.5% sucrose, 2.5 mM Tris-Cl [pH 7.4], 2.5 mM EDTA, 0.25 M NaCl, and 1% Lubrol) and boiled in SDS-sample buffer. The proteins were analyzed by SDS-PAGE. The gel was dried and autoradiographed.
For the GAL4-CREB reporter assay, plating of cells and transfection was carried out similarly as described. GAL4 or GAL4-CREB (0.2 μg) and the expression vector of TRβ1 or PV (0.2 μg) or the empty vector (pCDM8) were cotransfected with the reporter plasmid of GAL4 (pE1b-4XUAS-luc). The luciferase activity was determined as shown above. All experiments were performed in triplicate and repeated three times.
Histological, immunohistochemical, and ultrastructural analysis.
Mice were sacrificed at different ages, and the pituitaries were dissected, fixed in 10% neutral buffered formalin, and subsequently embedded in paraffin. Five-micrometer-thick sections were prepared and stained with hematoxylin and eosin. In addition, paraffin sections were processed for immunohistochemistry. After antigen retrieval with acid citrate buffer at 95°C for 20 min, sections were incubated with rabbit anti-mouse TSH (Biogenesis, Poole, United Kingdom) or rabbit anti-Ki67 (NeoMarkers, Fremont, Calif.), followed by indirect labeling with horseradish peroxidase-labeled anti-rabbit IgG (Jackson ImmunoResearch, West Grove, Pa.) according to standard methods. For transmission electron microscopy, pituitaries were fixed in glutaraldehyde, postfixed in osmium tetroxide, and processed into Epon-Araldite by standard methods. Thin sections were counterstained with uranyl acetate and lead citrate.
Statistical analysis.
All data are expressed as means ± standard error of the mean (SEM). Statistical analysis was performed with the use of analysis of variance (SAS Institute, Inc., Cary, N.C.) with the Scheffe protected least-significant difference post hoc test, as appropriate. Differences with P values of <0.05 were considered significant.
RESULTS
TRβPV/PV mice spontaneously develop pituitary adenomas.
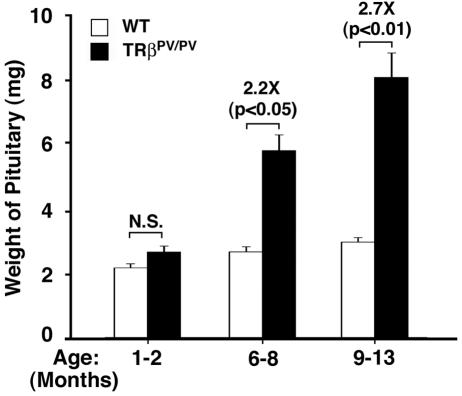
TRβPV/PV mice manifest severe dysfunction of the pituitary-thyroid axis in that they have an extraordinarily high serum concentration of TSH despite highly elevated thyroid hormone levels (17). Consistent with the elevated TSH levels, the number of TSH-secreting cells was increased in the pituitaries of TRβPV/PV mice at the ages of 2 to 3 months (17). In this study, we found that, compared with the age-matched wild-type mice, the size of the pituitaries of TRβPV/PV mice was significantly enlarged 2.2 and 2.7 fold at the ages of 6 to 8 and 9 to 13 months, respectively (Fig. 1). A relatively small increase in the wild-type mice between the ages of 1 to 2 months and 6 to 8 months (1.2 fold; P < 0.05) and between the ages of 1 to 2 and 9 to 13 months (1.38 fold; P < 0.001) was detected. However, no significant differences in the weights of pituitaries between the ages of 6 to 8 and 9 to 13 months were observed (P = 0.32).
FIG. 1.
Age-dependent increase in the weight of the pituitary glands of TRβPV/PV mice. The weight of the pituitary was compared between TRβPV/PV mice and those of wild-type siblings at the ages indicated. The weight of the pituitary was markedly increased in older TRβPV/PV mice (solid bars) but not in wild-type mice (open bars). The differences in the pituitary weights between TRβPV/PV mice and wild-type siblings are significant in mice aged >6 months (P values are indicated). The number of wild-type mice used was as follows: 1 to 2 months, n = 18; 6 to 8 months, n = 6; and 9 to 13 months, n = 26. The number of TRβPV/PV mice used was as follows: 1 to 2 months, n = 11; 6 to 8 months, n = 14; and 9 to 13 months, n = 19. N.S., not significant.
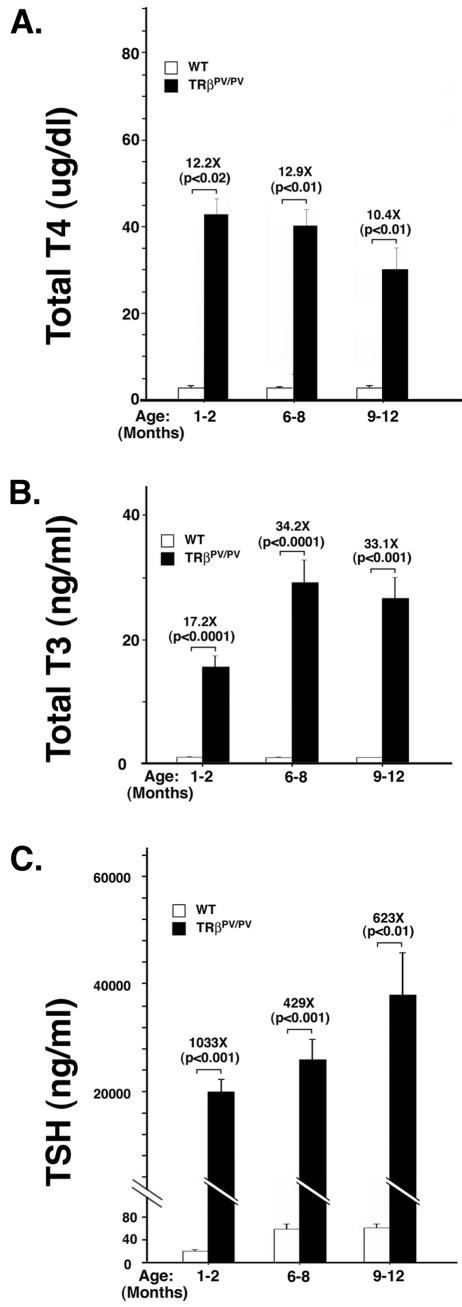
To understand whether the dysregulation of the pituitary-thyroid axis is affected by aging, we determined thyroid function tests in an age-dependent manner. Figure 2A shows that compared with levels in the wild-type littermates, the serum TT4 level at the younger ages of 1 to 8 months was 12.2- to12.9-fold higher and at the age of 9 to 12 months was 10.4-fold higher. The changes among different ages, however, were not significant. Similar results were found in serum TT3 levels in TRβPV/PV mice. Compared with the wild-type siblings, TT3 was increased from 17.2 fold at the ages of 1 to 2 months to 33.1 and 34.2 fold in the older mice (Fig. 2B). The increase in TT3 is higher than that in TT4. Figure 2C shows that, compared with wild-type siblings, serum TSH concentrations of TRβPV/PV mice at the age of 1 to 2 months were 1,033-fold higher and at the older age of 6 to 12 months were 429- to 623-fold higher. However, no significant age effect for these increases was observed (P = 0.9 between the ages of 1 to 2 and 6 to 8 months and P = 0.4 between the ages of 6 to 8 and 9 to 12 months). In contrast, serum TSH concentrations of wild-type siblings increased significantly between the ages of 1 to 2 and 6 to 12 months (∼3-fold; P < 0.01). These data indicate that the RTH in the pituitary-thyroid axis occurs at an early age and persists at least up to 1 year of age.
FIG. 2.
Thyroid function tests of TRβPV/PV mice at different ages. Serum TT4 (A), TT3 (B), and TSH (C) levels of TRβPV/PV mice and wild-type siblings were determined at the ages indicated as described inMaterials and Methods. The differences in the TT4, TT3, and TSH levels between TRβPV/PV mice and the wild-type siblings were significant (P values indicated), but the increases were not significant among different ages (P = 0.2 to 0.9). The number of wild-type mice used was as follows: 1 to 2 months, n = 24; 6 to 8 months, n = 21; and 9 to 13 months, n = 28. The number of TRβPV/PV mice was as follows: 1 to 2 months, n = 6 to 17; 6 to 8 months, n = 17 to 18; and 9 to 12 months, n = 13.
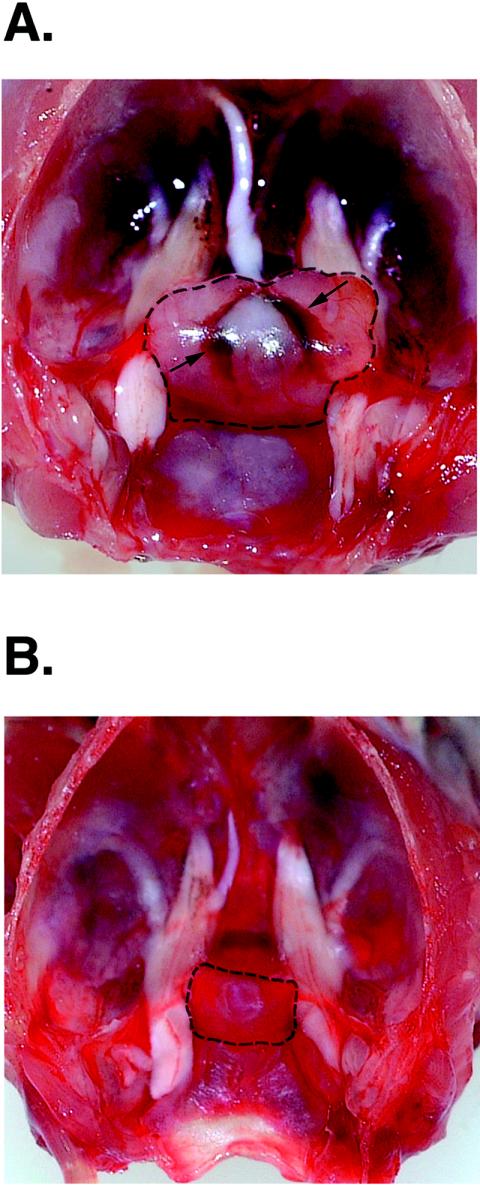
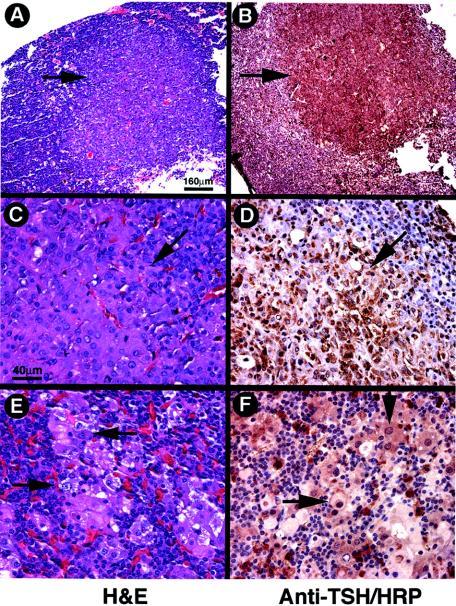
A representative example of the pituitary of TRβPV/PV mice is shown in Fig. 3. The pituitary was clearly enlarged (13.4 versus 2.3 mg, the weight of pituitary for a wild-type littermate) and appeared highly vascular. Histological analyses indicated that TSH-containing thyroprival cells (enlarged growth-stimulated TSH-producing cells with large nuclei) were in the pituitaries of TRβPV/PV mice, beginning at the age of ∼3 months. As these mutant mice aged (>6 months), various sizes of adenomas staining positively for TSH were also detected in the pituitaries. Adenomas were defined as morphologically homogeneous focal collections of TSH-positive cells with thyroprival morphology without the presence of other adjacent adenohypophyseal cell types in these foci. These varied in size from microscopic foci (microadenomas) to an almost entire replacement of the adenohypophysis with only a thin rim of normal tissue remaining. Representative examples of adenomas are shown in Fig. 4A (stained by hematoxylin and eosin) and B (stained by anti-TSH antibodies). At a higher magnification (Fig. 4D), cells in the all of these adenomas stained heavily for TSH. Fig. 4E (stained by hematoxylin and eosin) and F (stained by anti-TSH antibodies) show examples of large thyroprival cells with pale appearances in other nonadenomatous areas scattered among various other adenohypophyseal cells.
FIG. 3.
Representative example of an enlarged pituitary of a TRβPV/PV mouse (A) compared with that of a wild-type littermate (B). (A) The enlarged pituitary in this TRβPV/PV mouse is outlined. Increased vascularity is also evident (arrows) (pituitary weight, 13.4 mg; age, 12 months). (B) The pituitary of a sex-matched wild-type littermate (pituitary weight, 2.3 mg; age, 12 months).
FIG. 4.
Development of TSH-omas in the pituitaries of TRβPV/PV mice. Panels A, C, and E were stained with hematoxylin and eosin, and panels B, D, and F were stained with anti-TSH antibodies, followed by horseradish peroxidase (HRP) labeling. (A and B) An adenoma is indicated by arrows (note the exclusion of other cell types from this focus). (C and D) Thyroprival cell morphology in the adenoma is shown by arrows. (E and F) Thyroprival cells are scattered in other areas of the pituitary. Magnification, ×39 (A and B); ×157 (C to F). Bar, 160 μm (A); 40 μm (C).
By transmission electron microscopy, the TRβPV/PV mouse pituitaries showed the accumulation of large, oval thyroprival cells containing abundant vacuolated cytoplasm and eccentric nuclei (results not shown). Other adenohypophseal cell types showed no abnormalities.
Immunohistochemical analysis indicated that no major morphological abnormalities were detected in the growth hormone-, prolactin-, adrenocorticotropin-, or follicle-stimulating or luteinizing hormone-immunoreactive cells (data not shown), an indication that the mutation of the TRβ gene results in selective pathological changes in thyrotrophs. Taken together, these findings indicate that the TRβPV/PV mouse spontaneously developed TSH-omas and that this mouse can be used as a model to elucidate the molecular basis of TSH-omas.
Loss of the negative regulation of TSH expression by thyroid hormone alone is not sufficient to induce TSH-omas.
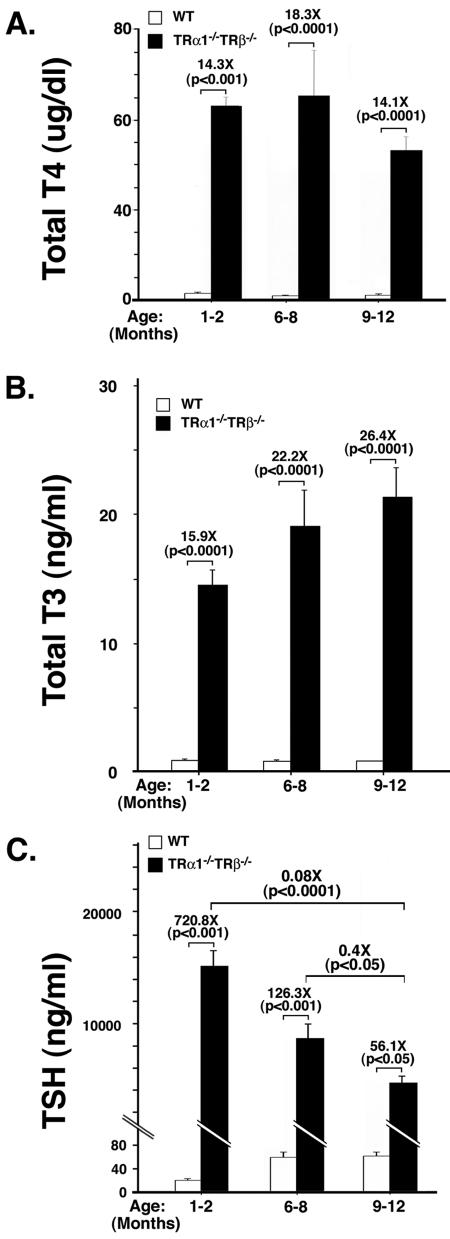
As a first step to understanding the molecular basis of TSH-omas, we asked whether persistent elevation of TSH due to the loss of the negative regulation by thyroid hormone underlies the development of TSH-omas. Toward this end, we took advantage of the mouse line devoid of all TRs (TRα1−/− TRβ−/− mice) that exhibits severe dysfunction of the pituitary-thyroid axis (13). These TRα1−/− TRβ−/− mice have highly elevated serum TSH levels (60- to 160-fold) at the ages of 1 to 5 months in the face of 11- to 30-fold increases of total T3 and T4 levels, respectively (13). Because TSH-omas developed in older TRβPV/PV mice, we therefore determined the thyroid function tests in older TRα1−/− TRβ−/− mice in this study. Figure 5A shows that TT4 was increased in the range of 14- to 18-fold from the ages of 1 to 2 to 9 to 12 months. Similar to those observed for TRβPV/PV mice, the differences in the extent of increased TT4 levels among different ages were not significant. The serum levels of TT3 were also increased, ranging from 15.9 fold at the ages of 1 to 2 months to 26.4 fold in mice with the ages of 9 to 12 months (Fig. 5B). Again, we detected no significant effect of aging on the increase in serum TT3 levels. Figure 5C shows that compared with the age-matched wild-type mice, serum TSH concentrations of TRα1−/− TRβ−/− mice were increased in the range of 728.8 to 56.1 fold in the ages of 1 to 2 to 9 to 12 months. In contrast to an age-dependent increase of TSH in the wild-type mice and TRβPV/PV mice, the increase in serum TSH in older TRα1−/− TRβ−/− mice was relatively decreased as the mice aged. These results indicate that, similar to what was observed for TRβPV/PV mice, the dysfunction of the pituitary-thyroid axis was detected at an early age and persisted to at least 1 year of age.
FIG. 5.
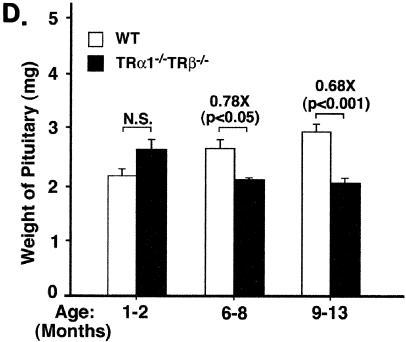
Thyroid function tests of TRα1−/− TRβ−/− mice at different ages and age-dependent decrease in the weight of the pituitary of TRα1−/− TRβ−/− mice. Serum TT4 (A), TT3 (B), and TSH (C) levels of TRα1−/− TRβ−/− mice and wild-type siblings (derived from the cross of TRα1+/− and TRβ+/− mice) were determined at the ages indicated, as described in Materials and Methods. The differences in the TT4, TT3, and TSH levels between TRβPV/PV mice and the wild-type siblings were significant (P values are indicated), but the increases for TT4 and TT3 (except between the ages of 1 to 2 and 6 to 8 months) was not significant among different ages (P = 0.07 to 0.9), whereas the increases in TSH levels was significant among different ages (P values are indicated). The numbers of wild-type mice used were as follows: 1 to 2 months, n = 24; 6 to 8 months, n = 21; and 9 to 13 months, n = 28. The numbers of TRα1−/− TRβ−/− mice were as follows: 1 to 2 months, n = 24 to 27; 6 to 8 months, n = 5 to 9; and 9 to 12 months, n = 12. (D) The weight of the pituitary was compared between TRα1−/− TRβ−/− mice and wild-type siblings at the ages indicated. The weight of the pituitary was significantly decreased in older TRβPV/PV mice with ages of >9 months (solid bars) but not in wild-type siblings (open bars). The differences in the pituitary weight between wild-type and TRα1−/− TRβ−/− mice were significant (P values are indicated). The numbers of wild-type mice were as follows: 1 to 2 months, n = 18; 6 to 8 months, n = 6; and 9 to 12 months, n = 26. The numbers of TRα1−/− TRβ−/− mice were as follows: 1 to 2 months, n = 3; 6 to 8 months, n = 4; and 9 to 13 months, n = 9. N.S., not significant.
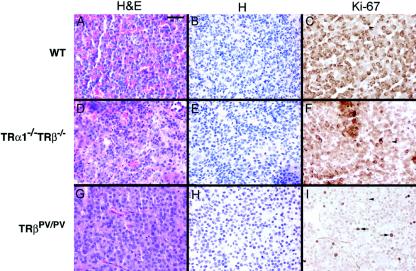
Remarkably, in spite of a similar loss of the negative regulation of TSH by thyroid hormone in both mutant mice, in contrast to TRβPV/PV mice, the size of the pituitaries in the TRα1−/− TRβ−/− mice was significantly reduced by 20 to 30% compared with the age-matched wild-type mice (Fig. 5D). Moreover, histological examination of the pituitary indicates only a few scattered TSH-containing thyroprival cells, with no other abnormalities discernible in TRα1−/− TRβ−/− mice (Fig. 6D to F versus A to C). Specifically, no focal adenomas as defined above were identified. These results suggest that the loss of the negative regulation of TSH by thyroid hormone alone is not sufficient to induce TSH-omas.
FIG. 6.
Ki67 Immunohistochemistry in pituitaries of wild-type, TRβPV/PV, and TRα1−/− TRβ−/− mice. Immunoperoxidase labeling for Ki67 was performed on pituitaries from wild-type (A to C), TRα1−/− TRβ−/− (D to F), and TRβPV/PV (G to I) mice. Panels A, D, and G are stained with hematoxylin and eosin and panels B, E, and H are stained with hematoxylin. Panels A, B, D, and E showed no evidence of adenomas; whereas panels G and H show adenoma cells with enlarged nuclei. Panels C and F show a low level of cell proliferation in wild-type and TRα1−/− TRβ−/− mice, respectively. The anti-Ki67 antibody used showed a background nonspecific cross-reaction with a granule antigen in nonthyrotrophs (C and F), but the level of nuclear labeling was very low (arrowheads). In contrast, nuclear labeling for Ki67 was high in TSH-oma areas (arrows) (6.1% of all nuclei). Bar, 40 μm.
To further compare the biochemical characteristics of the pituitaries in TRβPV/PV and TRα1−/− TRβ−/− mice, analysis for cell proliferation using immunohistochemical labeling for a marker of cell cycling, Ki67, failed to show increased cell cycle progression in TRα1−/− TRβ−/− mice, unlike the high rate of proliferation detected in adenomas in TRβPV/PV mice (Fig. 6I versus F). The percentage of all nuclei in these pituitary sections showing Ki67 positivity was quantitated and found to be <0.3% in sections from wild-type mice (Fig. 6C), <0.3% in TRα1−/− TRβ−/− mice (Fig. 6F), and 6.1% ± 0.08% in adenomas in TRβPV/PV mice (Fig. 6I). The >20-fold increase in the nuclei stained for Ki67 indicated active cell proliferation in adenomas in the pituitaries of TRβPV/PV mice, but not in the thyrotrophs of TRα1−/− TRβ−/− mice.
Contrasting profiles in the alterations of gene expression in the pituitaries of TRβPV/PV and TRα1−/− TRβ−/− mice.
Given the findings that TRβPV/PV mice but not TRα1−/− TRβ−/− mice developed TSH-omas in spite of similarly highly elevated TSH levels associated with increased T4 and T3 levels, we sought to identify altered genes that are differentially expressed in the pituitaries of these two mutant mice. Microarrays consisting of 30,336 mouse cDNAs were used to compare the altered gene expression profiles between these two mutant mice. Only genes with ratios of ≥2 or <0.5 relative to those of wild-type siblings were considered as significantly up- or down-regulated, respectively, and were selected for further analysis. Analyses indicate that threefold more genes were differentially altered in TRβPV/PV mice (total, 560 genes) than in TRα1−/− TRβ−/− mice (total, 176 genes) and that 71% of altered genes in TRβPV/PV mice were up-regulated and 29% were down-regulated. The significantly fewer genes altered in TRα1−/− TRβ−/− mice showed a nearly equal number of genes up- and down-regulated. Only a relatively small number of commonly altered genes were found in both mutant mice (total, 114 genes). Complete lists of genes altered in TRβPV/PV and TRα1−/− TRβ−/− mice are available (unpublished data). The different patterns of gene expression in these mutant mice were further illustrated by the poor correlation between the expression of TRβPV/PV and TRα1−/− TRβ−/− mice as shown in the scatter plot (r = 0.45; unpublished). It shows a general trend of higher expression ratios in TRβPV/PV mice. These contrasting gene expression profiles suggest that the change of function due to the mutations of the TRβ gene led to more extensive alterations in gene expression than did the loss-of-function due to the ablation of all TRs.
To gain insights into the altered cellular pathways associated with tumor development mediated by PV, we classified the named genes that have reported functions. This classification was accomplished by first using controlled vocabularies provided by the Gene Ontology Consortium with the Expression Analysis Systemic Explorer (EASE) software (http://david.niaid.nih.gov/david/ease.htm) (16). The ontology terms with EASE scores of <0.05 that were considered significant are available elsewhere (unpubished data). Three major categories (biological process, molecular function, and cellular component) were identified (unpublished). Under each major category, more detailed cellular processes affected by the expression of PV or the lack of both TRs were illustrated. Thirteen, 9, and 6 processes were identified only for TRβPV/PV mice but not for TRα1−/− TRβ−/− mice, under the categories of biological process, molecular function, and cellular component, respectively. In contrast, three biological process and two molecular function ontology terms were found only for TRα1−/− TRβ−/− mice but not for TRβPV/PV mice. Remarkably, only one common cellular process (Golgi membrane) under the category of cellular component was shared by both mutant mice. Therefore, it is evident that more cellular processes were affected by the mutation of the TRβ gene than by the lack of all TRs and that, except for that one common cellular process, distinct cellular processes are affected by the mutation of the TRβ gene or the loss of TRs.
Overexpression of cyclin D1 mediates the aberrant proliferation of thyrotrophs in the pituitaries of TRβPV/PV mice.
To understand the molecular basis underlying the development of TSH-omas in TRβPV/PV mice but not in TRα1−/− TRβ−/− mice, we focused on genes that were involved in growth and cell proliferation pathways (Table 1). We identified 12 genes whose expression was mostly activated in TRβPV/PV mice (expression ratios of ≥2) but were repressed or not significantly changed in TRα1−/− TRβ−/− mice (expression ratios of ≤2). The common gene ontology categories to which these genes belonged were cell proliferation, regulation of cell cycle, and cell cycle. We considered the genes listed in Table 1 as candidates to directly and/or indirectly contribute to the initiation and development of TSH-omas.
TABLE 1.
Altered growth/proliferation-related genes in the pituitary glands of mutant mice
| GenBank accession no. | Gene name | Clone title | Mice (ratios)
|
Gene ontologya | ||
|---|---|---|---|---|---|---|
| TRβPV/PV/TRβ+/+ | TRα1−/−TRβ−/−/TRβ+/+ | TRβPV/PV/TRα1−/−TRβ−/− | ||||
| AW536234 | Cdc2a | Cell division cycle 2 homolog A (Schizosacchararryces pombe) | 2.39 | 0.59 | 4.06 | 1, 3, 4 |
| AW538770 | Ccnf | Cyclin F | 1.28 | 0.47 | 2.75 | 1, 3, 4 |
| AW554229 | Top2a | Topoisomerase (DNA) II alpha | 2.19 | 0.81 | 2.69 | 1, 4 |
| AW544081 | Rbbp7 | Retinoblastoma-binding protein 7 | 2.28 | 0.91 | 2.51 | 1 |
| AU015041 | Ccnd1 | Cyclin D1 | 2.31 | 0.93 | 2.47 | 1, 3, 4 |
| AW555889 | Pdgfa | Platelet-derived growth factor alpha | 2.10 | 0.88 | 2.38 | 1, 3, 4 |
| AI849299 | Sap30 | sin3-associated polypeptide; 30 kDa | 3.01 | 1.32 | 2.28 | 1, 4 |
| AU045552 | Lrp1 | Low-density lipoprotein receptor-related protein 1 | 2.05 | 0.92 | 2.23 | 1 |
| AI838492 | Nov | Nephroblastoma-overexpressed gene | 3.04 | 1.37 | 2.22 | 2 |
| AW558188 | L0C233406 | Protein regulator of cytokinesis I-like | 1.71 | 3.99 | 0.43 | 1 |
| AU041214 | Esr1 | Estrogen receptor 1 alpha | 0.34 | 0.80 | 0.43 | 1, 3, 4 |
| AI845477 | Nfkbia | Nuclear-factor of kappa light-chain gene enhancer in B-cell inhibitor, alpha | 0.48 | 1.27 | 0.38 | 1 |
1, cell proliferation; 2, regulation of cell growth; 3, regulation of cell cycle; 4, cell cycle.
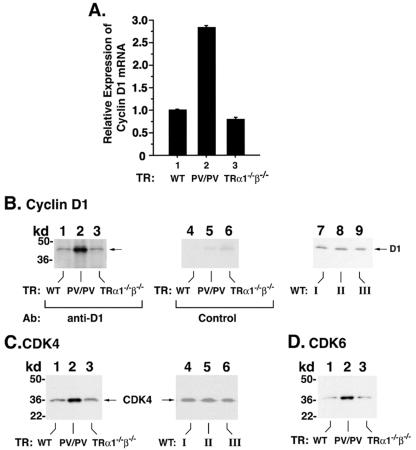
As shown in Table 1, one of the activated genes in TRβPV/PV mice but not in TRα1−/− TRβ−/− mice was the cyclin D1gene. Cyclin D1 is the key regulator of cell proliferation and plays an important role in tumorigenesis (11). Its activated expression prompted us to explore its role in the development of TSH-omas in TRβPV/PV mice. Consistent with the array data, quantitative real-time PCR confirmed the activated expression of cyclin D1 (∼2.7-fold) mRNA in the pituitary of TRβPV/PV mice (Fig. 7A, bar 2), but not in TRα1−/− TRβ−/− mice (Fig. 7A, bar 3).
FIG. 7.
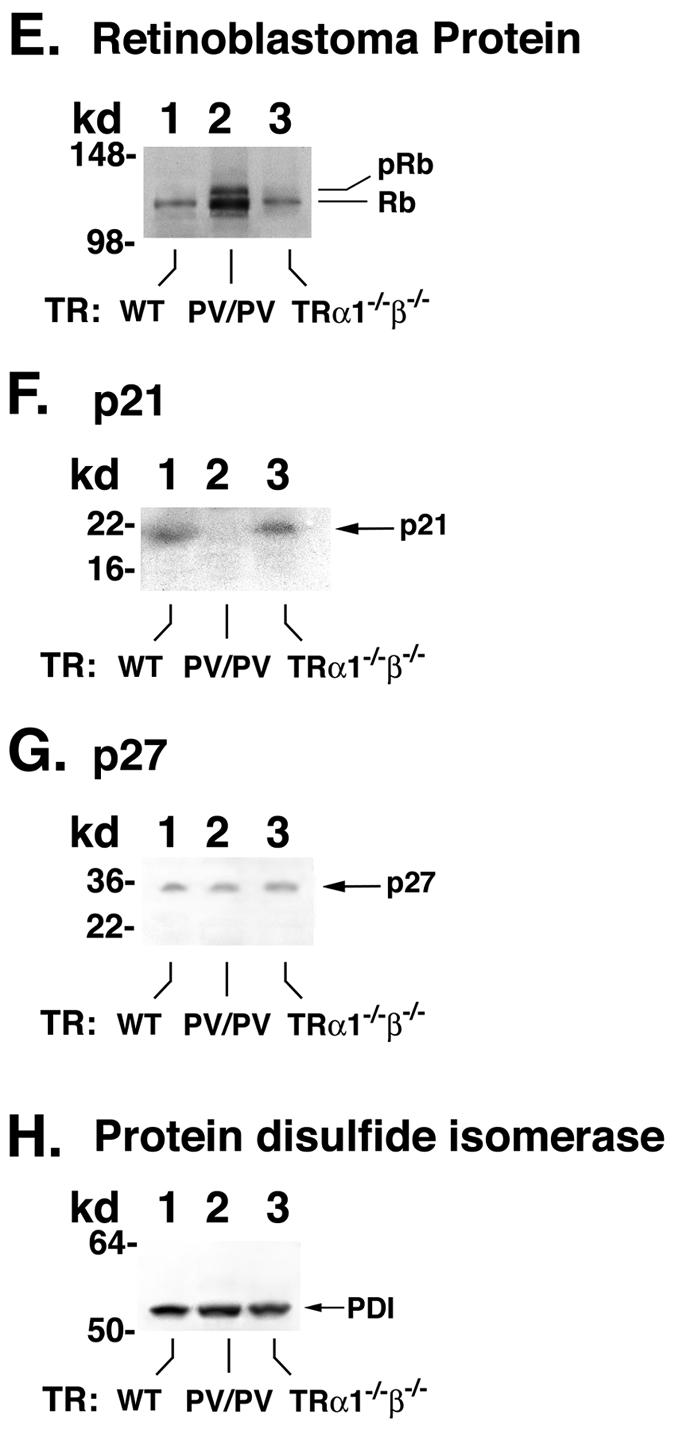
Expression of cyclin D1 mRNA (A) and protein levels of cyclin D1 (B), CDK4 (C), CDK6 (D), Rb (E), p21 (F), p27 (G), and PDI (H) in the pituitaries of TRβPV/PV mice, TRα1−/− TRβ−/− mice, and wild-type siblings (A). Total RNA from mice was prepared as described in Materials and Methods. The expression of cyclin D1 was determined by quantitative real-time RT-PCR. Relative expression levels of cyclin D1 in mutant mice were compared with those of wild-type littermates. The data are expressed as means ± standard error (n = 3, three mice in each group). (B to H). Tissue extracts were prepared from the pituitaries of TRβPV/PV mice, TRα1−/− TRβ−/− mice, and wild-type littermates, as described in Materials and Methods. Fifty micrograms of extracts was separated by gel electrophoresis, and Western blot analysis was carried out with antibody against cyclin D1 (B), CDK4 (C), CDK6 (D), Rb (E), p21 (F), p27 (G), and PDI (H) as a control for lysates loading onto the gel. Lanes 7 to 9 in panel B and lanes 4 to 6 in panel C compare the expression of cyclin D1 protein (B) and CDK4 protein (C) in three wild-type strains: wild-type mice from the cross of TRβPV/+ and TRβPV/+ mice (lane I), wild-type mice from the cross of TRα1+/− and TRβ+/− mice (lane II), and wild-type mice from the cross of TRα1+/− and TRα1+/− mice (lane III). No significant differences in the expression levels of cyclin D1 and CDK4 proteins in the wild-type mice from different strains were detected.
Figure 7B shows that, compared with the wild-type littermate (Fig. 7B, lane 1), the expression of cyclin D1 protein was increased ∼8-fold in the pituitary of TRβPV/PV mice, but not in the age- and gender-matched TRα1−/−TRβ−/− mice (Fig. 7B, lane 3). Figure 9A, lanes 4 to 6, shows the negative controls for data shown in lanes 1 to 3, respectively, when an irrelevant antibody was used. Since the wild-type mice from the colonies of TRβPV and double-knockout mice have very similar genetic backgrounds (see “Mouse strains” in Materials and Methods), it is expected that the expression levels of cyclin D1 protein would be similar. However, to be certain that this was the case, we compared the cyclin D1 protein levels in wild-type mice from three mouse colonies. Figure 7B, lanes 7 to 9, shows cyclin D1 protein levels in wild-type mice from three mouse colonies (offspring of the cross of TRβPV/+ and TRβPV/+, TRα1+/− and TRβ+/−, and TRα1+/− and TRα1+/− mice). Indeed, the expression levels of cyclin D1 were not affected in the wild-type mice from three mouse colonies. Therefore, the activated cyclin D1 (Fig. 7B, lane 2) is not due to the differences in mouse colony.
FIG. 9.
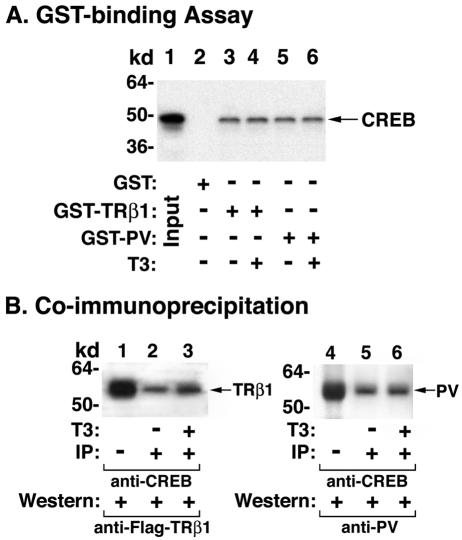
Physical interaction of CREB with TRβ1 or PV determined by GST-pulldown assay (A) and by coimmunoprecipitation (B). (A) The binding of 35S-labeled CREB to GST-TRβ1 or GST-PV was carried out as described in Materials and Methods. E. coli-expressed GST (4 μg), GST-TRβ1 (2 μg), or GST-PV (2 μg) noncovalently bound to GSH-Sepharose beads was incubated with in vitro-translated 35S-labeled CREB (10 μl), synthesized by using the TNT kit. The bound proteins were analyzed by SDS-PAGE. Lane 1, CREB input marker; lane 2, agarose-GST; lanes 3 and 4, GST-TRβ1; and lanes 5 and 6, GST-PV. (B) Association of CREB with TRβ1 or PV in cells. CV1 cells were transfected with Flag-TRβ1 expression vector and pSG5-CREB or empty vector as described in Materials and Methods. Cell extracts (each, 600 μg) were immunoprecipitated with antibody against CREB, followed by Western blotting with anti-Flag-epitope (lanes 2 to 3) or anti-PV (antibody 302; lanes 5 to 6) as described in Materials and Methods. Ten percent of the input was used to detect the expression level of Flag-TRβ1 and PV by direct Western blotting as shown in lanes 1 and 4, respectively.
To establish that the cyclin D1/CDK/Rb/E2F pathway was activated, we demonstrated the increased expression of CDK4 (∼4-fold) (Fig. 7C, lane 2) and CDK6 (∼4-fold) (Fig. 7D, lane 2) proteins in the pituitaries of TRβPV/PV mice but not in TRα1−/− TRβ−/− mice (Fig. 7C and D, lanes 3). Figure 7C, lanes 4 to 6, shows data from the controls to confirm further that similar to cyclin D1, the expression levels of CDK4 protein in wild-type mice were not affected by different mouse colonies (Fig. 7B and C). Furthermore, the hyperphosphorylated Rb protein was clearly detected in TRβPV/PV mice (Fig. 7E, lane 2), but not in TRα1−/− TRβ−/− mice (Fig. 7E, lane 3).
p21 and p27 are two CDK inhibitors that bind to and inhibit the activity of most cyclin-CDK complexes. We therefore compared their protein expression levels in the pituitaries of TRβPV/PV and TRα1−/− TRβ−/− mice. As shown in Fig. 7F, lanes 1 and 3, there were no differences in the protein levels between wild-type and TRα1−/− TRβ−/− mice. But the p21 protein level was not detectable in TRβPV/PV mice (Fig. 7F, lane 2). Figure 7G shows that no differences in the expression of p27 protein in wild-type, TRβPV/PV, and TRα1−/− TRβ−/− mice were detected. These results indicate that the activation of cyclin D1/CDK/Rb/E2F pathway is also facilitated by the reduced expression of p21 in the pituitary of TRβPV/PV mice.
Figure 7H shows the control for the loading of lysates using a ubiquitous endoplasmic reticulum resident protein, PDI. These results indicate that in responding to the overexpression of cyclin D1, together with the reduced expression of p21, the cyclin D1/CDK/Rb/E2F pathway was activated in the pituitaries of TRβPV/PV mice and propelled the cells to enter the S phase from the G1 phase. These data are consistent with the detection of proliferation marker Ki67 in adenomas of TRβPV/PV mice (see above).
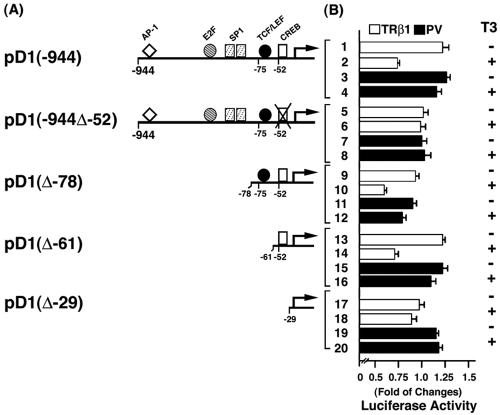
TRβ1, but not PV, represses cyclin D1 promoter activity. To understand the mechanisms by which PV activates the expression of cyclin D1 mRNA in the pituitaries of TRβPV/PV mice, we transfected reporters containing the cyclin D1 promoter with serial deletions into α-TSH cells (1) in the presence of TRβ1 or PV (Fig. 8). Figure 8B, bars 1 and 2, shows that the liganded TRβ1 repressed the promoter activity of cyclin D1 that contains the binding sites for AP1, E2F1, SP1, TCF/LEF, and CREB (pD1-944) (14, 29), but repression activity was not detected for PV whether T3 was present or not (Fig. 8B, bar 2 versus bars 3 and 4). To identify the site(s) responsible for the repression, serial deletion mutants were constructed and assayed for the promoter activity. As shown in Fig. 8B, when the CREB site was deleted (pD1-944Δ-52), liganded TRβ1-mediated repression was completely abolished (there were no significant differences in the data shown in Fig. 8B, bars 5 and 6, indicating that all other sites in the promoter region up to −52 were most likely not involved in the repression by the liganded TRβ1). That the CREB site mediated the repression was confirmed by the finding that both pD1(Δ-78) (Fig. 8B, bars 9 and 10) and pD1(Δ-61) (bars 13 and 14) retained the repression activity by the liganded TRβ1, but not in pD1(Δ-29) (bars 17 and 18) when the CREB site was deleted. In contrast, no CREB-binding site-mediated repression in pD1(Δ-78) (bars 11 and 12) and pD1(Δ-61) (bars 15 and 16) by PV was detected. These results indicate that the liganded TRβ1 suppressed the promoter activity of cyclin D1 and that this suppressor activity was lost in PV, thereby constitutively activating the expression of cyclin D1 in TRβPV/PV mice. Similar findings were also detected with CV-1 cells, suggesting that the PV-mediated activation of the cyclin D1 promoter is not limited to thyrotrophic cells.
FIG. 8.
Schematic representation of the cyclin D1 promoter and the deletion mutants (A), their corresponding luciferase activity expressed (as the amount of change) (B), and percent repression by T3 (C). (A) The locations of the response elements for AP1, E2F, SP1, TCF/LEF, and CREB are indicated. (B) α-TSH cells were cotransfected with 1 μg of the cyclin D1 promoter reporter plasmid and cDNA expression vectors for TRβ1 or PV (pCLC51 for TRβ1, pCLC51-PV for PV, and control vector), as indicated. Cells were treated in the absence or presence of T3 (100 nM) as marked. Data were normalized against the protein concentration in the lysates. Relative luciferase activity was calculated and shown as fold induction relative to the basal luciferase activity of cyclin D1 reporter shown by control vector in the absence of T3. The lanes are marked and the data are expressed as means ± standard errors of three experiments.
The finding that the liganded TRβ1 suppressed the promoter activity of cyclin D1 via the CREB-binding site is consistent with the recent report that TR represses CREB-mediated transcription in pituitary GH4C1 cells (21). TR does not bind to CRE in vitro, but TR is tethered to the CRE-containing promoter through the physical interaction with CREB, leading to the repression of CREB-mediated transcription. We hypothesized that PV, like TRβ1, is associated with CREB on the CREB site on the promoter of cyclin D1, but since PV does not bind T3, it is incapable of mediating the repression as TRβ1 does. To test this hypothesis, we used the in vitro GST/GSH-binding assay and coimmunoprecipitation in cells to determine the physical interaction of PV with CREB. Figure 9A, lanes 5 and 6, shows that PV, similar to TRβ1 (Fig. 9A, lanes 3 and 4), bound to CREB even in the presence of T3. This interaction was also detected in cells (Fig. 9B, lanes 2 and 3) as TRβ1 or PV was detected by Western blot analysis, followed first by immunoprecipitation of cellular lysates with anti-CREB antibodies. The binding of TRβ1 to CREB was increased by the presence of T3 (Fig. 9B, lanes 2 and 3). Figure 9B, lanes 5 and 6, shows that PV also interacted with CREB; however, this interaction was not affected by T3. These results indicate that PV, like TRβ1, was tethered to the CRE-containing promoter through the physical interaction with CREB. However, because PV does not bind T3, PV cannot mediate the repression of the transcriptional activity of CREB.
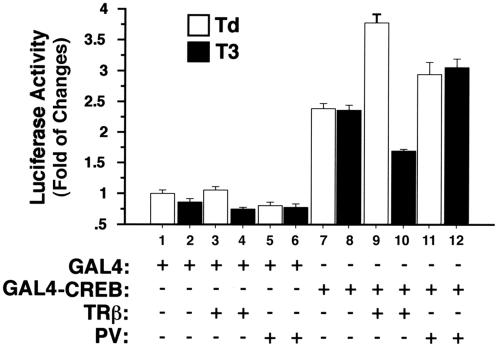
That the physical interaction of CREB with TRβ1or PV is functionally relevant was further supported by using the TR/GAL4-CREB reporter system. Cells were transfected with GAL4-CREB and TRβ1or PV in the presence or absence of T3 (Fig. 10). As expected, in the absence of TRβ1, T3 had no effect on the activation of transactivation activity of GAL4-CREB (Fig. 10, bars 7 and 8 versus the basal activity shown in bars 1 and 2). In the absence of T3, cotransfection of TRβ1 resulted an additional increase of the GAL4-CREB-mediated activity (Fig. 10, bar 9). This activation, however, was repressed 65% by the presence of T3 (bar 10 versus bar 9). Cotransfection of PV also led to the activation of GAL4-CREB-mediated activity (bar 11). T3, however, could not repress the PV-induced GAL4-CREB activation (bar 12 versus bar 11). These results further confirm that CREB indeed interacted with TRβ1 or PV in cells and that this interaction had different functional consequences, depending on whether it was the normal TR or a PV mutation.
FIG. 10.
In the presence of T3, TRβ1 but not PV represses GAL4-CREB-mediated transactivation activity. CV1 cells were cotransfected with an upstream activation sequence reporter plasmid (pE1b-4XUAS-luc; 0.25 μg), the plasmid GAL4-CREB (pcDNA-GAL4-CREB; 0.2 μg), or the control expression plasmid GAL4 (pSG5-GAL4-polyII; 0.2 μg) and TRβ1 (pCLC51; 0.1 μg) or PV (pCLC51PV; 0.1 μg) in the presence or absence of T3 as marked. The data are expressed as means ± standard errors for three experiments.
DISCUSSION
TSH-omas were reported as early as the 1960s (5, 6). The development of ultrasensitive TSH assays has made earlier detection of TSH-omas in patients possible. Still, the molecular genetics underlying the development of this disease remain unclear. Recent identification of dominantly negative TRβ mutations in several patients (2, 3, 26) raises the possibility that mutations of the TRβ gene could contribute to the pathogenesis of this abnormality. The present study demonstrates that the TRβPV/PV mouse spontaneously develops TSH-omas, thus providing the evidence to suggest that mutation of the TRβ gene is one of the genetic events mediating the development of this disease.
TSH-omas are characterized by nonsuppressible TSH in the presence of high serum levels of thyroid hormone. To understand whether such dysfunction in the thyroid-pituitary axis underlies the pathogenesis of TSH-omas, we took advantage of another mutant mouse, the TRα1−/− TRβ−/− mouse, that also exhibits similar dysregulation of the negative feedback regulation of TSH by thyroid hormone (13). In spite of elevated thyroid hormone levels, the expression of TSHβ and α-GSU genes is abnormally up-regulated in TRβPV/PV mice (17), as well as in TRα1−/− TRβ−/− mice (13). The present study shows that despite very similar hormonal profiles in thyroid function tests in these two mutant mice, only minor histological abnormalities were observed in the pituitaries of TRα1−/− TRβ−/− mice without the development of adenomas. These results suggest that the loss of negative feedback alone is not sufficient to induce the development of TSH-omas. As TRα1−/− TRβ−/− mice aged, serum TSH levels were reduced but were still highly elevated compared with the wild-type mice. Whether this relatively reduced TSH in aged TRα1−/− TRβ−/− mice have any significant functional consequence is not clear.
The distinct functional consequences due to PV mutation or the deficiency of both TRs were clearly documented by the contrasting gene expression profiles in the pituitaries of these two mutant mice (unpublished data). The distinct molecular actions of PV compared with the lack of TRs in the pathogenesis of TSH-omas suggest that PV could act via change-of-function. Using comprehensive gene expression profiling, it has recently been shown that PV could act via change-of-function in the brain, heart, and white adipocytes (22). The present results have therefore further broadened the target tissues in which PV could act via the mode of change-of-function.
The contrasting gene expression profiles between the pituitaries of TRβPV/PV and TRα1−/− TRβ−/− most likely reflect the increased percentage of proliferating thyrotropes in adenomas. Therefore, it is possible to search for the gene(s) that can mediate the tumorigenesis of TSH-omas. We consequently compared the differential gene expression profiles in the pituitaries of TRβPV/PV and TRα1−/− TRβ−/− mice. Among the proliferation-related differentially expressed genes, we found that the expression of cyclin D1 mRNA was activated only in TRβPV/PV and not in TRα1−/− TRβ−/− mice (Table 1 and Fig. 7A). Cyclin D1 is frequently overexpressed in human cancers of diverse histological origin. Its deregulated expression has been implicated in the genesis of many human tumors, presumably by nullifying the restriction point control in the cell cycle (24), leading to uncontrolled proliferation (11). Indeed, we detected the presence of the Ki67 nuclear protein, a proliferation marker, in the pituitary of TRβPV/PV mice, a finding that is reflective of active proliferation. The overexpression of cyclin D1 protein was accompanied by increases in CDK4 and CDK6 proteins and hyperphosphorylated Rb (Fig. 7). Phosphorylation of Rb is known to release the E2F transcription factor from Rb-E2F complexes to promote progression of cell cycle from the G1 to the S phase. We also found that p21 was reduced in of TRβPV/PV mice, but not in TRα1−/− TRβ−/− mice, thus further enhancing the activity of the cyclin D1/CDK/Rb/E2F pathway. Taken together, the present study identified cyclin D1 as one of the oncogenes that could mediate the aberrant proliferation of thyrotrophs in the pituitary of TRβPV/PV mice.
To understand the mechanisms by which PV induced the expression of cyclin D1, we mapped the PV-affected sites in the cyclin D1 promoter. Multiple factors are known to regulate the activity of the cyclin D1 promoter, including AP1, E2F, Sp1, TCF/LEF, and CREB (14, 29). Using deletion analysis, we identified the CREB binding site located at −52 to −45 that mediated the repression of cyclin D1 by the liganded TRβ1, but not by PV. The CREB-binding sites in the promoter of the pituitary-specific transcription factor and the α-GSU genes have previously been identified to mediate the repression of CREB transcription by TRs via transcriptional interference (27, 28), as TRs do not bind to CRE. Recently, TR was shown to represses CREB-mediated transcription via a T3-dependent physical interaction with CREB in cells (21). Consistent with these reports, the present study demonstrates that in addition to TRβ1, PV could also physically associate with CREB (Fig. 9). Because PV does not bind T3, the repression effect on the expression of cyclin D1 by the liganded TRs is lost in PV, thus leading to the constitutive activation of cyclin D1 in the pituitary of TRβPV/PV mice. That PV mediates the activation of cyclin D1 in the TRβPV/PV mouse model is further supported by the findings that no significant differences in the activation of cyclin D1 were found in TRβPV/PV mice with or without TRα1 (data not shown). Furthermore, TRβPV/PV mice deficient in TRα1 also similarly developed TSH-omas (S. Cheng, unpublished results).
The present study shows that the deleterious effect of mutant TRβ in the pituitary of TRβPV/PV mice is far more severe than the lack of both TRs in TRα1−/− TRβ−/− mice. Gene expression profiling also showed more extensive alterations of cellular pathways mediated by PV than by the lack of both TRs (Table 1 and unpublished data). We recently found that PV constitutively associated with corepressors such as the nuclear receptor corepressor (15; O. Araki and S.-Y. Cheng, unpublished results). These observations suggest that the repression of T3 target genes in the pituitary by constitutive association of mutant TRβ with corepressors leads to a more severe phenotype than by the lack of TRs. This notion is supported by the development of the thyrotropic tumor syndrome in mice by sustained thyroid hormone deficiency (Furth's mice) (12). Unlike the TSH-omas spontaneously developed in TRβPV/PV mice that have highly elevated thyroid hormone levels, the induced thyrotropic tumor syndrome, a multiglandular disease, is characterized by thyroid hormone deficiency-dependent secretion of a large quantity of TSH associated with biologic gonadotropin activity. Clearly, there are phenotypic differences between these two mice. The commonality between them is the development of thyrotropic tumors. These observations suggest the possibility that the T3 target genes repressed by the unliganded TRs in Furth's mice due to their association with corepressors could overlap those in TRβPV/PV mice. Further studies are needed to test this likelihood.
TSH-omas are believed to derive from clonal expansion of thyrotropes that have lost growth regulation. Studies to identify the genetics basis underlying this abnormality are limited. Using the TRβPV/PV mouse, we identified cyclin D1 as one oncogene that mediates the tumorigenesis of TSH-omas. However, since tumorigenesis is frequently a multigenetic event, there likely are other yet-to-be identified genetic events contributing to the initiation and progression of TSH-omas. With the availability of this mouse model, it has become possible to further elucidate the molecular mechanisms underlying its pathogenesis. The new insights gained will help provide novel prognostic markers and treatment strategies.
Acknowledgments
We thank Rolf Muller for the plasmids pD1Δ-944pXP2 and pD1Δ-78pXP2. We are also indebted to Ana Aranda for her valuable discussion and the plasmids pE1b-4XUAS-luc, pcDNA-GAL4-CREB, pSG5-GAL4-polyII, pGEM-CREB, and pSG5-CREB. We also thank Brian West for the expression plasmid CMVZUS-Flag-TR461.
REFERENCES
- 1.Akerblom, I. A., E. C. Ridgway, and P. L. Mellon. 1990. A subunit-secreting cell line derived from a mouse thyrotrope tumor. Mol. Endocrinol. 4:589-596. [DOI] [PubMed] [Google Scholar]
- 2.Ando, S., N. J. Sarlis, E. H. Oldfield, and P. M. Yen. 2001. Somatic mutation of TRβ can cause a defect in negative regulation of TSH in a TSH-secreting pituitary tumor. J. Clin. Endocrinol. Metab. 86:5572-5576. [DOI] [PubMed] [Google Scholar]
- 3.Ando, S., N. J. Sarlis, J. Krishnan, X. Feng, S. Refetoff, M. Q. Zhang, E. H. Oldfield, and P. M. Yen. 2001. Aberrant alternative splicing of thyroid hormone receptor in a TSH-secreting pituitary tumor is a mechanism for hormone resistance. Mol. Endocrinol. 15:1529-1538. [DOI] [PubMed] [Google Scholar]
- 4.Bassett, J. H., C. B. Harvey, and G. R. Williams. 2003. Mechanisms of thyroid hormone receptor-specific nuclear and extra nuclear actions. Mol. Cell Endocrinol. 213:1-11. [DOI] [PubMed] [Google Scholar]
- 5.Beck-Peccoz, P., F. Brucker-Davis, L. Persani, R. C. Smallridge, and B. D. Weintraub. 1996. Thyrotropin-secreting pituitary tumors. Endocr. Rev. 17:610-638. [DOI] [PubMed] [Google Scholar]
- 6.Brucker-Davis, F., E. H. Oldfield, M. C. Skarulis, J. L. Doppman, and B. D. Weintraub. 1999. Thyrotropin-secreting pituitary tumors: diagnostic criteria, thyroid hormone sensitivity, and treatment outcome in 25 patients followed at the National Institutes of Health. J. Clin. Endocrinol. Metab. 84:476-486. [DOI] [PubMed] [Google Scholar]
- 7.Chen, Y., E. R. Dougherty, and M. Bittner. 1997. Ratio-based decisions and the quantitative analysis of cDNA microarray images. J. Biomed. Opt. 2:364-374. [DOI] [PubMed] [Google Scholar]
- 8.Cheng, S.-y. 2000. Multiple mechanisms for regulation of the transcriptional activity of thyroid hormone receptors. Rev. Endocr. Metab. Disord. 1:9-18. [DOI] [PubMed] [Google Scholar]
- 9.Cheng, S.-y., S. Hasumura, M. C. Willingham, and I. Pastan. 1986. Purification and characterization of a membrane-associated 3,3′,5-triiodo-l-thyronine binding protein from a human carcinoma cell line. Proc. Natl. Acad. Sci. USA 83:947-951. [DOI] [PMC free article] [PubMed] [Google Scholar]
- 10.Collingwood, T. N., M. Adams, Y. Tone, and V. K. Chatterjee. 1994. Spectrum of transcriptional, dimerization, and dominant negative properties of twenty different mutant thyroid hormone beta-receptors in thyroid hormone resistance syndrome. Mol. Endocrinol. 8:1262-1277. [DOI] [PubMed] [Google Scholar]
- 11.Ewen, M. E., and J. Lamb. 2004. The activities of cyclin D1 that drive tumorigenesis. Trends Mol. Med. 10:158-162. [DOI] [PubMed] [Google Scholar]
- 12.Furth, J. 1973. Thyrotropic tumor syndrome. A multiglandular disease induced by sustained deficiency of thyroid hormones. Arch. Pathol. 96:217-227. [PubMed] [Google Scholar]
- 13.Gothe, S., Z. Wang, L. Ng, J. M. Kindblom, A. C. Barros, C. Ohlsson, B. Vennstrom, and D. Forrest. 1999. Mice devoid of all known thyroid hormone receptors are viable but exhibit disorders of the pituitary-thyroid axis, growth, and bone maturation. Genes Dev. 13:1329-1341. [DOI] [PMC free article] [PubMed] [Google Scholar]
- 14.Herber, B., M. Truss, M. Beato, and R. Muller. 1994. Inducible regulatory elements in the human cyclin D1 promoter. Oncogene 9:1295-1304. Erratum, 9:2105-2107. [PubMed] [Google Scholar]
- 15.Horlein, A. J., A. M. Naar, T. Heinzel, J. Torchia, B. Gloss, R. Kurokawa, A. Ryan, Y. Kamei, M. Soderstrom, C. K. Glass, et al. 1995. Ligand-independent repression by thyroid hormone receptor mediated by a nuclear receptor co-repressor. Nature 377:397-404. [DOI] [PubMed] [Google Scholar]
- 16.Hosack, D. A., G. J. Dennia, B. T. Sherman, H. C. Lane, and R. A. Lempicki. 2003. Identifying biological themes within lists of genes with EASE. Genome Biol. 4:R70-R75. [DOI] [PMC free article] [PubMed] [Google Scholar]
- 17.Kaneshige, M., K. Kaneshige, X.-G. Zhu, A. Dace, L. Garrett, T. A. Carter, R. Kazlauskaite, D. G. Pankratz, A. Wynshaw-Boris, S. Refetoff, B. Weintraub, M. C. Willingham, C. Barlow, and S.-y. Cheng. 2000. Mice with a targeted mutation in the thyroid hormone β receptor gene exhibit impaired growth and resistance to thyroid hormone. Proc. Natl. Acad. Sci. USA 97:13209-13214. [DOI] [PMC free article] [PubMed] [Google Scholar]
- 18.Kaneshige, M., H. Suzuki, K. Kaneshige, J. Cheng, H. Wimbrow, C. Barlow, M. C. Willingham, and S.-y. Cheng. 2001. A targeted dominant negative mutation of the thyroid hormone α1 receptor causes increased mortality, infertility and dwarfism in mice. Proc. Natl. Acad. Sci. USA 98:15095-15100. [DOI] [PMC free article] [PubMed] [Google Scholar]
- 19.Khan, J., J. S. Wei, M. Ringnér, L. H. Saal, M. Ladanyi, F. Westermann, F. Berthold, M. Schwab, C. R. Antonescu, C. Peterson, and P. S. Meltzer. 2001. Classification and diagnostic prediction of cancers using gene expression profiling and artificial neural networks. Nat. Med. 7:673-679. [DOI] [PMC free article] [PubMed] [Google Scholar]
- 20.McKenna, N. J., and B. W. O'Malley. 2002. Combinatorial control of gene expression by nuclear receptors and coregulators. Cell 108:465-474. [DOI] [PubMed] [Google Scholar]
- 21.Mendez-Pertuz, M., A. Sanchez-Pacheco, and A. Aranda. 2003. The thyroid hormone receptor antagonizes CREB-mediated transcription. EMBO J. 22:3102-3112. [DOI] [PMC free article] [PubMed] [Google Scholar]
- 22.Miller, L., P. McPhie, H. Suzuk, Y. Kato, E. Liu, and S.-Y. Cheng. 2004. Multi-tissue gene expression analysis in a mouse model of thyroid hormone resistance. Genome Biol. 5:FIRST-PAGE>R31. [DOI] [PMC free article] [PubMed]
- 23.Nimmakayalu, M., O. Henegariu, D. C. Ward, and P. Bray-Ward. 2000. Simple method for preparation of fluor/hapten-labeled dUTP. BioTechniques 28:518-522. [DOI] [PubMed] [Google Scholar]
- 24.Pardee, A. B. 1974. A restriction point for control of normal animal cell proliferation. Proc. Natl. Acad. Sci. USA 71:1286-1290. [DOI] [PMC free article] [PubMed] [Google Scholar]
- 25.Parrilla, R. A., A. J. Mixson, J. A. McPherson, J. H. McClaskey, and B. D. Weintraub. 1991. Characterization of seven novel mutations of the c-erbAb gene in unrelated kindreds with generalized thyroid hormone resistance. Evidence for two “hot spot” regions of the ligand binding domain. J. Clin. Investig. 88:2123-2130. [DOI] [PMC free article] [PubMed] [Google Scholar]
- 26.Safer, J. D., S. D. Colan, L. M. Fraser, and F. E. Wondisford. 2001. A pituitary tumor in a patient with thyroid hormone resistance: a diagnostic dilemma. Thyroid 11:281-291. [DOI] [PubMed] [Google Scholar]
- 27.Sanchez-Pacheco, A., T. Palomino, and A. Aranda. 1995. Negative regulation of expression of the pituitary-specific transcription factor GHF-1/Pit-1 by thyroid hormones through interference with promoter enhancer elements. Mol. Cell. Biol. 15:6322-6330. [DOI] [PMC free article] [PubMed] [Google Scholar]
- 28.Tagami, T., Y. Park, and J. L. Jameson. 1999. Mechanisms that mediate negative regulation of the thyroid-stimulating hormone alpha gene by the thyroid hormone receptor. J. Biol. Chem. 274:22345-22353. [DOI] [PubMed] [Google Scholar]
- 29.Tetsu, O., and F. McCormick. 1999. Beta-catenin regulates expression of cyclin D1 in colon carcinoma cells. Nature 398:422-426. [DOI] [PubMed] [Google Scholar]
- 30.Yap, N., C.-L. Yu, and S.-y. Cheng. 1996. Modulation of the transcriptional activity of thyroid hormone receptors by the tumor suppressor p53. Proc. Natl. Acad. Sci. USA 93:4273-4277. [DOI] [PMC free article] [PubMed] [Google Scholar]


