Abstract.
Although the development of tumor-targeted fluorescent probes is a major area of investigation, it will be several years before these probes are realized for clinical use. Here, we report an approach that employs indocyanine-green (ICG), a clinically approved, nontargeted dye, in conjunction with fluorescence lifetime (FLT) detection to provide high accuracy for tumor-tissue identification in mouse models of subcutaneous human breast and brain tmors. The improved performance relies on the distinct FLTs of ICG within tumors versus tissue autofluorescence and is further aided by the well-known enhanced permeability and retention of ICG in tumors and the clearance of ICG from normal tissue several hours after intravenous injection. We demonstrate that FLT detection can provide more than 98% sensitivity and specificity, and a 10-fold reduction in error rates compared to intensity-based detection. Our studies suggest the significant potential of FLT-contrast for accurate tumor-tissue identification using ICG and other targeted probes under development, both for intraoperative imaging and for ex-vivo margin assessment of surgical specimens.
Keywords: fluorescence lifetime, indocyanine green, tumors, time-resolved imaging, optical imaging, margin detection
A great unmet need in oncologic surgery is the ability to accurately identify tumor-positive margins during surgical resections and to rapidly assess the margin status of resection specimens immediately following surgery.1 Several ongoing efforts are focused on developing imaging techniques for intraoperative surgical guidance2–4 and targeted fluorophores for tumor imaging.5–7 While many promising fluorophores have emerged, many of these are either being evaluated at the preclinical stage or are several years from FDA approval and clinical realization. The only fluorescent dyes currently approved for clinical use are fluorescein, indocyanine green (ICG), methylene blue, and 5-aminolevulinic acid. Of these, ICG allows deep tissue imaging due to its longer excitation wavelength.1,8,9 ICG has been evaluated for imaging liver,10 ovarian,11 head and neck,12 and breast13,14 cancers, by exploiting the enhanced permeability and retention within the tumor microenvironment.15,16 ICG has also been evaluated as a targeted marker in preclinical models using fluorescence lifetime (FLT) to distinguish bound from unbound probes, for example, by conjugation with peptides targeting integrins.17,18 However, these probes are still under preclinical evaluation and would need to go through the FDA approval pipeline before clinical translation, since they involve changes in chemical structure from ICG.
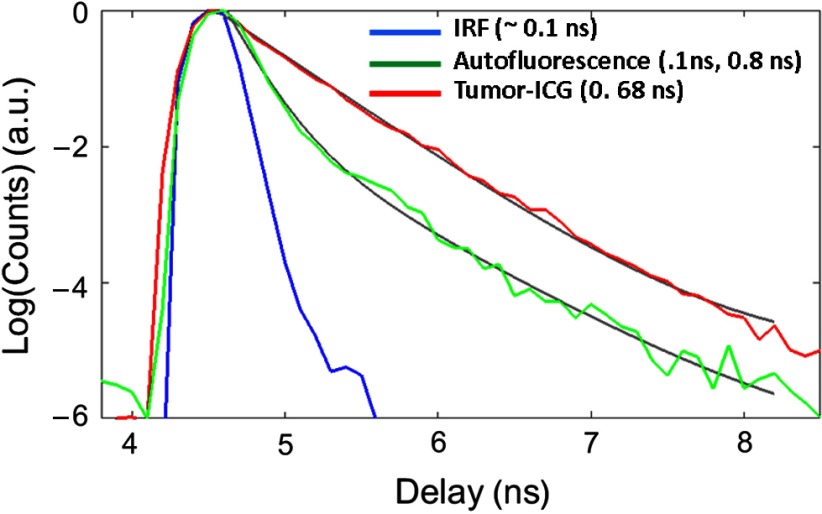
Despite these studies and the wide range of possible applications, ICG has not yet been widely adopted clinically in the intraoperative or diagnostic settings. This can be attributed to the fact that significant ICG remains in surrounding tissue even after tumor uptake, resulting in high nonspecific fluorescence immediately following ICG injection and leading to high false-positive rates.19 Previous clinical imaging studies of breast cancer14 have found that imaging during the extravascular phase of ICG ( after injection) can improve contrast between tumor and normal tissue. However, our measurements indicate that significant ICG remains in normal tissue even during the extravascular phase and is only cleared from tissue beyond 24 h after injection. In addition, we have observed that even after complete ICG clearance from tissue, the intensity of autofluorescence (AF) can be comparable (same order of magnitude) to that of the ICG fluorescence from tumors. Thus, while late imaging beyond 24 h after ICG injection could offer an excellent opportunity for tumor imaging, tissue AF significantly reduces tumor contrast. Most existing clinical optical imaging systems are based on continuous wave (CW) imaging, which detects total fluorescence intensity and does not offer good contrast of ICG fluorescence versus tissue AF. In this letter, we show that time-domain (TD) fluorescence detection can exploit the FLT contrast between tumor-bound ICG and tissue AF (Fig. 1) more than 24 h after ICG injection, significantly enhancing the sensitivity and specificity for identifying tumor tissue in subcutaneous and orthotopic models of breast and brain cancer in living mice. An important advantage of FLT is that it is generally insensitive to experimental conditions, thereby serving as a more robust indicator of ICG versus AF signals than CW intensity.
Fig. 1.
Representative TD instrument response function (blue), AF signal from normal tissue (green), and fluorescence from a subcutaneous U87 glioma tumor (red) in a live mouse 24 h after tail vein injection of ICG. While the tumor fluorescence can be fit using a single exponential, the AF is ideally described as a biexponential decay (solid gray lines). For the analysis in this paper, the decay portion of the signal is fit using a simple exponential decay [] to obtain the lifetimes at each pixel location [Figs. 2(g)–2(i)].
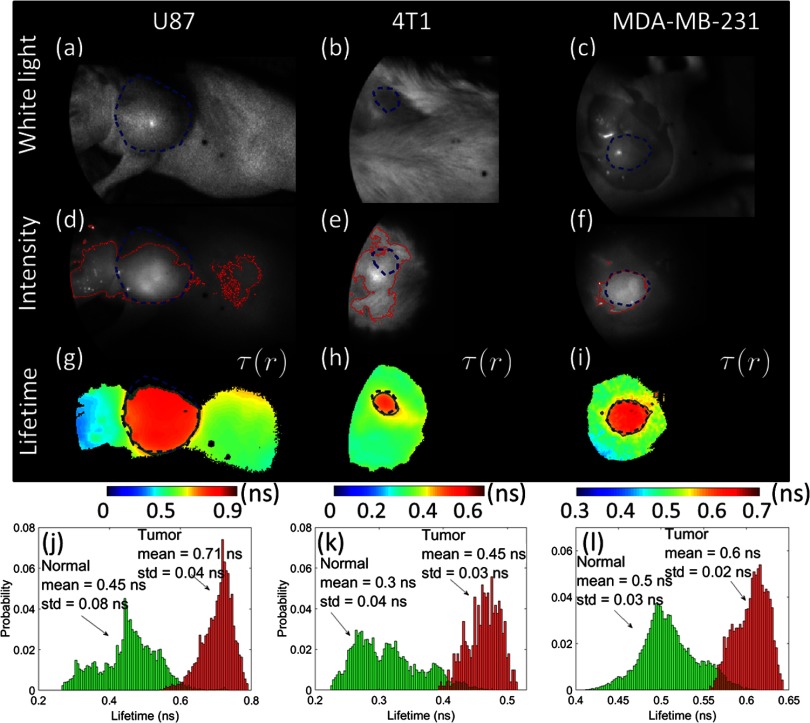
We used mice with tumors derived from U87 glioma [Figs. 2(a), 2(d), and 2(g)], 4T1 breast [Figs. 2(b), 2(e), and 2(h)], and MDA-MB-231 breast cancer cell lines [Figs. 2(c), 2(f), and 2(i)]. All procedures were performed in accordance with the Massachusetts General Hospital animal welfare guidelines. The glioma and MDA-MB-231 tumors were grown subcutaneously in nu/nu mice and imaged when the tumors reached a size of to 1.5 cm. The 4T1 tumors were grown orthotopically in the mammary fat pad of BALB/c mice. All the mice (, 2 per tumor type) were injected IV in the tail vein with of ICG, dissolved in 5% dimethyl sulfoxide and saline. In all cases, imaging was performed at least 24 h after the ICG injection to ensure complete clearance of ICG from normal tissue. The animals were administered continuous anesthesia (2% isoflurane) during imaging. TD fluorescence was collected in a reflectance mode using a previously described small animal imaging system20 consisting of a Ti:Sapphire laser for excitation (Spectra Physics, Mai Tai HP; 770-nm excitation; 100-fs pulses; 80-MHz repetition rate, 10 to 20 mW average total power across the illumination field) and a gated intensified CCD camera for detection (LaVision, Picostar, 560 V gain, 100- to 500-ms integration time, after hardware binning). Fluorescence was collected using an 800-nm long pass emission filter. The typical acquisition time for a full TD measurement was 10 s.
Fig. 2.
Demonstration of FLT contrast between tumor-bound ICG and normal tissue in mice. The top row shows white-light images of ICG-injected mice with (a) subcutaneous U87 glioma tumor, (b) orthotopic 4T1 breast tumor, and (c) subcutaneous MDA-MB-231 breast tumor in situ (postmortem, skin removed). (d–f) The corresponding CW fluorescence intensity (770-nm excitation and emission) obtained as the sum of the full TD fluorescence curve (as shown in Fig. 1) is shown. (g–i) Surface FLT maps across the full illumination field obtained from single exponential fits to the TD data, thresholded at 80% of the maximum intensity to avoid regions with poor SNR. (j–l) Distribution of FLTs within the tumor ROI (red) and outside the tumor ROI (green). The dashed blue lines indicate the tumor ROIs drawn based on visual inspection of the white-light images. These ROIs are used to generate the histograms in (j–l). The solid red lines in (d–f) and solid green lines in (g–i) indicate, respectively, the estimated ROIs that enclose regions with intensity or FLT above the optimal intensity or FLT thresholds, which correspond to the least error as determined by the analysis in Fig. 3.
Figure 2 shows white light images [Figs. 2(a)–2(c)], CW fluorescence images [Figs. 2(d)–2(f)], obtained as the total TD signal at each pixel, and FLT maps [Figs. 2(g)–2(i)] across the illumination area. The FLT maps were obtained by fitting the decay portion of the TD response (as shown in Fig. 1) at each pixel location ( binned) to a single exponential decay function. The nonlinear fitting was performed using the MATLAB “fminsearch” function. Note from Fig. 1 that tissue AF exhibits a nonexponential decay that can be fit using a biexponential function.21,22 However, for computational efficiency, we analyzed the entire image using a single exponential function, which resulted in a distribution of FLTs across normal tissue, as shown in Figs. 2(j)–2(l). For normal tissue regions with AF, the single exponential fit would result in an “effective” FLT. For the purposes of quantification, we first defined a tumor region-of-interest (ROI) based on a visual identification of the tumor surface from the white light images [blue dashed line in Figs. 2(a)–2(i)]. It is clear that while the CW fluorescence [Figs. 2(d)–2(f)] shows a strong nonspecific signal outside the tumor ROI, due to AF, the FLT maps [Figs. 2(g)–2(i)] delineate the tumor boundaries more clearly. We also observed that the FLT for a given tumor type was similar across at least two different mice, to within the FLT estimation error (). It is also seen from Fig. 2 that the mean FLT of ICG within the tumor depends on the tumor type, ranging from 0.45 ns in the 4T1 tumor model to 0.71 ns in the U87 model. This variation could be attributed to variations in the local tumor environment and will be investigated in detail in future work. Irrespective of the underlying cause of the FLT variations between tumor types, the mean FLT of ICG within the tumor ROI for all cases was at least 20% longer than the AF FLT of normal tissue. This FLT difference is readily resolvable using TD imaging.20
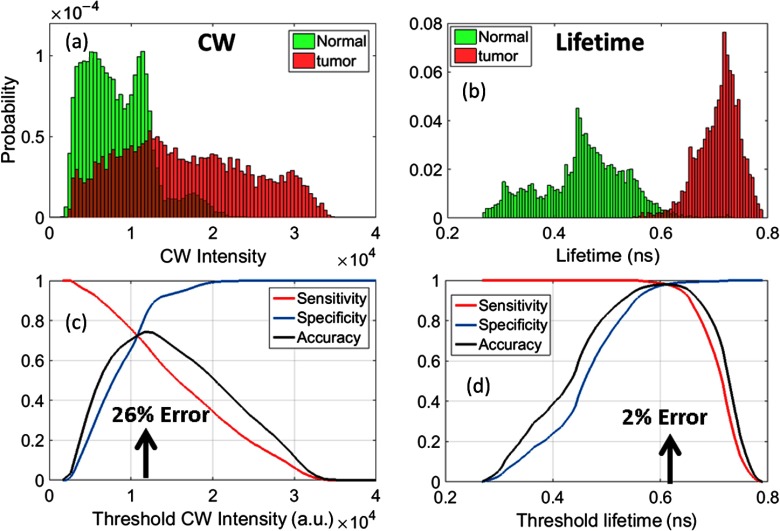
To quantitatively compare the performance of CW versus FLT for tumor identification, we performed a receiver-operating-characteristic (ROC) analysis by varying the intensity and FLT thresholds, respectively, and computing the sensitivity, specificity, and accuracy. Sensitivity is calculated as the total number of pixels within the tumor area with intensity or FLT above the threshold, divided by the total number of pixels within the tumor. Specificity is the total number of pixels outside the tumor area below the threshold intensity or FLT, divided by the total number of pixels outside the tumor. Figure 3 shows the sensitivity, specificity, and accuracy for the glioma tumor model shown in Figs. 2(d) and 2(g). It is clear that at an “optimal” FLT threshold of 0.62 ns, FLT-based tumor identification provides the lowest error (2%) and more than 98% sensitivity and specificity. CW intensity provides only about 70% sensitivity and specificity at the optimal threshold intensity (), but results in a more than 10-fold higher error rate than FLT. In Figs. 2(d)–2(f), we show the tumor ROIs corresponding to the optimal intensity thresholds (solid red line) and in Figs. 2(g)–2(i), we show the tumor ROIs corresponding to the optimal FLT thresholds (solid green line) for all three tumors, based on a sensitivity/specificity analysis similar to Fig. 3. It is clear that the FLT-based ROI is in excellent agreement with the manual ROI based on the white-light image (dashed blue), while the intensity threshold-based ROI is highly inaccurate for the U87 and 4T1 cases. We note that the slight mismatch between the white-light ROI with the FLT threshold-ROI in Fig. 2(g) is due to the fact that the upper part of the tumor was not fully illuminated, resulting in low intensity pixels that were rejected due to thresholding.
Fig. 3.
Normalized distribution of (a) CW intensity and (b) FLT in the tumor (red) and normal tissue (green) for the U87 glioma tumor data in Figs. 2(d) and 2(g). Sensitivity, specificity, and accuracy of thresholding using (c) CW Intensity and (d) FLT. Sensitivity is calculated as the total number of pixels within the tumor area with intensity or lifetime above the threshold/total number of pixels within the tumor. Specificity is the total number of pixels outside the tumor area below the threshold intensity or lifetime/total number of pixels outside the tumor. Accuracy was calculated as follows: . Arrows indicate points of highest accuracy/least error.
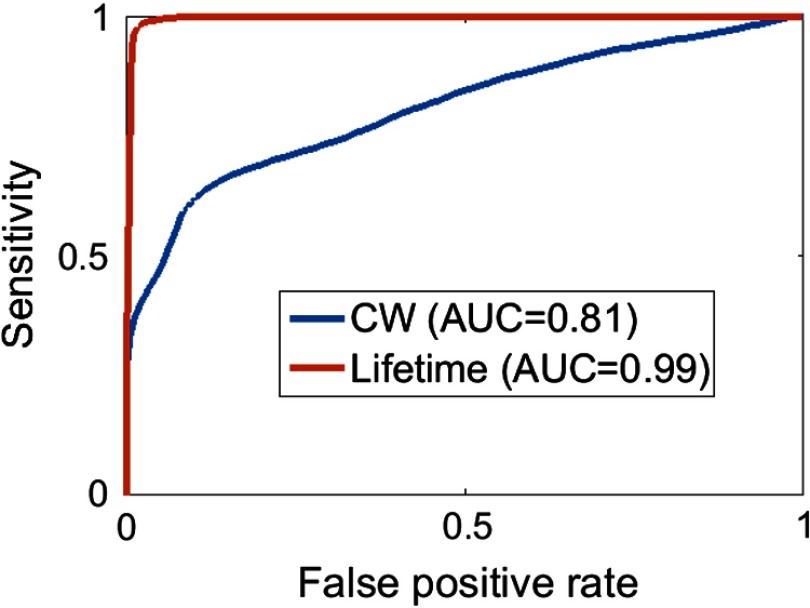
Figure 4 shows the ROC curves for the CW- and FLT-based tumor identification, obtained by plotting the sensitivity versus the false-positive rate (). The FLT-based identification far outperforms the CW intensity with an area under the curve (AUC) of 0.99 for FLT compared to 0.81 for CW. A similar ROC analysis for the 4T1 tumors (not shown) resulted in an AUC of 0.8 for CW and 0.99 for FLT, and for the MDA-MB tumors resulted in an AUC of 0.97 for CW and 0.99 for FLT. Although the performance of CW is comparable to that of FLT for the MDA-MB case, it should be noted that the value of the CW-intensity threshold is not absolute and can be strongly affected by measurement conditions, such as laser power, uniformity of excitation power within the illumination field, variations in camera sensitivity, leakage of excitation light into emission filters, and spurious reflections from more complex tissue surfaces, such as ex-vivo tumor specimens. The FLT threshold, however, is generally more robust to changes in measurement conditions since the FLT is independent of many experimental parameters including excitation intensity and filter leakage.
Fig. 4.
ROC curves for the CW and FLT analysis of the glioma tumor data in Figs. 2(d) and 2(g). .
The goal of the present study was not to identify the origins of the FLT difference between ICG within tumors and tissue AF, but rather to exploit this FLT contrast for enhancing tumor-tissue identification for in-vivo applications. We have observed in control mice that immediately after injection, the ICG FLT is increased in vivo to compared to its in-vitro FLT () in agreement with previous work,5 which attributed the increase in FLT to a change in polarity upon binding to albumin in blood. We have shown that the combination of enhanced ICG retention in tumors, long-time clearance of ICG from normal tissue, and increased FLT compared to surrounding healthy tissue offers a new opportunity for enhancing tumor specificity for clinical applications. The scope of the present study could be extended beyond the use of ICG for tumor identification alone, to enhance the sensitivity of other intraoperative applications of ICG currently in use. The application of FLT contrast for enhanced sensitivity can also extend to other NIR probes under development, including fluorophores that can be specifically labeled for disease targeting. At least two dyes currently in the FDA approval pipeline, IRDye800CW and chlorotoxin-Cy5.5 (tumor paint),6,23 allow specific targeting. Probes can also be designed to shift FL upon binding to disease-specific molecular expression,18,24,25 allowing an “optical switch” property that indicates the presence or absence of a particular disease. As more of these dyes advance to the clinic, FLT imaging can offer enhanced specificity and sensitivity for various disease applications. Our ongoing work is focused on validation and application of ICG-AF FLT contrast for clinical tumor margin assessment.
Acknowledgments
The authors have no relevant financial interests in the manuscript and no other potential conflicts of interest to disclose. This work was supported by the National Institutes of Health under Grant Nos. R01 EB015325 and R01 CA211084, and by the Massachusetts General Hospital ECOR Interim Support Fund.
Disclosures
No conflicts of interest, financial or otherwise, are declared by the authors.
References
- 1.Vahrmeijer A. L., et al. , “Image-guided cancer surgery using near-infrared fluorescence,” Nat. Rev. Clin. Oncol. 10(9), 507–518 (2013). 10.1038/nrclinonc.2013.123 [DOI] [PMC free article] [PubMed] [Google Scholar]
- 2.Gioux S., Choi H. S., Frangioni J. V., “Image-guided surgery using invisible near-infrared light: fundamentals of clinical translation,” Mol. Imaging 9(5), 237 (2010). [PMC free article] [PubMed] [Google Scholar]
- 3.Liu Y., et al. , “First in-human intraoperative imaging of HCC using the fluorescence goggle system and transarterial delivery of near-infrared fluorescent imaging agent: a pilot study,” Transl. Res. 162(5), 324–331 (2013). 10.1016/j.trsl.2013.05.002 [DOI] [PMC free article] [PubMed] [Google Scholar]
- 4.Dsouza A. V., et al. , “Review of fluorescence guided surgery systems: identification of key performance capabilities beyond indocyanine green imaging,” J. Biomed. Opt. 21(8), 080901 (2016). 10.1117/1.JBO.21.8.080901 [DOI] [PMC free article] [PubMed] [Google Scholar]
- 5.Berezin M. Y., et al. , “Engineering NIR dyes for fluorescent lifetime contrast,” in Annual Int. Conf. of the IEEE Engineering in Medicine and Biology Society (EMBC 2009) (2009). 10.1109/IEMBS.2009.5334834 [DOI] [PubMed] [Google Scholar]
- 6.Veiseh M., et al. , “Tumor paint: a chlorotoxin: Cy5. 5 bioconjugate for intraoperative visualization of cancer foci,” Cancer Res. 67(14), 6882–6888 (2007). 10.1158/0008-5472.CAN-06-3948 [DOI] [PubMed] [Google Scholar]
- 7.Zhang R. R., et al. , “Beyond the margins: real-time detection of cancer using targeted fluorophores,” Nat. Rev. Clin. Oncol. (2017). 10.1038/nrclinonc.2016.212 [DOI] [PMC free article] [PubMed] [Google Scholar]
- 8.Schaafsma B. E., et al. , “The clinical use of indocyanine green as a near-infrared fluorescent contrast agent for image-guided oncologic surgery,” J. Surg. Oncol. 104(3), 323–332 (2011). 10.1002/jso.v104.3 [DOI] [PMC free article] [PubMed] [Google Scholar]
- 9.Sevick-Muraca E. M., “Translation of near-infrared fluorescence imaging technologies: emerging clinical applications,” Ann. Rev. Med. 63, 217–231 (2012). 10.1146/annurev-med-070910-083323 [DOI] [PubMed] [Google Scholar]
- 10.Ishizawa T., et al. , “Fluorescent cholangiography illuminating the biliary tree during laparoscopic cholecystectomy,” Br. J. Surg. 97(9), 1369–1377 (2010). 10.1002/bjs.7125 [DOI] [PubMed] [Google Scholar]
- 11.Horowitz N. S., et al. , “Laparoscopy in the near infrared with ICG detects microscopic tumor in women with ovarian cancer: 0078,” Int. J. Gynecol. Cancer 16, 622 (2006). [Google Scholar]
- 12.Yokoyama J., et al. , “A feasibility study of NIR fluorescent image-guided surgery in head and neck cancer based on the assessment of optimum surgical time as revealed through dynamic imaging,” Oncol. Targets Ther. 6, 325–330 (2013). 10.2147/OTT [DOI] [PMC free article] [PubMed] [Google Scholar]
- 13.Corlu A., et al. , “Three-dimensional in vivo fluorescence diffuse optical tomography of breast cancer in humans,” Opt. Express 15(11), 6696–6716 (2007). 10.1364/OE.15.006696 [DOI] [PubMed] [Google Scholar]
- 14.Poellinger A., et al. , “Breast cancer: early- and late-fluorescence near-infrared imaging with indocyanine green—a preliminary study,” Radiology 258(2), 409–416 (2011). 10.1148/radiol.10100258 [DOI] [PubMed] [Google Scholar]
- 15.Jiang J. X., et al. , “Optimization of the enhanced permeability and retention effect for near-infrared imaging of solid tumors with indocyanine green,” Am. J. Nuclear Med. Mol. Imaging 5(4), 390 (2015). [PMC free article] [PubMed] [Google Scholar]
- 16.Heneweer C., et al. , “Magnitude of enhanced permeability and retention effect in tumors with different phenotypes: 89Zr-albumin as a model system,” J. Nucl. Med. 52(4), 625–633 (2011). 10.2967/jnumed.110.083998 [DOI] [PMC free article] [PubMed] [Google Scholar]
- 17.Homulle H. A. R., et al. , “Compact solid-state CMOS single-photon detector array for in vivo NIR fluorescence lifetime oncology measurements,” Biomed. Opt. Express 7(5), 1797–1814 (2016). 10.1364/BOE.7.001797 [DOI] [PMC free article] [PubMed] [Google Scholar]
- 18.Stegehuis P. L., et al. , “Fluorescence lifetime imaging to differentiate bound from unbound ICG-cRGD both in vitro and in vivo,” Proc. SPIE 9313, 93130O (2015). 10.1117/12.2078644 [DOI] [Google Scholar]
- 19.Tummers Q. R. J. G., et al. , “The value of intraoperative near-infrared fluorescence imaging based on enhanced permeability and retention of indocyanine green: feasibility and false-positives in ovarian cancer,” PloS One 10(6), e0129766 (2015). 10.1371/journal.pone.0129766 [DOI] [PMC free article] [PubMed] [Google Scholar]
- 20.Rice W. L., Verkhusha S. D., Kumar A. T. N., “In vivo tomographic imaging of deep seated cancer using fluorescence lifetime contrast,” Cancer Res. 75(7), 1236–1243 (2015). 10.1158/0008-5472.CAN-14-3001 [DOI] [PMC free article] [PubMed] [Google Scholar]
- 21.Kumar A. T. N., et al. , “Feasibility of in vivo imaging of fluorescent proteins using lifetime contrast,” Opt. Lett. 34(13), 2066–2068 (2009). 10.1364/OL.34.002066 [DOI] [PMC free article] [PubMed] [Google Scholar]
- 22.Rice W. L., Kumar A. T. N., “Preclinical whole body time domain fluorescence lifetime multiplexing of fluorescent proteins,” J. Biomed. Opt. 19(4), 046005 (2014). 10.1117/1.JBO.19.4.046005 [DOI] [PMC free article] [PubMed] [Google Scholar]
- 23.Butte P. V., et al. , “Near-infrared imaging of brain tumors using the Tumor Paint BLZ-100 to achieve near-complete resection of brain tumors,” Neurosurgical Focus 36(2), E1 (2014). 10.3171/2013.11.FOCUS13497 [DOI] [PubMed] [Google Scholar]
- 24.Solomon M., et al. , “Detection of enzyme activity in orthotopic murine breast cancer by fluorescence lifetime imaging using a fluorescence resonance energy transfer-based molecular probe,” J. Biomed. Opt. 16(6), 066019 (2011). 10.1117/1.3594153 [DOI] [PMC free article] [PubMed] [Google Scholar]
- 25.Goergen C. J., et al. , “In vivo fluorescence lifetime detection of an activatable probe in infracted myocardium,” J. Biomed. Opt. 17(5), 056001 (2012). 10.1117/1.JBO.17.5.056001 [DOI] [PMC free article] [PubMed] [Google Scholar]


