Abstract
Purpose
To report the findings in three cases in which the average foveal thickness was increased after a thin epiretinal membrane (ERM) was removed by vitrectomy with internal limiting membrane (ILM) peeling.
Methods
The foveal contour was normal preoperatively in all eyes. All cases underwent successful phacovitrectomy with ILM peeling for a thin ERM. The optical coherence tomography (OCT) images were examined before and after the surgery. The changes in the average foveal (1 mm) thickness and the foveal areas within 500 μm from the foveal center were measured. The postoperative changes in the inner and outer retinal areas determined from the cross-sectional OCT images were analyzed.
Results
The average foveal thickness and the inner and outer foveal areas increased significantly after the surgery in each of the three cases. The percentage increase in the average foveal thickness relative to the baseline thickness was 26% in Case 1, 29% in Case 2, and 31% in Case 3. The percentage increase in the foveal inner retinal area was 71% in Case 1, 113% in Case 2, and 110% in Case 3, and the percentage increase in foveal outer retinal area was 8% in Case 1, 13% in Case 2, and 18% in Case 3.
Conclusion
The increase in the average foveal thickness and the inner and outer foveal areas suggests that a centripetal movement of the inner and outer retinal layers toward the foveal center probably occurred due to the ILM peeling.
Keywords: internal limiting membrane, optical coherence tomography, average foveal thickness, epiretinal membrane, vitrectomy
Introduction
Several authors have reported that the central fovea is thicker after internal limiting membrane (ILM) peeling than without ILM peeling.1–5 However, these studies were conducted on eyes with macular diseases such as macular hole (MH),1,2 epiretinal membrane (ERM),2–4 and macular edema.5 The effects of ILM peeling on the average foveal (1 mm) thickness in a normal healthy eye have not been determined.
We performed vitrectomy with ILM peeling on these three eyes with a thin ERM and a normal foveal contour. Optical coherence tomography (OCT) was used to analyze the average foveal thickness and areas before and after the surgery.
Methods
The three eyes underwent successful phacovitrectomy with removal of the thin ERM and ILM peeling. The sequential changes in the average foveal thickness were determined by swept-source optical coherence tomography (SS-OCT; DRI OCT-1 Atlantis; Topcon, Tokyo, Japan). A written informed consent was obtained from all patients for data collections and the use of clinical data in research studies. This study followed the tenets of the Declaration of Helsinki and was approved by the institutional review board of Kami-iida Daiichi General Hospital.
The retinal surface maps were reconstructed from the three-dimensional cube scans, and the macular cube scans were used to measure the average foveal thickness. The central and the inner four sectors as defined by the Early Treatment Diabetic Retinopathy Study (ETDRS) were analyzed. The outer four sectors were not analyzed because of the presence of perifoveal subretinal fluid due to rhegmatogenous retinal detachments (RRDs) in two eyes. The ratio of the temporal to nasal thicknesses (T/N ratio) was used to compare the temporal and nasal differences in the thicknesses after the vitrectomy with ILM peeling.2,6
The vertical and horizontal B-scan images through the foveal center were used to measure the thicknesses of the different retinal layers. The foveal areas of the horizontal and the vertical cross-sectional areas with a radius of 500 μm from the foveal center were measured. This area was bordered vertically by the vitreomacular interface and the ellipsoid zone of the photoreceptors and laterally at the temporal, nasal, superior, and inferior margins 500 μm from the foveal center. The area from the vitreomacular interface to the inner nuclear layer was used to determine the foveal inner retinal area,7 and the remaining area from the outer plexiform layer to the ellipsoid zone of the photoreceptors was used to determine the foveal outer retinal area.
The foveal outer and inner areas were measured using horizontal and vertical OCT cross-sectional images of the foveal center to the temporal, nasal, superior, and inferior margins located 500 μm from the foveal center. The values at 1 mm section centered on a foveal pit for horizontal and vertical OCT cross-sections were averaged to obtain measurements for the foveal sectors.
The OCT images of 1:1 μm setting rather than 1:1 pixel settings were used for the measurements of the areas of the fovea. The areas were measured by manual segmentation using the ImageJ software (National Institutes of Health, Bethesda, MD, USA). The areas of retinal selections for the foveal inner and outer retinal areas are shown in Figure 1. The retinal areas were reported in mm2.
Figure 1.
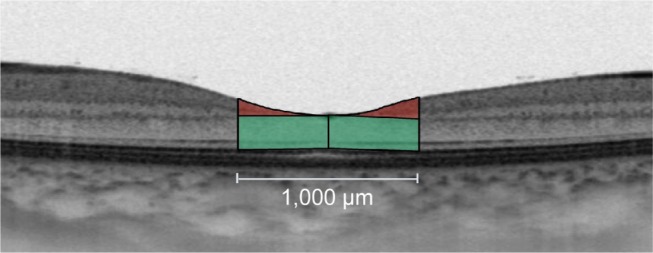
Sample selections of foveal inner and outer retinal areas measured within 500 μm from the foveal center in mm2.
Notes: Foveal inner retinal area from the vitreomacular interface to the inner nuclear layer is shown in red. Foveal outer retinal area from the outer plexiform layer to the ellipsoid zone of the photoreceptors is shown in green.
Results
The clinical characteristics of the three cases are summarized in Table 1. Three cases of thin ERM were adopted in our study because the foveal contour was normal and the patients had no systemic diseases resulting in retinal diseases, such as uncontrolled hypertension and diabetes mellitus. All the cases underwent phacoemulsification, intraocular lens implantation followed by vitrectomy, ERM removal, and brilliant blue G (BBG)-assisted ILM peeling within the vascular arcade. Cases 1 and 2 had a peripheral RRD without macular detachment, which was also treated during the surgery. In these two cases, the retina was tamponaded with SF6 at the completion of the surgery, and the patients were instructed to maintain a face-down position for 1 week postoperatively. The retina was reattached in both cases.
Table 1.
Clinical characteristics of the three eyes with a thin ERM and normal foveal contour
| Case | Age (years) | Sex | Eye | BCVA
|
P-F distance (mm)
|
Complications | Follow-up period (months) | ||
|---|---|---|---|---|---|---|---|---|---|
| Pre | Final | Pre | Final | ||||||
| 1 | 63 | F | R | 20/20 | 20/20 | 4.59 | 4.49 | RRD – two quadrants | 6 |
| 2 | 50 | M | R | 20/40 | 20/20 | 4.26 | 3.91 | RRD – two quadrants | 6 |
| 3 | 58 | F | R | 20/25 | 20/20 | 4.93 | 4.74 | None | 1 |
Abbreviations: ERM, epiretinal membrane; BCVA, best-corrected visual acuity; P-F, papillofoveal; F, female; R, right; RRD, rhegmatogenous retinal detachment; M, male.
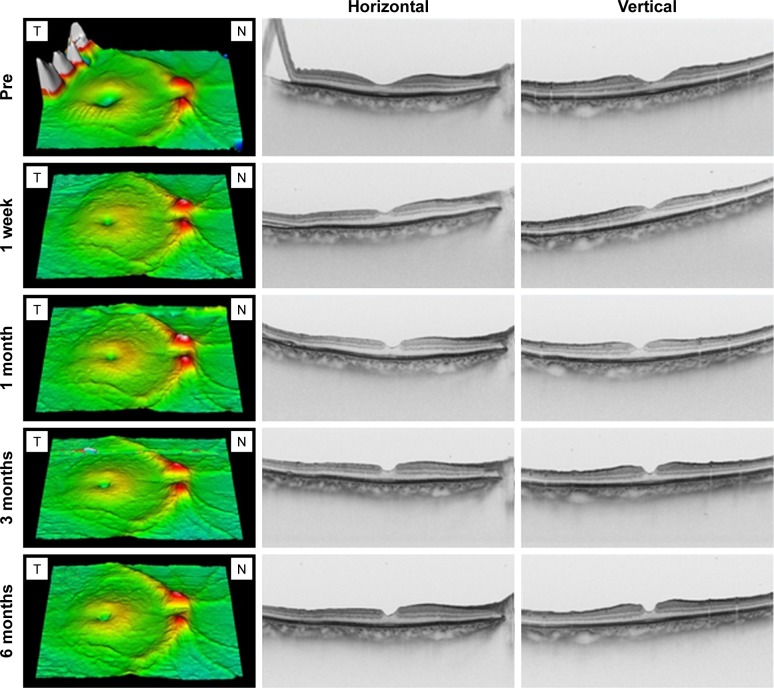
The sequential changes in the foveal area of the retinal surface maps and OCT images of Case 1 are shown in Figure 2. The diameter of the foveal pit became smaller, and the parafoveal thickness increased starting from the first postoperative week. A thinning in the temporal area and a thickening in the nasal area were observed.
Figure 2.
Sequential changes in the macula of the retinal surface maps and OCT images of Case 1.
Abbreviations: OCT, optical coherence tomography; T, temporal; N, nasal.
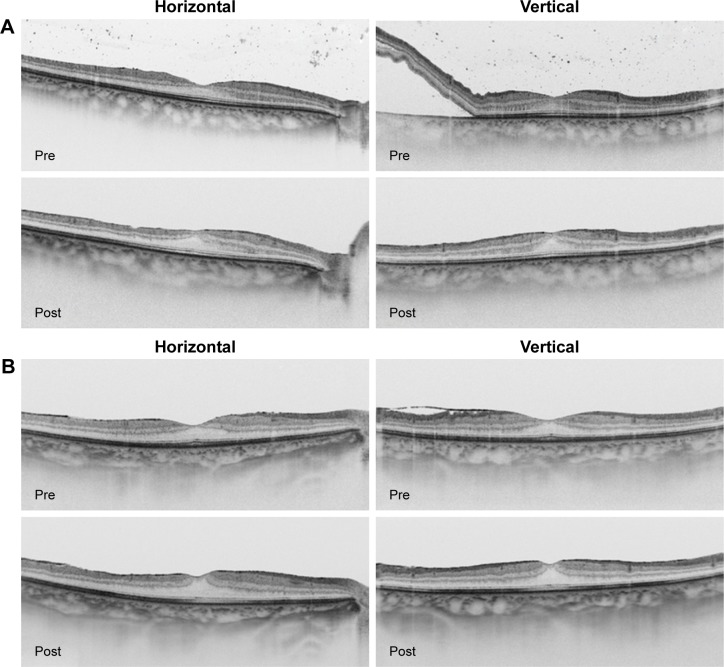
The vertical and horizontal B-scan images of Case 2 preoperatively and at 6 months postoperatively are shown in Figure 3 (top right and top left). The vertical and horizontal B-scan images of Case 3 preoperatively and 1 month postoperatively are shown in Figure 3 (bottom right and bottom left).
Figure 3.
Pre- and postoperative OCT images of Case 2 and Case 3.
Notes: The vertical and horizontal B-scan images preoperatively and at the final visit postoperatively of Case 2 (A). The vertical and horizontal B-scan images preoperatively and at the final visit of Case 3 (B).
The changes in the average foveal thickness during the follow-up period for each case are shown in Figure 4. All the eyes had an increase in the average foveal thickness relative to the baseline. The percentage increase at the final visit was 26% in Case 1, 29% in Case 2, and 31% in Case 3, and the mean percentage increase was 28.6%.
Figure 4.
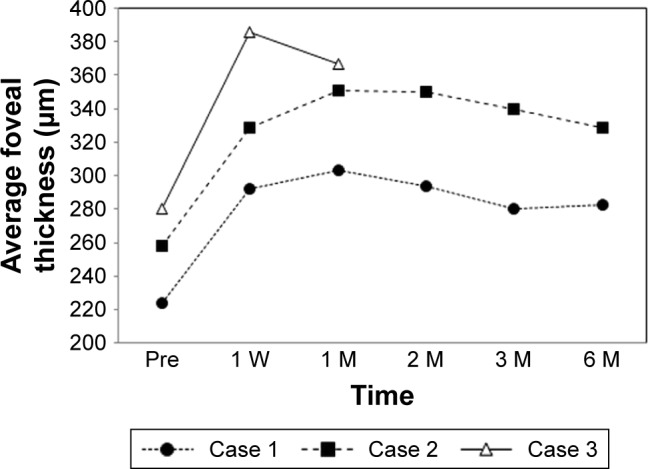
Sequential changes in the average foveal thicknesses during the follow-up period in each case.
Abbreviations: W, week; M, month.
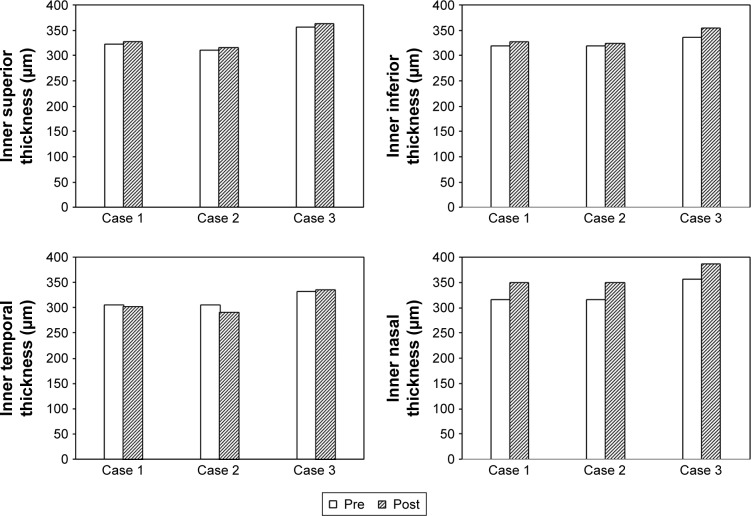
The thicknesses of the inner four ETDRS sectors pre-operatively and at the final visit postoperatively are shown in Figure 5 for each case. The mean percentage increase was 2.0% (all 2.0%) in the inner superior sector, −1.3% (range, −5%–2%) in the inner temporal sector, 3.0% (range, 1%–5%) in the inner inferior sector, and 9.3% (range, 8%–~10%) in the inner nasal sector. The preoperative T/N ratios were 0.97 in Case 1, 0.97 in Case 2, and 0.93 in Case 3, and the T/N ratios at the final visit were 0.87 in Case 1,0.83 in Case 2, and 0.88 in Case 3.
Figure 5.
Thicknesses of the inner four ETDRS sectors preoperatively and at the final visit postoperatively in each case.
Abbreviation: ETDRS, Early Treatment Diabetic Retinopathy Study.
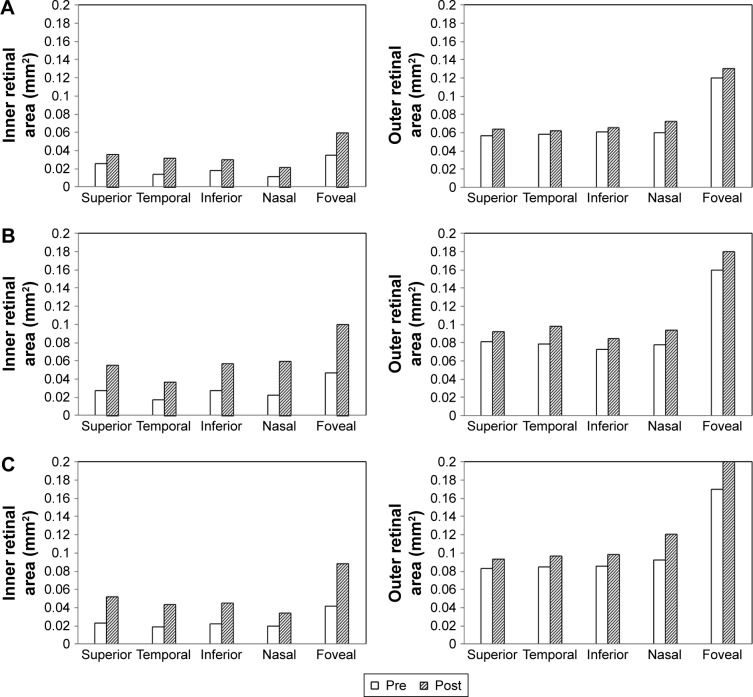
The foveal inner and outer retinal areas preoperatively and at the final postoperative examination are shown in Figure 6 for each case. The area from the foveal center to the four points 500 μm away from the center (superior, temporal, inferior, and nasal) were measured in the horizontal and vertical OCT cross-sectional images. The measurements obtained at 1 mm, including the foveal center for both horizontal and vertical OCT cross-sectional images, were averaged to obtain the foveal section areas. Both the inner and outer retinal areas in each sector increased after the surgery in the three cases. The mean percentage increase in the foveal inner retinal area was 98.0% (range, 71%–113%) in the foveal section. The mean percentage increase in the foveal inner retinal area was 89.3% in the superior sector, 126.3% in the temporal sector, 94.3% in the inferior sector, and 114.0% in the nasal sector.
Figure 6.
Changes in the foveal inner and outer retinal areas preoperatively and at the final visit postoperatively for Case 1 (A), Case 2 (B), and Case 3 (C).
The mean percentage increase in the foveal outer retinal area was 13.0% (range, 8%–18%) in the foveal section. The mean percentage increase in the foveal outer retinal area was 12.7% in the superior sector, 15.0% in the temporal sector, 12.3% in the inferior sector, and 25.3% in the nasal sector.
Discussion
Our results showed that the average thickness of the fovea and the foveal inner and outer areas increased after the surgery in the three eyes. The mean percentage increase was 28.6% for the average foveal thickness, 98.0% for the inner retinal area, and 13.0% for the outer retinal area. These increases following the vitrectomy with ILM peeling suggest that the increase may be related to the ILM peeling.
In these three eyes, the surgical procedures included cataract surgery, vitrectomy, ERM removal, and ILM peeling with a staining of the ILM. A gas tamponade was used in the two cases with a RRD. In another case series, we performed vitrectomy with gas tamponade without ILM peeling in 17 eyes with a RRD and a normal foveal contour. We observed no change in the shape of the foveal pit (unpublished data). We have also performed phacovitrectomy, ERM removal with BBG staining but without ILM peeling, in a case of a thin ERM with a normal foveal contour. We did not observe any change in the shape of the foveal pit in this case (unpublished data). It is more likely that the ILM peeling was the major factor contributing to the increase in the average foveal thickness and the smaller pit diameter. In addition, all three cases had a decrease in the T/N ratio after the surgery. It is most likely that the morphological changes in our cases were due to the ILM peeling procedures.
Retinal swelling associated with ILM peeling may be one reason for the increase in the average foveal thickness. The ILM is the basement membrane of the Müller cells, and the Müller cells play important roles in maintaining the physiology of the retina. A swelling of the nerve fiber layer occurs after ILM peeling during the early postoperative period.8 Spaide (in Chang4) stated that the removal of the ILM facilitates the flow of fluid into the inner retinal layer from the vitreous cavity because the ILM is a barrier for water transport between the inner retina and the vitreous humor. Therefore, the foveal thickening during the early postoperative period might be related to the retinal swelling. However, the retinal swelling theory cannot explain the regional differences in the thickening, such as the thinning in the inner temporal ETDRS sector, as shown in Figure 4. It seems unlikely that the retinal swelling was a major reason for the increase in the average foveal thickness.
Movements of the retinal tissues associated with ILM peeling are well recognized to occur after treatment for several retinal diseases such as MH,9–13 ERM,14 and diabetic macular edema.15 These retinal movements may contribute to the healing processes after the surgery. Our three cases had a thin ERM, but the foveal contour was normal. Thus, changes in the average foveal thickness in these cases were more likely caused by the ILM peeling.
The average foveal inner retinal area increased after the surgery in all cases. The mean percentage increase was 98.0% in the foveal sector, and the mean percentage of increase at each of the four surrounding sectors ranged from 89% to 126%. Similarly, the foveal outer retinal area increased after the surgery in all cases. The mean percentage increase was 13.0% in the foveal sector, and the mean percentage increase at each of the four surrounding sectors ranged from 13% to 25%. The increase in the foveal area suggests that a lateral compression of the retinal cells occurred at the foveal center after the inner and outer retinal layers moved centripetally. We recently reported a case that suggested a centripetal movement of the inner retinal layers from the movement of the vessel bifurcation points after ILM peeling.16 We also found that a decrease in the size of the foveal avascular zone (FAZ) occurred postoperatively, as seen by optical coherence tomography angiography in Case 3. The decrease in FAZ area suggests that a centripetal movement of retinal layers occurs after ILM peeling.17
Several studies have demonstrated a displacement of the fovea toward the optic disk after ILM peeling.10–13,15 The present three cases also showed a reduction in the papillofoveal distances, suggesting that a centripetal retinal movement and retinal displacement toward the optic disk may have occurred simultaneously.
This study has several limitations. First, the findings were observed in only three eyes. Although the foveal contour was normal in these eyes, the diagnosis for each eye was different (two macula-on RRDs and one ERM). Further data collection from the eyes of same diagnoses and non-ILM-peeled controls is necessary to draw a statistical conclusion on this study, since our current data are simple calculations based on three cases. Second, the postoperative observation period varied among the cases. However, it is known that the average foveal thickness in ILM-peeled eyes remains thick even after the long-term follow-up periods.1–3,5,6,18,19
Conclusion
Our cases had an increase in the average foveal thickness and foveal areas after vitrectomy with ILM peeling. Our findings suggest that a centripetal movement of the foveal inner and outer retinal layers occurred after the ILM peeling. This centripetal movement may be a key factor for better central visual acuity after the ILM peeling. Further studies are needed to determine the underlying mechanisms of these retinal movements.
Footnotes
Disclosure
The authors report no conflicts of interest in this work.
References
- 1.Christensen UC, Krøyer K, Sander B, Jorgensen TM, Larsen M, La Cour M. Macular morphology and visual acuity after macular hole surgery with or without internal limiting membrane peeling. Br J Ophthalmol. 2010;94(1):41–47. doi: 10.1136/bjo.2009.159582. [DOI] [PubMed] [Google Scholar]
- 2.Kumagai K, Ogino N, Furukawa M, et al. Retinal thickness after vitrectomy and internal limiting membrane peeling for macular hole and epiretinal membrane. Clin Ophthalmol. 2012;6:679–688. doi: 10.2147/OPTH.S30288. [DOI] [PMC free article] [PubMed] [Google Scholar]
- 3.Lee JW, Kim IT. Outcomes of idiopathic macular epiretinal membrane removal with and without internal limiting membrane peeling: a comparative study. Jpn J Ophthalmol. 2010;54(2):129–134. doi: 10.1007/s10384-009-0778-0. [DOI] [PubMed] [Google Scholar]
- 4.Chang S. Controversies regarding internal limiting membrane peeling in idiopathic epiretinal membrane and macular hole. Retina. 2012;32(suppl 2):S200–S203. doi: 10.1097/IAE.0b013e31825bc02b. discussion S203–S204. [DOI] [PubMed] [Google Scholar]
- 5.Kumagai K, Furukawa M, Ogino N, Larson E. Possible effects of internal limiting membrane peeling in vitrectomy for macular vein occlusion. Jpn J Ophthalmol. 2010;54(1):61–65. doi: 10.1007/s10384-009-0750-z. [DOI] [PubMed] [Google Scholar]
- 6.Kumagai K, Hangai M, Ogino N. Progressive thinning of regional macular thickness after epiretinal membrane surgery. Invest Ophthalmol Vis Sci. 2015;56(12):7236–7242. doi: 10.1167/iovs.15-17794. [DOI] [PubMed] [Google Scholar]
- 7.Tick S, Rossant F, Ghorbel I, et al. Foveal shape and structure in a normal population. Invest Ophthalmol Vis Sci. 2011;52(8):5105–5110. doi: 10.1167/iovs.10-7005. [DOI] [PubMed] [Google Scholar]
- 8.Clark A, Balducci N, Pichi F, et al. Swelling of the arcuate nerve fiber layer after internal limiting membrane peeling. Retina. 2012;32(8):1608–1613. doi: 10.1097/IAE.0b013e3182437e86. [DOI] [PubMed] [Google Scholar]
- 9.Yanagita T, Shimizu K, Fujimura F, Takano M. Fixation point after successful macular hole surgery with internal limiting membrane peeling. Ophthalmic Surg Lasers Imaging. 2009;40(2):109–114. doi: 10.3928/15428877-20090301-23. [DOI] [PubMed] [Google Scholar]
- 10.Kawano K, Ito Y, Kondo M, et al. Displacement of foveal area toward optic disc after macular hole surgery with internal limiting membrane peeling. Eye. 2013;27(7):871–877. doi: 10.1038/eye.2013.99. [DOI] [PMC free article] [PubMed] [Google Scholar]
- 11.Nakagomi T, Goto T, Tateno Y, Oshiro T, Iijima H. Macular slippage after macular hole surgery with internal limiting membrane peeling. Curr Eye Res. 2013;38(12):1255–1260. doi: 10.3109/02713683.2013.811261. [DOI] [PubMed] [Google Scholar]
- 12.Ishida M, Ichikawa Y, Higashida R, Tsutsumi Y, Ishikawa A, Imamura Y. Retinal displacement toward optic disc after internal limiting membrane peeling for idiopathic macular hole. Am J Ophthalmol. 2014;157(5):971–977. doi: 10.1016/j.ajo.2014.01.026. [DOI] [PubMed] [Google Scholar]
- 13.Itoh Y, Inoue M, Rii T, Ando Y, Hirakata A. Asymmetrical recovery of cone outer segment tips line and foveal displacement after successful macular hole surgery. Invest Ophthalmol Vis Sci. 2014;55(5):3003–3011. doi: 10.1167/iovs.14-13973. [DOI] [PubMed] [Google Scholar]
- 14.Nitta E, Shiraga F, Shiragami C, Fukuda K, Yamashita A, Fujiwara A. Displacement of the retina and its recovery after vitrectomy in idiopathic epiretinal membrane. Am J Ophthalmol. 2013;155(6):1014–1020. doi: 10.1016/j.ajo.2013.01.021. [DOI] [PubMed] [Google Scholar]
- 15.Yoshikawa M, Murakami T, Nishijima K, et al. Macular migration toward the optic disc after inner limiting membrane peeling for diabetic macular edema. Invest Ophthalmol Vis Sci. 2013;54(1):629–635. doi: 10.1167/iovs.12-10907. [DOI] [PubMed] [Google Scholar]
- 16.Kumagai K, Hangai M, Furukawa M, Suetsugu T, Ogino N. Centripetal movement of the capillaries in the central macular region after internal limiting membrane peeling. Retina Cases Brief Rep. 2017 Jan 11; doi: 10.1097/ICB.0000000000000526. Epub. [DOI] [PubMed] [Google Scholar]
- 17.Kumagai K, Uemura A, Furukawa M, Suetsugu T, Ogino N. Decrease of the foveal avascular zone area after internal limiting membrane peeling: single case study. Int Med Case Rep J. 2017;10:81–85. doi: 10.2147/IMCRJ.S129174. [DOI] [PMC free article] [PubMed] [Google Scholar]
- 18.Purtskhvanidze K, Treumer F, Junge O, Hedderich J, Roider J, Hillenkamp J. The long-term course of functional and anatomical recovery after macular hole surgery. Invest Ophthalmol Vis Sci. 2013;54(7):4882–4891. doi: 10.1167/iovs.13-11699. [DOI] [PubMed] [Google Scholar]
- 19.Kumagai K, Hangai M, Larson E, Ogino N. Progressive changes of regional macular thickness after macular hole surgery with internal limiting membrane peeling. Invest Ophthalmol Vis Sci. 2013;54(7):4491–4497. doi: 10.1167/iovs.13-11662. [DOI] [PubMed] [Google Scholar]


