

Summary
In the CNS, glutamate is both phasically and tonically released into the extracellular space, and must be removed by excitatory amino acid transporters (EAATs) to prevent excitotoxic accumulation. There remains uncertainty, however, regarding the functional steady-state concentration, with estimates ranging from tens of nanomolar to tens of micromolar. Efforts to reconcile these disparate values have led to a hypothesis that the extracellular space is comprised of distinct compartments in which basal glutamate concentrations are maintained independently. We used electrophysiology and two-photon Ca2+ imaging to test this hypothesis in the nucleus accumbens (NAc), where it has been proposed that micromolar extracellular glutamate is necessary for normal function. We found that the average concentration of synaptic glutamate is nanomolar, in agreement with previous electrophysiological estimates. Furthermore, this held true when glutamate uptake was inhibited, indicating that extracellular glutamate is not compartmentalized by EAATs.
eTOC Blurb
Glutamate is present in the extracellular space surrounding neurons, but it is unclear whether the steady-state concentration in synaptic and non-synaptic areas is the same. Chiu and Jahr show that basal extracellular glutamate is nanomolar, both in- and outside the synaptic cleft.
Introduction
Both AMPA- and NMDA-type glutamate receptors undergo desensitization (Colquhoun et al., 1992; Silver et al., 1996; Trussell and Fischbach, 1989), suggesting that normal receptor function depends on limited exposure to glutamate (Diamond, 2001). EAATs are vital for maintainence of low background levels of glutamate, as glutamate is not only released phasically from synaptic vesicles, but also tonically, from non-synaptic sources (Cavelier and Attwell, 2005; Jabaudon et al., 1999; Le Meur et al., 2007), in an activity-independent manner (Herman and Jahr, 2007). The net result of release and uptake is a non-zero concentration of glutamate, but there remains controversy as to its magnitude and distribution.
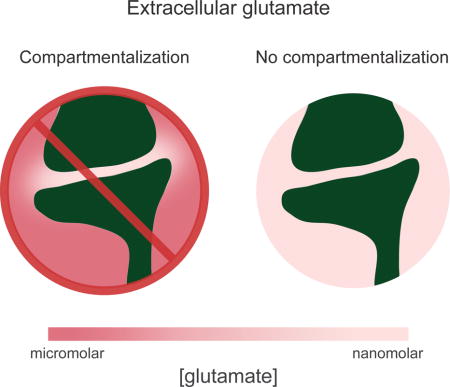
Measurements of the average extracellular concentration of glutamate in acute brain slices range from 25 to 90 nM (Cavelier and Attwell, 2005; Herman and Jahr, 2007; Le Meur et al., 2007). However, estimates from in vivo microdialysis are much higher, ranging from 0.2 to 35 μM (De Bundel et al., 2011; Dash et al., 2009). It has been proposed that this discrepancy reflects the compartmentalization of extracellular glutamate by inhomogeneous densities of EAATs, such that it is nanomolar in the synaptic cleft, but micromolar in non-synaptic space (Kalivas, 2009; Moussawi et al., 2011a). Ultrastructural evidence for this radical compartmentalization by EAATs is lacking (Danbolt, 2001; Ventura and Harris, 1999), however, and studies of differential activation of receptors in the two compartments in hippocampal slice have yielded contradictory results (Herman et al., 2011; Wu et al., 2012).
We chose to further investigate extracellular glutamate in NAc, where it has been reported that modulation of micromolar, non-synaptic glutamate is instrumental in the expression of drug withdrawal behaviors via a reduction in tonic metabotropic glutamate receptor (mGluR) activation (Javitt et al., 2011; LaLumiere and Kalivas, 2008; Moussawi et al., 2011b). Because evidence from hippocampus suggests that basal extracellular glutamate is too low to tonically activate mGluRs (Gueler et al., 2007), if such activation occurs in the NAc core, either extracellular glutamate is higher than in hippocampus, or a non-synaptic compartment of micromolar extracellular glutamate must exist, or both.
With a combination of electrophysiology and two-photon Ca2+ imaging, we utilized NMDA receptors (NMDARs) as glutamate sensors, taking advantage of their high affinity (~2 μM; Hansen et al., 2014; Herman and Jahr, 2007), endogenous expression, and Ca2+ permeability to report the concentration of extracellular glutamate in acute slices of rat NAc. Activation of synaptic NMDARs by basal extracellular glutamate was commensurate with a nanomolar concentration. In light of this, we tested the hypothesis that EAATs maintain compartments of micromolar extracellular glutamate that are normally inaccessible to detection by electrophysiological recordings. Our results indicate that non-synaptic extracellular glutamate is also nanomolar.
Results
NMDAR current in NAc medium spiny neurons reflects nanomolar glutamate
In whole-cell voltage clamp recordings from medium spiny neurons (MSNs) in the NAc core, we measured a standing outward current at +40 mV in the presence of NBQX, TTX, and picrotoxin. Application of the competitive NMDAR antagonist D-AP5 (100 μM) reduced the outward current (Figure 1A), indicating that basal extracellular glutamate (glue) is present at a concentration high enough to activate NMDARs. To compare across cells we normalized the current blocked by D-AP5 to the current evoked by the NMDAR agonist NMDA (5 μM; Figure 1A), which, unlike glutamate, is not taken up by EAATs and can therefore be used for accurate dose-response measurements in slice. On average, the D-AP5-sensitive current was 11.9 ± 1.8% of the response to 5 μM NMDA (n = 19). As this concentration of NMDA evokes 7.3% of the maximal NMDA current (Imax, NMDA; Herman and Jahr, 2007), the average standing NMDAR current was less than 1% of Imax, NMDA (Figure 1B).
Figure 1. Standing NMDAR-mediated current in MSNs reflects nanomolar glutamate.
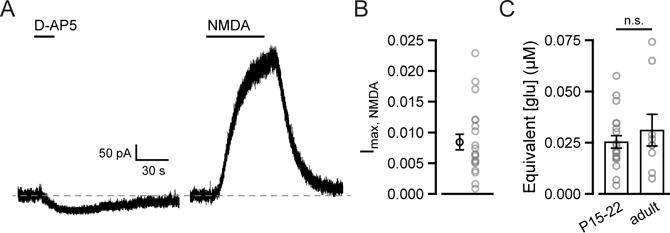
(A) Current traces from MSN voltage-clamped at +40 mV aligned to baseline (dashed line) show inhibition of a standing current by 100 μM D-AP5 and outward current evoked by 5 μM NMDA.
(B) The current blocked by 100 μM D-AP5 was 0.87 ± 0.13% of maximal NMDA current (n = 19).
(C) The concentration of glutamate that corresponds to the D-AP5 sensitive current is 25.6 ± 3.2 nM in juvenile (P15–22, n = 19) and 31.7 ± 8.7 nM in adult (8–12 weeks, n = 8) rats.
In summary graphs, mean values (± SEM) are shown in black; data from individual cells in grey.
To estimate the concentration of glutamate this corresponds to, we converted the fraction of Imax, NMDA to a fraction of maximal activation by glutamate (Imax, glu) using previously established dose-response relationships for NMDA and glutamate (Herman and Jahr, 2007; Patneau and Mayer, 1990). We found that the standing NMDAR-mediated current was equivalent to that evoked by 25.6 ± 3.2 nM glutamate (n = 19; Figure 1C).
This concentration matches the value obtained from hippocampal slice (25 nM; Herman and Jahr, 2007), but conflicts with estimates from the NAc core made by in vivo microdialysis in older animals (5–6 μM; Baker et al., 2003; Miguéns et al., 2008), and is too low to appreciably activate mGluRs (Schoepp et al., 1999). We tested whether a developmental shift could account for the discrepancy by extrapolating [glue] from NMDAR-mediated standing current in adult rats (8–12 weeks old; 250–385 g) and found no difference between age groups (31.7 ± 8.7 nM, n = 8; p = 0.7, Mann-Whitney U test; Figure 1C).
These results indicate that discrepancies in the literature are not attributable to brain region-specific or age-related differences in glue regulation. If, as has been proposed, glue is compartmentalized by EAATs, then whole-cell NMDAR current may not accurately reflect the average concentration of glue but rather the average concentration in the synaptic cleft, where the majority of NMDARs are expressed. Should non-synaptic glue be present at micromolar concentrations, it would not only explain the discrepancies between estimates made using different techniques, but also how glue could tonically activate mGluRs. Using two-photon laser scanning microscopy (2PLSM) to monitor the location of activated NMDARs, we can test this proposal directly.
Activation of NMDARs by extracellular glutamate can be resolved at single spines
To spatially resolve the activation of NMDARs by glue, we performed line scans across proximal MSN spines and dendrites. We included the fluorophores Alexa 594 (10 μM) and Fluo-5F (240 μM) in the internal solution to visualize MSN morphology and monitor intracellular Ca2+ excursions, respectively (Figure 2A). While NMDARs may be bound by glue at any time, with extracellular Mg2+ present, they will not pass Ca2+ at −70 mV. To delineate a time window in which NMDAR-mediated Ca2+ transients could be observed, during each line scan the cell was depolarized from −70 mV to +5 mV to relieve voltage-dependent Mg2+ block. To isolate Ca2+ influx through NMDARs, Ca2+-permeable AMPA receptors (AMPARs) and voltage-sensitive Ca2+ channels (VSCCs) were pharmacologically blocked (Carter and Sabatini, 2004). Release from internal stores was left unblocked, as it is not thought to contribute significantly to Ca2+ transients under these conditions (Mainen et al., 1999).
Figure 2. Variance analysis of calcium signals reveals NMDAR detection of extracellular glutamate at MSN spines.
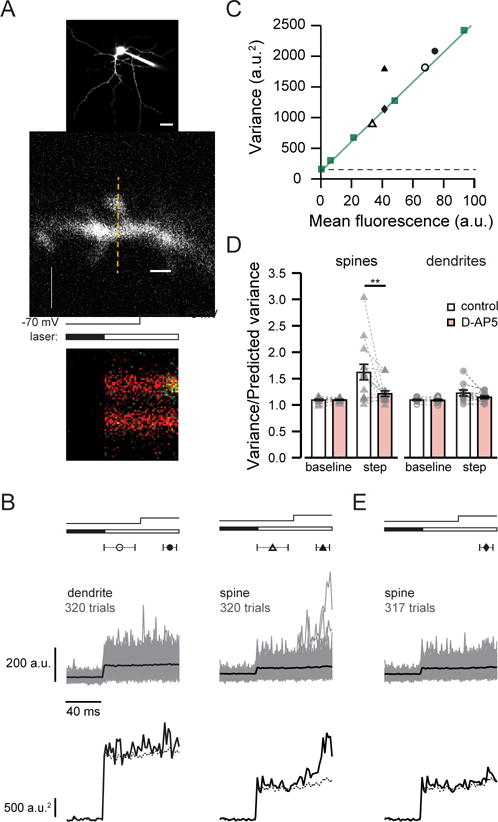
(A) top, 2PLSM image of MSN filled with Alexa 594 and Fluo-5F. Scale bar: 20 μm. middle, MSN dendritic spine and shaft showing line scan position (dashed line) Scale bar: 2 μm. bottom, line scan showing fluorescence in the green channel increasing sharply during depolarization in the spine but not the dendrite. Timing of depolarization and shutter opening indicated above.
(B) Fluo-5F fluorescence (upper traces, average in black) and variance (lower traces) from 320 trials from the dendrite shaft and spine shown in (A). Symbols indicate the times used to calculate baseline (open) and step (closed) fluorescence and variance. Predicted variance (dashed line) reflects the sum of dark noise and the shot noise of the mean fluorescence signal. Timing of depolarization and shutter opening indicated as in (A).
(C) Baseline (open symbols) and step (closed symbols) variance versus mean fluorescence for the spine (triangles) and dendrite shaft (circles) shown in (A). Measurements of pipette fluorescence (squares) reflect shot noise; the slope of the line fit (green) was used to calculate predicted variance. Variance due to dark noise indicated by dashed line.
(D) Summary graphs show measured variance normalized to predicted variance in spines and dendrite shafts. D-AP5 reduced step variance in spines but not dendrite shafts, and did not affect baseline variance. Data are represented as mean ± SEM; individual pairs in grey.
(E) Removal of three of 320 trials shown in (B) greatly reduced step variance for the spine. The variance of the remaining trials is predicted by shot noise, as shown also in (C) with closed diamond.
Given our estimate of ~25 nM glutamate, we reasoned that the likelihood of observing an NMDAR-mediated Ca2+ transient in the absence of stimulation was very low. To overcome this potential impediment to detecting NMDAR activation, we used a method of variance analysis of Ca2+ signals described by Sabatini and Svoboda (2000).
Fluorescence measurements made by 2PLSM have two inherent sources of variance: dark noise and shot noise. With other sources of Ca2+ entry inhibited, the variance of the Fluo-5F signal is the sum of these components plus the variance due to the stochastic occurrence of NMDAR-mediated Ca2+ transients. By measuring shot noise and dark noise, we could predict the variance for a given mean fluorescence (see Methods; Figures 2B and 2C).
Trial-to-trial fluctuations in baseline fluorescence (Vhold = −70 mV) were predicted well by shot noise, but fluctuations in step fluorescence (Vhold = +5 mV) were greater than predicted (Figures 2B, 2C, and 2D), suggesting a contribution from NMDARs. In the presence of 100 μM D-AP5, spine step variance decreased from 162.0 ± 14.7% to 121.4 ± 5.3% of predicted step variance (n = 14; p = 0.004, Wilcoxon matched-pairs signed-ranks test). In contrast, dendrite step variance was unaffected by D-AP5 (122.9 ± 5.7% of predicted step variance in control versus 114.9 ± 2.9% in D-AP5, n = 10; p = 0.1). D-AP5 had no effect on baseline variance in either spines or dendrite shafts (spines: 110.0 ± 1.5% versus 110.9 ± 1.0%; p = 0.8; dendrites: 110.0 ± 1.4% vesus 109.0 ± 1.9%; p = 0.6).
When step variance was much greater than the prediction, we were able to identify the individual trials that gave rise to the excess variance. In the example in Figure 2B, three trials out of 320 showed step transients easily distinguishable above the mean in the spine but not the dendrite shaft. If we removed these trials and recalculated mean fluorescence and variance, step variance no longer exceeded that predicted by shot noise (Figures 2C and 2E). Large Ca2+ transients such as these occurred infrequently; we observed them in less than 1% of all trials in control recording conditions (78 events/10,513 trials = 0.74%). They only occurred when the cell was depolarized to +5 mV, and were abolished in the presence of D-AP5, suggesting that these transients represent NMDAR openings.
Although extrasynaptic NMDARs are thought to be present in MSNs (Botelho et al., 2014; Ortinski et al., 2013; Shen et al., 2014), putative NMDAR-mediated Ca2+ transients were observed in line scans across dendritic shafts in only 6 of 7596 trials (0.08%), consistent with the failure of D-AP5 to alter dendrite step variance (Figure 2D). This result can be interpreted in two ways: one, glue is lower at shafts than spines; or two, we were unable to observe shaft Ca2+ transients due to the low expression of shaft NMDARs. Without a way to confirm their presence on a region of parent dendrite prior to each experiment, we cannot rule out the latter explanation, and therefore cannot use shaft Ca2+ transients to draw conclusions about local glutamate concentration. By inhibiting EAATs, however, we used spine NMDARs to report extrasynaptic glutamate.
Inhibition of uptake does not result in micromolar glutamate at spines
To determine the effect of transporter inhibition, we monitored whole-cell current in MSNs held at +40 mV in the presence of TTX, NBQX, picrotoxin, and VSCC inhibitors. Application of a saturating concentration of DL-TBOA (100 μM; Bergles et al., 2002; Shimamoto et al., 1998) caused an outward current (Figure 3A). Using NMDA to evoke a reference current, we found that the average current in 100 μM DL-TBOA was equivalent to activation by 123.2 ± 10.5 nM glutamate (n = 16) in juvenile rats and 142.5 ± 21.1 nM in adult rats (n = 4; p = 0.4, Mann-Whitney U test; Figure 3B).
Figure 3. Extracellular glutamate at spines remains nanomolar with uptake blocked.
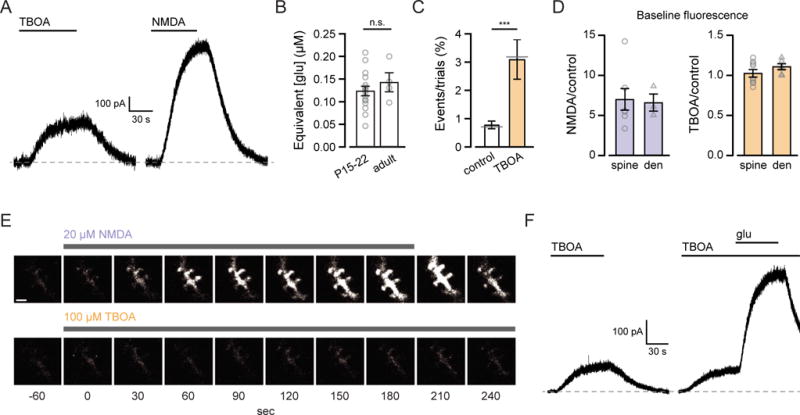
(A) Current traces from MSN voltage-clamped at +40 mV during application of 100 μM DL-TBOA and 5 μM NMDA.
(B) Steady-state currents evoked by 100 μM TBOA corresponded to activation by 123.2 ± 10.5 nM glutamate in juvenile (n = 16) and 142.5 ± 21.2 nM in adult rats (n = 4).
(C) The average frequency of NMDAR-mediated calcium transients increased in 100 μM DL-TBOA. In each condition the sum of trials that showed NMDAR-mediated calcium transients divided by the sum of all trials is denoted by the grey lines (control: 78/10,513 = 0.74%; DL-TBOA: 55/1709 = 3.22%).
(D) Normalized baseline fluorescence in 20 μM NMDA and 100 μM DL-TBOA in spines (triangles) and dendrites (circles).
(E) Frame scans from the green channel during application of 20 μM NMDA (top) and 100 μM DL-TBOA (bottom). Drug application duration indicated by the bars above the images. Vhold = −70 mV throughout. Scale bar: 2 μm.
(F) Current traces from MSN voltage-clamped at +40 mV during application of 100 μM DL-TBOA and 100 μM DL-TBOA plus 1 μM glutamate.
In summary graphs, mean values (± SEM) are shown in black; data from individual cells in grey.
Next, we monitored Ca2+ influx through spine NMDARs while blocking EAATs. After wash-in of 100 μM DL-TBOA, large Ca2+ transients were observed in 3.09 ± 0.69% of trials (n = 9) compared to 0.77 ± 0.14% (n = 53 spines) in control (p = 0.0008, Mann-Whitney U test; Figure 3C). The highest rate observed in a single spine in the presence of 100 μM DL-TBOA was 7.2% (13/181 trials). According to the dose-response relationship, 7.5% of maximal NMDAR activation by glutamate corresponds to a concentration of 179 nM, which is similar to the highest concentration measured using whole-cell current (208 nM, Figure 3B).
We wanted to compare the rate of large Ca2+ transients in DL-TBOA with the rate in 20 μM NMDA, a dose equipotent to ~0.5 μM glutamate. Superfusion of the slice with 20 μM NMDA resulted in an increase in holding current and intracellular Ca2+; green fluorescence relative to red fluorescence at −70 mV increased five- to ten-fold in spines and dendrites (Figures 3D and 3E). The amplitude of this increase exceeded peak fluorescence of previously measured Ca2+ transients and approached dye saturation, precluding our ability to measure individual NMDAR events during depolarization. In contrast, the ratio of green to red fluorescence at −70 mV was unchanged by exposure to 100 μM DL-TBOA (Figures 3D and E). This suggests that the concentration of glue in 100 μM DL-TBOA was well below 0.5 μM, consistent with our whole-cell current measurements, but inconsistent with the compartmentalization hypothesis.
It is important to note that incomplete block of EAATs could result in an underestimate of [glue]. To test whether synaptic NMDARs could still be protected from extrasynaptic glutamate by residual transporter activity, we recorded MSN current responses to glutamate with and without DL-TBOA. With glutamate transport intact, exogenous glutamate is readily taken up before it can diffuse into the slice (Gueler et al., 2007). Accordingly, application of 1–3 μM glutamate did not lead to a measurable NMDAR current (n = 5; data not shown). In the presence of 100 μM DL-TBOA, however, 1 μM glutamate increased the NMDAR-mediated current (Figure 3F), showing that 100 μM DL-TBOA is sufficient to allow glutamate to diffuse to synaptic NMDARs.
MSNs depolarize and spike in the presence of 20 μM NMDA but not 100 μM DL-TBOA
In the preceding experiments we used MSN NMDARs as high-affinity glutamate sensors to estimate [glue]. We next addressed the possible function of non-synaptic glutamate by asking how cells respond to the equivalent of 0.5 μM glutamate in more physiological conditions, namely without clamping membrane potential or inhibiting synaptic transmission.
We omitted antagonists and exogenous D-serine from the bath solution. In whole-cell current clamp recordings from MSNs, superfusion of the slice with 20 μM NMDA (equipotent to ~0.5 μM glutamate) caused six out of six cells to spike. When NMDA application lasted longer than two minutes, cells entered a quiescent, depolarized state, as seen in the example in Figure 4. This demonstrates that a less-than half maximal concentration of agonist is sufficient to indiscriminately depolarize cells in the preparation and cause bursting, eventually resulting in voltage-dependent channel inactivation; a scenario which is not compatible with normal function. If micromolar glutamate is present in the slice but compartmentalized, inhibiting glutamate uptake should replicate the effect of 20 μM NMDA. In 100 μM DL-TBOA, however, we observed only modest depolarizations (peak: 4.5 ± 1.0 mV, n = 6), suggesting that [glue] is well below an EC50 concentration for NMDARs throughout the neuropil.
Figure 4. MSNs depolarize in the equivalent of 0.5 μM glutamate.
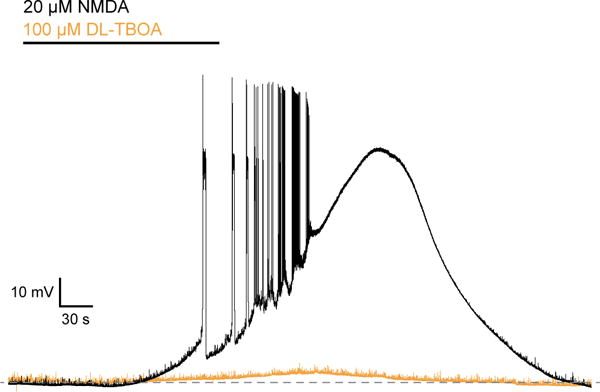
Voltage traces from MSN recorded in the absence of TTX, picrotoxin, NBQX, and d-serine. Application of 20 μM NMDA, equipotent to 0.5 μM glutamate, led to firing and sustained depolarization. In the same cell, application of 100 μM DL-TBOA resulted in a peak depolarization of 7 mV.
Discussion
We have shown that measurements of NMDAR activation by glue at single spines are consistent with estimates made from macroscopic NMDAR-mediated currents. Moreover, our data indicate that the nanomolar concentration reported by NMDARs is not the result of compartmentalization, but instead accurately reflects the steady-state concentration throughout the extracellular space.
Whole-cell current and frequency of NMDAR openings correspond to nanomolar extracellular glutamate
Our estimate of 25 nM matches the estimate obtained using the same technique in hippocampal CA1 neuropil (Herman and Jahr, 2007), and is close to the steady-state lower limit of 2 nM predicted by the stoichiometry of glutamate transport and demonstrated in heterologous expression systems (Tzingounis and Wadiche, 2007; Zerangue and Kavanaugh, 1996). However, we sought to determine whether it reflects only the average concentration at synaptic receptors, and is thus an underestimate due to sampling bias.
Using 2PLSM we saw that Ca2+ transients resulting from activation of MSN spine NMDARs by glue were extremely rare, occurring in only 78 of >10,500 imaging trials. Intuitively, this seems consistent with our estimate, as the D-AP5-sensitive standing current was equivalent to 0.4% of Imax, glu, and each spine contains only a small fraction of the total receptors on the cell. To roughly estimate the likelihood of observing an event (Pevent) during one of our trials, we treated the fraction of Imax, glu as a probability of opening, Po. For n channels, the probability of at least one receptor opening is the same as the complement of the probability that all receptors fail to open (1−Po)n, or Pevent = 1−(1−Po)n. Although we do not know how many NMDARs are present on each MSN spine, studies from CA1 pyramidal neurons suggest between 1 and 10 functional NMDARs at the synapse (Chen et al., 2015; Nimchinsky et al., 2004; Spruston et al., 1995). Thus the likelihood of observing an event, given a steady-state concentration of 25 nM glutamate, is estimated to be between 0.004 and 0.041 (for n = 1 or n = 10, respectively). The number of observed NMDAR-mediated transients was 0.007 of trials, well within the predicted range. By contrast, the likelihood of observing an event in the presence of 1 μM glutamate even if only a single NMDAR is present is 0.318, which is substantially higher than what we observed in over 10,000 trials in control conditions and 1,700 trials in the presence of 100 μM DL-TBOA.
Two factors that this back-of-the-envelope calculation does not account for are the inclusion of events that occur following the spontaneous fusion of a vesicle of glutamate, and the exclusion of events that fall below our detection threshold. In the first case, NMDAR activation following unevoked vesicular release, such as that which would give rise to a mini EPSC (mEPSC), would result in an overestimate of [glue]. In the absence of AMPAR blockers, we observe a mEPSC rate of ~1 Hz when recording from MSNs. For an MSN with 1,000 synapses, the mEPSC rate at an individual spine would be 0.001 Hz, assuming mEPSCs occur with equal probability at each synapse. If mEPSCs are more likely to happen at some synapses than others, this would indeed increase the chance of observing Ca2+ transients at those synapses, but at the same time it would increase the number of synapses at which the observable frequency is even lower. While we cannot distinguish between such transients and those that arise from non-vesicular glutamate, we suggest that these are unlikely to inflate overall counts.
Conversely, the duration of NMDAR channel activation is variable, and very brief channel openings will go undetected, resulting in an underestimate of the frequency of NMDAR activation by glue. However, there is no evidence to suggest that such undetected openings should represent a disproportionate number of cases in which an NMDAR is activated. Thus, although we cannot derive [glue] from the frequency of NMDAR-mediated Ca2+ transients, we argue that the very low frequency of events can be interpreted as evidence of low glue in the synaptic cleft.
Lack of evidence for compartmentalization of extracellular glutamate
Measurements of micromolar glue made by in vivo microdialysis have been explained by invoking a model wherein glue is compartmentalized by EAATs (Kalivas, 2009; Moussawi et al., 2011a). To test this model experimentally, we monitored NMDAR activation while pharmacologically blocking glutamate uptake. Wash-in of DL-TBOA increased NMDAR-mediated current, which would be consistent with the movement of glutamate down a concentration gradient, but also with an overall elevation of glue as a result of tonic efflux. To distinguish between these two effects, we used 2PLSM. Glutamate from a 1 μM source should diffuse rapidly into the cleft, increasing the concentration. However, Ca2+ transients in 100 μM DL-TBOA were still very rare (~3% of trials), consistent with the continued presence of nanomolar glutamate at the spine, and suggesting that a rise in steady-state glutamate, not the elimination of a steep glutamate gradient, is the predominant effect of EAAT inhibition under these conditions. Furthermore, while not a quantitative result, our observation that baseline Ca2+ rose in dendrites and spines during application of 20 μM NMDA (the equivalent of ~0.5 μM glutamate) but was unchanged by 100 μM DL-TBOA argues strongly against the presence of ≥1 μM glutamate in the extracellular space.
Two previous studies examined compartmentalization of glue in acute hippocampal slice. Comparing the effect of D-AP5 on average Ca2+ transients elicited by back-propagating action potentials in CA1 dendritic spines versus shafts, Herman et al. (2011) concluded there was no difference in the glutamate concentration at each structure. However, using the same approach, the Semaynov group concluded that the concentration was higher at shafts, consistent with compartmentalization (Wu et al., 2012). The paucity of Ca2+ transients arising from the binding of NMDARs by steady-state glue may explain the lack of agreement between the two earlier studies. As we have shown, such transients are extremely rare, making the average transient an insensitive measure of NMDAR activation.
To address compartmentalization more directly would require ultrastructural analysis; compartmentalization of the extracellular space into synaptic and extrasynaptic domains with a glutamate concentration gradient on the order of 100-fold would necessitate a complete ensheathment of the synaptic perimeter in transporter-rich (presumably glial) membrane (Danbolt, 2001). Three-dimensional electron micrograph reconstructions of NAc have not been published, but would provide compelling evidence for or against the existence of compartmentalization, as they have in the case of cerebellar cortex (Palay and Chan-Palay, 1974; Xu-Friedman et al., 2001) and hippocampus (Ventura and Harris, 1999; Witcher et al., 2007), respectively.
Given the lack of functional and anatomical evidence for compartmentalization, there remains the question of why in vivo microdialysis estimates exceed our own by 100-fold or more. Sun and colleagues modeled the effect of a gap in astrocyte coverage on steady-state [glue] (Sun et al., 2014), as would occur with the presence of a microdialysis probe (Clapp-Lilly et al., 1999; Zhou et al., 2001). Assuming a Gaussian-shaped region of impaired uptake due to damage from probe insertion, they showed that the concentration of glutamate inside the probe was 2–3 orders of magnitude higher than in intact neuropil (as close as 300 to 900 μm from the edge of the probe), and that this ratio was largely independent of parameters such as EAAT expression density, the rate of glutamate efflux, and the glutamate diffusion coefficient. Microdialysis studies could thus be reporting micromolar glue because they are sampling from a volume in which uptake is severely reduced.
Extracellular glutamate is universally nanomolar at steady-state
Our finding that nanomolar glutamate is not restricted to a synaptic compartment of the extracellular space is consistent not only with previous estimates from acute slice (Cavelier and Attwell, 2005; Herman and Jahr, 2007), but also with the function and distribution of EAATs, activation and inactivation curves for glutamate receptors, and the anatomy of the neuropil. Although less is known about the source of and parameters governing non-vesicular glutamate efflux, we propose that the uptake capacity of EAATs paired with their high expression (Danbolt, 2001; Furuta et al., 1997) gives rise to comparable concentrations throughout the brain.
At 25 nM, we suggest that [glue] is too low to tonically activate glutamate receptors, but rather that in the absence of stimulation the majority of glutamate receptors in the brain are unbound and available for activation (Patneau and Mayer, 1990; Zorumski et al., 1996). This is a useful and important basic parameter for studying glutamate receptor function in synaptic transmission and plasticity, as well as understanding the consequences of perturbations of glutamatergic signaling.
Experimental Procedures
Slice preparation
Coronal slices (300 μm) of the NAc were prepared from Sprague Dawley rats (Charles River, MA) of either sex (P15–22 unless otherwise noted) according to protocols approved by the Oregon Health & Science University Institutional Animal Care and Use Committee. Animals were deeply anesthetized with isoflurane and decapitated. Brains were quickly removed and placed in ice-cold solution containing the following (in mM): 110 choline chloride, 7 MgCl2, 2.5 KCl, 1.25 KH2PO4, 0.5 CaCl2, 25 NaHCO3, 10 glucose, 3 Na-pyruvate, and 11 Na-ascorbate (saturated with 95% O2/5% CO2). Slices were cut using a VibroSlicer (Leica VT1200S, Leica Instruments, Nussloch, Germany) and transferred to a recovery chamber containing artificial cerebrospinal fluid (ACSF) composed of (in mM): 119 NaCl, 2.5 KCl, 2.0 CaCl2, 1.0 MgCl2, 1.0 NaH2PO4, 26.2 NaHCO3, 11 glucose, 3 Na-pyruvate, and 1.3 Na-ascorbate (saturated with 95% O2/5% CO2). Slices were kept at 36°C for 30 minutes, then at room temperature for ≥ 1 hour before use.
Electrophysiology
MSNs in the NAc were visually identified with differential interference contrast optics (Zeiss, Thornwood, NY). Cell bodies ventromedial to and within ~150 μm of the anterior commissure were targeted for recordings. Slices were superfused with ACSF with 0.5 μM tetrodotoxin (TTX), 10 μM 2,3-dioxo-6-nitro-1,2,3,4-tetrahydrobenzo[f]quinoxaline-7-sulfonamide (NBQX), 10–20 μM D-serine, and 50 μM picrotoxin. VSCCs were blocked with 20 μM mibefradil and 20 μM nimodipine (imaging experiments) or 100 μM CdCl2 (Figures 1, 3A and 3C). Drugs were applied using a four-way manifold connected to a single-barrel flow pipe (545 μm inner diameter) positioned ~700 μm upstream from the cell soma (Herman and Jahr, 2007). All experiments were done at 32°C.
Borosilicate glass patch pipettes (World Precision Instruments, Sarasota, FL; 3.5–5 MΩ open tip resistance) were filled with internal solution containing (in mM): 135 CsMeSO3, 10 HEPES, 8 NaCl, 4 Mg-ATP, and 0.4 Na-GTP, or 100 Cs-gluconate, 22 CsCl, 10 Na-phosphocreatine, 10 HEPES, 4.8 NaCl, 1.6 MgCl2, 4 Na-ATP, and 0.4 Na-GTP. For imaging experiments, 0.24 Fluo-5F and 0.01 Alexa 594 hydrazide were included. For current clamp experiments (Figure 4), internal solution contained (in mM): 128 K-gluconate, 10 HEPES, 14 Na-phosphocreatine, 10 NaCl, 4 MgCl2, 0.5 EGTA, 4 Mg-ATP, and 0.4 Na-GTP.
Whole-cell recordings were obtained using an Axon Multiclamp 700B amplifier (Molecular Devices, Sunnyvale, CA) and ScanImage software (Pologruto et al., 2003) written in MATLAB (MathWorks, Natick, MA). Physiological data were acquired at 5 kHz and filtered at 2 kHz.
Two-photon laser scanning microscopy
Ca2+ measurements were performed on a custom-built 2PLSM using an Olympus (Melville, NY) upright microscope and objective (60×, 1.0 NA) and a Chameleon Ti:Sapphire laser (Coherent, Santa Clara, CA) tuned to 840 nm. Green and red fluorescence was collected by photomultipliers (H8224P-40 or H10770PA-40, Hamamatsu Photonics, Hamamatsu, Japan) in epi- and transfluorescence pathways using a 565 dichroic mirror and 525/50 and 620/60 band-pass filters (Chroma Technology, Brattleboro, VT). Image acquisition occurred no sooner than 20 minutes after attaining the whole-cell configuration to allow for equilibration of dye. All regions of interest (ROIs) were proximal to the cell soma (≤ 100 μm) and between 25 and 60 μm below the surface of the slice.
Variance analysis
With VSCCs and Ca2+-permeable AMPARs blocked, the variance σ2 of the Fluo-5F signal is the sum of three components (Sabatini and Svoboda, 2000):
Dark noise was measured by analyzing pixels from the first 40 ms of acquisitions, when the laser was shuttered. The mean dark pixel value was multiplied by the number of pixels in each ROI and subtracted from the fluorescence signal to get raw Fluo-5F fluorescence, which was used for subsequent analysis.
Shot noise was calibrated at the end of each recording by acquiring 50–100 images of the patch pipette at varying laser intensities. Because the Ca2+ concentration in a small volume of the barrel of the pipette is assumed to be stable, trial-to-trial fluctuations in fluorescence at a given laser intensity are due to shot noise and dark noise alone. The mean and the variance of all pixel values at each intensity were plotted to construct the shot noise calibration curve. The slope of the curve, α, was used to determine the predicted variance.
Statistical analysis
Data were analyzed using IGOR (Wavemetrics, Lake Oswego, OR) and Excel (Microsoft, Seattle, WA) and are expressed as mean ± SEM. Significance was determined using two-tailed Wilcoxon matched pairs signed-ranks test or Mann-Whitney U test, p < 0.05.
Highlights.
The average extracellular glutamate concentration at NMDARs in the NAc is 25 nM
The concentration at spines is nanomolar even when glutamate uptake is blocked
Extracellular glutamate is not compartmentalized by glutamate transporters
Acknowledgments
We thank Brett C. Carter and Weinan Sun for discussions and comments on the manuscript. This work was supported by the US National Institutes of Health grant NS066037 (C.E.J.).
Footnotes
Publisher's Disclaimer: This is a PDF file of an unedited manuscript that has been accepted for publication. As a service to our customers we are providing this early version of the manuscript. The manuscript will undergo copyediting, typesetting, and review of the resulting proof before it is published in its final citable form. Please note that during the production process errors may be discovered which could affect the content, and all legal disclaimers that apply to the journal pertain.
Author Contributions
D.N.C. and C.E.J. conceived the experiments. Experiments were performed and analyzed by D.N.C.. D.N.C. and C.E.J. wrote the manuscript.
References
- Baker DA, Xi ZX, Shen H, Swanson CJ, Kalivas PW. The Origin and Neuronal Function of In Vivo Nonsynaptic Glutamate. J Neurosci. 2002;22:9134–9141. doi: 10.1523/JNEUROSCI.22-20-09134.2002. [DOI] [PMC free article] [PubMed] [Google Scholar]
- Baker DA, McFarland K, Lake RW, Shen H, Tang XC, Toda S, Kalivas PW. Neuroadaptations in cystine-glutamate exchange underlie cocaine relapse. Nat Neurosci. 2003;6:743–749. doi: 10.1038/nn1069. [DOI] [PubMed] [Google Scholar]
- Bergles DE, Tzingounis AV, Jahr CE. Comparison of coupled and uncoupled currents during glutamate uptake by GLT-1 transporters. J Neurosci. 2002;22:10153–10162. doi: 10.1523/JNEUROSCI.22-23-10153.2002. [DOI] [PMC free article] [PubMed] [Google Scholar]
- Botelho EP, Wang E, Chen JY, Holley S, André VM, Cepeda C, Levine MS. Differential Synaptic and Extrasynaptic Glutamate-Receptor Alterations in Striatal Medium-Sized Spiny Neurons of Aged YAC128 Huntington’s Disease Mice. PLoS Curr. 2014;6 doi: 10.1371/currents.hd.34957c4f8bd7cb1f5ec47381dfc811c3. [DOI] [PMC free article] [PubMed] [Google Scholar]
- De Bundel D, Schallier A, Loyens E, Fernando R, Miyashita H, Van Liefferinge J, Vermoesen K, Bannai S, Sato H, Michotte Y, et al. Loss of system x(c)- does not induce oxidative stress but decreases extracellular glutamate in hippocampus and influences spatial working memory and limbic seizure susceptibility. J Neurosci. 2011;31:5792–5803. doi: 10.1523/JNEUROSCI.5465-10.2011. [DOI] [PMC free article] [PubMed] [Google Scholar]
- Carter AG, Sabatini BL. State-dependent calcium signaling in dendritic spines of striatal medium spiny neurons. Neuron. 2004;44:483–493. doi: 10.1016/j.neuron.2004.10.013. [DOI] [PubMed] [Google Scholar]
- Cavelier P, Attwell D. Tonic release of glutamate by a DIDS-sensitive mechanism in rat hippocampal slices. J Physiol. 2005;564:397–410. doi: 10.1113/jphysiol.2004.082131. [DOI] [PMC free article] [PubMed] [Google Scholar]
- Chen X, Levy JM, Hou A, Winters C, Azzam R, Sousa AA, Leapman RD, Nicoll RA, Reese TS. PSD-95 family MAGUKs are essential for anchoring AMPA and NMDA receptor complexes at the postsynaptic density. Proc Natl Acad Sci U S A. 2015;112:E6983–92. doi: 10.1073/pnas.1517045112. [DOI] [PMC free article] [PubMed] [Google Scholar]
- Clapp-Lilly KL, Roberts RC, Duffy LK, Irons KP, Hu Y, Drew KL. An ultrastructural analysis of tissue surrounding a microdialysis probe. J Neurosci Methods. 1999;90:129–142. doi: 10.1016/s0165-0270(99)00064-3. [DOI] [PubMed] [Google Scholar]
- Colquhoun D, Jonas P, Sakmann B. Action of brief pulses of glutamate on AMPA/kainate receptors in patches from different neurones of rat hippocampal slices. J Physiol. 1992;458:261–287. doi: 10.1113/jphysiol.1992.sp019417. [DOI] [PMC free article] [PubMed] [Google Scholar]
- Danbolt NC. Glutamate uptake. Prog Neurobiol. 2001;65:1–105. doi: 10.1016/s0301-0082(00)00067-8. [DOI] [PubMed] [Google Scholar]
- Dash MB, Douglas CL, Vyazovskiy VV, Cirelli C, Tononi G. Long-term homeostasis of extracellular glutamate in the rat cerebral cortex across sleep and waking states. J Neurosci. 2009;29:620–629. doi: 10.1523/JNEUROSCI.5486-08.2009. [DOI] [PMC free article] [PubMed] [Google Scholar]
- Diamond JS. Neuronal glutamate transporters limit activation of NMDA receptors by neurotransmitter spillover on CA1 pyramidal cells. J Neurosci. 2001;21:8328–8338. doi: 10.1523/JNEUROSCI.21-21-08328.2001. [DOI] [PMC free article] [PubMed] [Google Scholar]
- Furuta A, Rothstein JD, Martin LJ. Glutamate Transporter Protein Subtypes Are Expressed Differentially during Rat CNS Development. J Neurosci. 1997;17:8363–8375. doi: 10.1523/JNEUROSCI.17-21-08363.1997. [DOI] [PMC free article] [PubMed] [Google Scholar]
- Gueler N, Kukley M, Dietrich D. TBOA-sensitive uptake limits glutamate penetration into brain slices to a few micrometers. Neurosci Lett. 2007;419:269–272. doi: 10.1016/j.neulet.2007.04.035. [DOI] [PubMed] [Google Scholar]
- Hansen KB, Ogden KK, Yuan H, Traynelis SF. Distinct Functional and Pharmacological Properties of Triheteromeric GluN1/GluN2A/GluN2B NMDA Receptors. Neuron. 2014;81:1084–1096. doi: 10.1016/j.neuron.2014.01.035. [DOI] [PMC free article] [PubMed] [Google Scholar]
- Herman MA, Jahr CE. Extracellular glutamate concentration in hippocampal slice. J Neurosci. 2007;27:9736–9741. doi: 10.1523/JNEUROSCI.3009-07.2007. [DOI] [PMC free article] [PubMed] [Google Scholar]
- Herman MA, Nahir B, Jahr CE. Distribution of extracellular glutamate in the neuropil of hippocampus. PLoS One. 2011;6:e26501. doi: 10.1371/journal.pone.0026501. [DOI] [PMC free article] [PubMed] [Google Scholar]
- Jabaudon D, Shimamoto K, Yasuda-Kamatani Y, Scanziani M, Gähwiler BH, Gerber U. Inhibition of uptake unmasks rapid extracellular turnover of glutamate of nonvesicular origin. Proc Natl Acad Sci U S A. 1999;96:8733–8738. doi: 10.1073/pnas.96.15.8733. [DOI] [PMC free article] [PubMed] [Google Scholar]
- Javitt DC, Schoepp DD, Kalivas PW, Volkow ND, Zarate C, Merchant K, Bear MF, Umbricht D, Hajos M, Potter WZ, et al. Translating Glutamate: From Pathophysiology to Treatment. Sci Transl Med. 2011;3:102mr2–102mr2. doi: 10.1126/scitranslmed.3002804. [DOI] [PMC free article] [PubMed] [Google Scholar]
- Kalivas PW. The glutamate homeostasis hypothesis of addiction. Nat Rev Neurosci. 2009;10:561–572. doi: 10.1038/nrn2515. [DOI] [PubMed] [Google Scholar]
- LaLumiere RT, Kalivas PW. Glutamate release in the nucleus accumbens core is necessary for heroin seeking. J Neurosci. 2008;28:3170–3177. doi: 10.1523/JNEUROSCI.5129-07.2008. [DOI] [PMC free article] [PubMed] [Google Scholar]
- Mainen ZF, Malinow R, Svoboda K. Synaptic calcium transients in single spines indicate that NMDA receptors are not saturated. Nature. 1999;399:151–155. doi: 10.1038/20187. [DOI] [PubMed] [Google Scholar]
- Le Meur K, Galante M, Angulo MC, Audinat E. Tonic activation of NMDA receptors by ambient glutamate of non-synaptic origin in the rat hippocampus. J Physiol. 2007;580:373–383. doi: 10.1113/jphysiol.2006.123570. [DOI] [PMC free article] [PubMed] [Google Scholar]
- Miguéns M, Del Olmo N, Higuera-Matas A, Torres I, García-Lecumberri C, Ambrosio E. Glutamate and aspartate levels in the nucleus accumbens during cocaine self-administration and extinction: a time course microdialysis study. Psychopharmacology (Berl) 2008;196:303–313. doi: 10.1007/s00213-007-0958-x. [DOI] [PubMed] [Google Scholar]
- Moussawi K, Riegel A, Nair S, Kalivas PW. Extracellular glutamate: functional compartments operate in different concentration ranges. Front Syst Neurosci. 2011a;5:94. doi: 10.3389/fnsys.2011.00094. [DOI] [PMC free article] [PubMed] [Google Scholar]
- Moussawi K, Zhou W, Shen H, Reichel CM, See RE, Carr DB, Kalivas PW. Reversing cocaine-induced synaptic potentiation provides enduring protection from relapse. Proc Natl Acad Sci U S A. 2011b;108:385–390. doi: 10.1073/pnas.1011265108. [DOI] [PMC free article] [PubMed] [Google Scholar]
- Nimchinsky EA, Yasuda R, Oertner TG, Svoboda K. The number of glutamate receptors opened by synaptic stimulation in single hippocampal spines. J Neurosci. 2004;24:2054–2064. doi: 10.1523/JNEUROSCI.5066-03.2004. [DOI] [PMC free article] [PubMed] [Google Scholar]
- Ortinski PI, Turner JR, Pierce RC. Extrasynaptic targeting of NMDA receptors following D1 dopamine receptor activation and cocaine self-administration. J Neurosci. 2013;33:9451–9461. doi: 10.1523/JNEUROSCI.5730-12.2013. [DOI] [PMC free article] [PubMed] [Google Scholar]
- Palay SL, Chan-Palay V. Cerebellar cortex: cytology and organization (Springer-Verlag Berlin Heidelberg) 1974. [Google Scholar]
- Patneau DK, Mayer ML. Structure-activity relationships for amino acid transmitter candidates acting at N-methyl-D-aspartate and quisqualate receptors. J Neurosci. 1990;10:2385–2399. doi: 10.1523/JNEUROSCI.10-07-02385.1990. [DOI] [PMC free article] [PubMed] [Google Scholar]
- Pologruto TA, Sabatini BL, Svoboda K. ScanImage: flexible software for operating laser scanning microscopes. Biomed Eng Online. 2003;2:13. doi: 10.1186/1475-925X-2-13. [DOI] [PMC free article] [PubMed] [Google Scholar]
- Sabatini BL, Svoboda K. Analysis of calcium channels in single spines using optical fluctuation analysis. Nature. 2000;408:589–593. doi: 10.1038/35046076. [DOI] [PubMed] [Google Scholar]
- Schoepp DD, Jane DE, Monn JA. Pharmacological agents acting at subtypes of metabotropic glutamate receptors. Neuropharmacology. 1999;38:1431–1476. doi: 10.1016/s0028-3908(99)00092-1. [DOI] [PubMed] [Google Scholar]
- Shen H, Scofield MD, Boger HA, Hensley M, Kalivas PW. Synaptic glutamate spillover due to impaired glutamate uptake mediates heroin relapse. J Neurosci. 2014;34:5649–5657. doi: 10.1523/JNEUROSCI.4564-13.2014. [DOI] [PMC free article] [PubMed] [Google Scholar]
- Shimamoto K, Lebrun B, Yasuda-Kamatani Y, Sakaitani M, Shigeri Y, Yumoto N, Nakajima T. DL-threo-beta-Benzyloxyaspartate, A Potent Blocker of Excitatory Amino Acid Transporters. Mol Pharmacol. 1998;53:195–201. doi: 10.1124/mol.53.2.195. [DOI] [PubMed] [Google Scholar]
- Silver RA, Colquhoun D, Cull-Candy SG, Edmonds B. Deactivation and desensitization of non-NMDA receptors in patches and the time course of EPSCs in rat cerebellar granule cells. J Physiol. 1996;493:167–173. doi: 10.1113/jphysiol.1996.sp021372. [DOI] [PMC free article] [PubMed] [Google Scholar]
- Spruston N, Jonas P, Sakmann B. Dendritic glutamate receptor channels in rat hippocampal CA3 and CA1 pyramidal neurons. J Physiol. 1995;482:325–352. doi: 10.1113/jphysiol.1995.sp020521. [DOI] [PMC free article] [PubMed] [Google Scholar]
- Sun W, Shchepakin D, Kalachev LV, Kavanaugh MP. Glutamate transporter control of ambient glutamate levels. Neurochem Int. 2014;73:146–151. doi: 10.1016/j.neuint.2014.04.007. [DOI] [PubMed] [Google Scholar]
- Trussell LO, Fischbach GD. Glutamate receptor desensitization and its role in synaptic transmission. Neuron. 1989;3:209–218. doi: 10.1016/0896-6273(89)90034-2. [DOI] [PubMed] [Google Scholar]
- Tzingounis AV, Wadiche JI. Glutamate transporters: confining runaway excitation by shaping synaptic transmission. Nat Rev Neurosci. 2007;8:935–947. doi: 10.1038/nrn2274. [DOI] [PubMed] [Google Scholar]
- Ventura R, Harris KM. Three-dimensional relationships between hippocampal synapses and astrocytes. J Neurosci. 1999;19:6897–6906. doi: 10.1523/JNEUROSCI.19-16-06897.1999. [DOI] [PMC free article] [PubMed] [Google Scholar]
- Witcher MR, Kirov SA, Harris KM. Plasticity of perisynaptic astroglia during synaptogenesis in the mature rat hippocampus. Glia. 2007;55:13–23. doi: 10.1002/glia.20415. [DOI] [PubMed] [Google Scholar]
- Wu YW, Grebenyuk S, McHugh TJ, Rusakov DA, Semyanov A. Backpropagating Action Potentials Enable Detection of Extrasynaptic Glutamate by NMDA Receptors. Cell Rep. 2012;1:495–505. doi: 10.1016/j.celrep.2012.03.007. [DOI] [PMC free article] [PubMed] [Google Scholar]
- Xu-Friedman MA, Harris KM, Regehr WG. Three-Dimensional Comparison of Ultrastructural Characteristics at Depressing and Facilitating Synapses onto Cerebellar Purkinje Cells. J Neurosci. 2001;21:6666–6672. doi: 10.1523/JNEUROSCI.21-17-06666.2001. [DOI] [PMC free article] [PubMed] [Google Scholar]
- Zerangue N, Kavanaugh MP. Flux coupling in a neuronal glutamate transporter. Nature. 1996;383:634–637. doi: 10.1038/383634a0. [DOI] [PubMed] [Google Scholar]
- Zhou F, Zhu X, Castellani RJ, Stimmelmayr R, Perry G, Smith MA, Drew KL. Hibernation, a model of neuroprotection. Am J Pathol. 2001;158:2145–2151. doi: 10.1016/S0002-9440(10)64686-X. [DOI] [PMC free article] [PubMed] [Google Scholar]
- Zorumski CF, Mennerick S, Que J. Modulation of excitatory synaptic transmission by low concentrations of glutamate in cultured rat hippocampal neurons. J Physiol. 1996;494:465–477. doi: 10.1113/jphysiol.1996.sp021506. [DOI] [PMC free article] [PubMed] [Google Scholar]