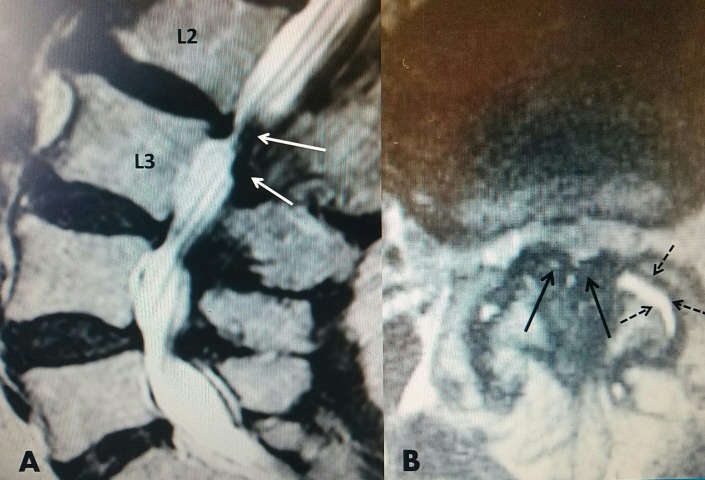
Figure 5. MRI showing multilevel stenosis with L2-3 ligamentous stenosis.
A: T2 sagittal MRI shows severe posterior L 2-3 ligamentous compression (white solid arrows) with a ventral L 2-3 disc. There is associated lesser degree of stenosis at L 3-4 and L 4-5.
B: T2 axial MRI shows marked ligamentum flavum hypertrophy (black solid arrows) and marked fluid in the left facet joint (dashed arrows).
MRI: Magnetic resonance imaging.

