

End‐of‐life care expenditures for cancer decedents are explored in this population‐based study. The accelerating costs of end‐of‐life cancer care are a quality concern not only for the unsustainability of health care systems but also for the negative impact of aggressive end‐of‐life care on terminally ill cancer patients and their family caregivers.
Keywords: Health care expenditures, End‐of‐life care, Population‐based study, Administrative data analysis, Cancer patients
Abstract
Background.
No population‐based longitudinal studies on end‐of‐life (EOL) expenditures were found for cancer decedents.
Methods.
This population‐based, retrospective cohort study examined health care expenditures from 2001 to 2010 among 339,546 Taiwanese cancer decedents' last year of life. Individual patient‐level data were linked from administrative datasets. Health care expenditures were converted from Taiwan dollars to U.S. dollars by health‐specific purchasing power parity conversions to account for different health‐purchasing powers. Associations of patient, physician, hospital, and regional factors with EOL care expenditures were evaluated by multilevel linear regression model by generalized estimating equation method.
Results.
Mean annual EOL care expenditures for Taiwanese cancer decedents increased from 2000 to 2010 from U.S. $49,591 to U.S. $68,773, respectively, with one third of spending occurring in the patients' last month. Increased EOL care expenditures were associated with male gender, younger age, being married, diagnosed with hematological malignancies and cancers other than lung, gastric, and hepatic‐pancreatic cancers, and dying within 7–24 months of diagnosis. Patients spent less at EOL when they had higher comorbidities and metastatic disease, died within 6 months of diagnosis, were under care of oncologists, gastroenterologists, and intensivists, and received care at a teaching hospital with more terminally ill cancer patients. Higher EOL care expenditures were associated with greater EOL care intensity at the primary hospital and regional levels.
Conclusion.
Taiwanese cancer decedents consumed considerable National Health Insurance disbursements at EOL, totaling more than was consumed in six developed non‐U.S. countries surveyed in 2010. To slow increasing cost and improve EOL cancer care quality, interventions to ensure appropriate EOL care provision should target hospitals and clinicians less experienced in providing EOL care and those who tend to provide aggressive EOL care to high‐risk patients.
Implications for Practice.
Cancer‐care costs are highest during the end‐of‐life (EOL) period for cancer decedents. This population‐based study longitudinally examined EOL expenditures for cancer decedents. Mean annual EOL‐care expenditures for Taiwanese cancer decedents increased from U.S. $49,591 to U.S. $68,773 from the year 2000 to 2010, with one third of spending in patients' last month and more than for six developed non‐U.S. countries surveyed in 2010. To slow the increasing cost of EOL‐cancer care, interventions should target hospitals/clinicians less experienced in providing EOL care, who tend to provide aggressive EOL care to high‐risk patients, to avoid the physical suffering, emotional burden, and financial costs of aggressive EOL care.
摘要
背景. 尚未针对癌症死亡患者的临终(EOL)费用进行人群纵向研究。
方法. 本项回顾性人群队列研究考察了2001‐2010年间339 546例台湾癌症死亡患者在生命最后一年内的健康护理费用。个体患者水平的数据来自管理数据集。采用健康特异性购买力平价换算法将健康护理费用由台币换算为美元, 以评价健康购买力的差异。采用广义估计方程法, 通过多水平线性回归模型评价患者、医生、医院和区域因素与EOL护理费用之间的关系。
结果. 从2000年到2010年期间, 台湾癌症死亡患者的年均EOL护理费用由49 591美元增加至68 773美元, 其中三分之一的花费来源于患者生命的最后一个月。EOL护理费用增加与以下因素有关:男性, 低龄, 已婚, 诊断为肺癌、胃癌和肝脏‐胰腺癌以外的其他恶性血液疾病和血液系统癌症, 在诊断后7‐24个月内死亡。以下患者的EOL花费较少:共病和转移性疾病较多, 诊断后6个月内死亡, 由肿瘤科医师、胃肠科医师和重症监护医师进行护理, 在晚期癌症患者较多的教学医院接受护理。在基层医院和区域水平接受较高强度的EOL护理时, EOL护理费用有所增加。
结论. 台湾癌症死亡患者在EOL时的全民健康保险支出相当可观, 总体费用比2010年调查的6个发达国家(不包括美国)都要高。为了遏制花费的不断上涨并提高EOL癌症护理的质量, 应针对EOL护理经验较少和倾向于对高危患者进行高强度EOL护理的医院和临床医生进行干预, 以确保提供适当的EOL护理。
对临床实践的提示:癌症死亡患者在EOL阶段的癌症护理花费最高。本项人群研究纵向考察了癌症死亡患者的EOL费用。从2000年到2010年期间, 台湾癌症死亡患者的年均EOL护理费用由49 591美元增至68 733美元, 其中三分之一的花费来源于患者生命的最后一个月, 比2010年调查的6个发达国家(不包括美国)都要高。为了遏制不断上涨的EOL癌症护理费用, 应针对EOL护理经验较少和倾向于对高危患者进行高强度EOL护理的医院/临床医生进行干预, 以避免高强度EOL护理产生的肉体痛苦、精神负担和经济费用。
Introduction
Cancer, a leading cause of morbidity and mortality worldwide [1], accounts for a substantial burden on national economies that is outstripping their growth faster than for other major causes of death [1] in terms of productivity losses due to disability and premature death as well as share of health care expenditures (France and U.K.: 3.0%, U.S.: 4.7%, Germany: 5.0%, Canada: 6.7%, and Taiwan: 9.2% in 2009–2010) [2], [3], [4]. The skyrocketing cost of cancer care continues at an unsustainable rate [1].
Costs for cancer care are highest in the initial period following diagnosis and during the end‐of‐life (EOL) period (last year of life) for cancer decedents [3], [5]. Indeed, EOL cancer care has become increasingly aggressive over the past decade [6], and cancer decedents consumed more expenditures than decedents with other diseases in the Netherlands [7], Belgium [8], Israel [9], U.S. [10], Australia [11], and Taiwan [12]. The accelerating costs of EOL cancer care become a quality concern not only for the unsustainability of health care systems [13] but also for the negative impact of aggressive EOL care on terminally ill cancer patients and their family caregivers both when their relative is still alive and during the bereavement stage [14]. Therefore, health care policy makers and health care systems worldwide have prioritized measuring health care expenditures in cancer decedents' last year (hereafter referred to as EOL care expenditures) and identifying factors driving EOL care costs to guide effective interventions for minimizing their impact [1], [15].
However, until recently, only ten studies worldwide had explored EOL care expenditures for cancer decedents [7], [8], [9], [10], [11], [16], [17], [18], [19], [20]. A 2016 study compared hospital expenditures using only single‐year data from six non‐U.S. developed countries for patients of all ages dying with cancer in their last 6 months of life [20]. Among these ten studies that explored EOL care expenditures for cancer decedents [7], [8], [9], [10], [11], [16], [17], [18], [19], [20], population‐based data for all age, disease, and geographical groups could only be found for Korea [19], Belgium [20], England [20], and Norway [20], but these were based on single‐year data. Therefore, the purposes of this population‐based study were to investigate health care expenditures and their determinants for cancer decedents in their last year of life over a decade (2001–2010). The population included all ages and disease groups of cancer patients who died and received health care across all health care systems in Taiwan.
Methods
Study Design and Sample
For this retrospective cohort study, individual patient‐level data were linked with scrambled personal identification numbers from computerized administrative data, that is, the National Register of Deaths Database (NRDD), Cancer Registration System (CRS) database, National Health Insurance Research (NHIR) datasets, Database of Medical Care Institutions Status, and national census statistics (county‐/city‐level population and household income). These databases were monitored for completeness and accuracy by Taiwan's Ministry of Health and Welfare, Ministry of the Interior, and Directorate‐General of Budget, Accounting, and Statistics. All deaths are required to be registered in Taiwan. Cause‐of‐death information from the NRDD is highly accurate for malignant neoplasms (kappa = 0.94 with medical record reviews) [21]. The Taiwan Cancer Registry, a population‐based cancer registry founded in 1979, included 97.34% of incident cancer cases in 2010, with 97.00% completeness and 91.11% accuracy [22].
Taiwan's National Health Insurance (NHI) is characterized by government‐run universal coverage, comprehensive health services, and a single‐payer system with a uniform, regulated fee schedule. Health care systems are reimbursed for services provided, and co‐payment is waived for patients with recognized major diseases, including malignancy. By 2010, 99.6% of Taiwan's 23 million residents were enrolled in the NHI program [23]. Extensive and systematic quality assurance processes, including routine crosschecking of chart reviews by clinical specialists, are in place to ensure accuracy in diagnostic coding, comorbidity, and health care resource utilization of the NHI claims datasets. NHIR databases have been validated [24], [25] and used for epidemiologic and health care research, and information on diagnoses, health care resource utilization, and EOL care is of high quality [24], [25], [26], [27].
The NRDD identified 374,240 cancer deaths from 2001 to 2010. However, 34,694 decedents were deleted from our analyses primarily due to lack of data on marital status, characteristics of decedents' primary hospital, and date of cancer diagnosis resulting from the time lag in cancer registration (Fig. 1). Characteristics of the remaining 339,546 cancer decedents and their primary hospitals and regions are shown in supplemental online Tables 1 and 2. This study was approved by the Institutional Review Board of the principal investigator's affiliated hospital and deemed exempt from requiring written informed consent. This study followed the STROBE guidelines.
Figure 1.
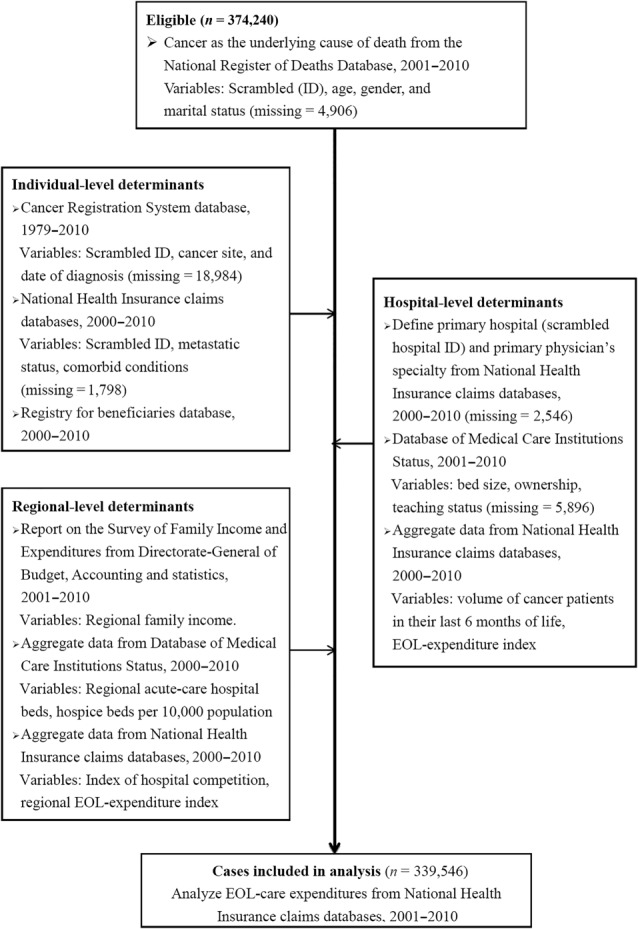
Cases and variables identified and deleted in each dataset.
Abbreviations: EOL, end‐of‐life; ID, identification.
Table 1. EOL care expenditures for Taiwanese cancer decedents, 2001–2010 (U.S. dollars, converted to health‐specific purchasing power parity in 2011 [29]).

Downloaded and calculated from http://www.mohw.gov.tw/cht/DOS/Statistic.aspx?f_list_no=312&fod_list_no=1604 (National Health Insurance statistics, in Chinese, Accessed July 8, 2016).
Downloaded and calculated from http://www.ris.gov.tw/zh_TW/346 (in Chinese, Accessed July 8, 2016).
Abbreviations: EOL, end‐of‐life.
Table 2. Determinants of health care expenditures in Taiwanese cancer decedents' last year of life (U.S. dollars, converted to health‐specific purchasing power parity in 2011 [29]).

Abbreviations: CI, confidence interval; EOL, end‐of‐life; Q, quartile; Ref, reference.
Measures
The outcome variable, EOL care expenditures, was hypothesized to be influenced by four groups of determinants: (a) patient demographics and disease characteristics, (b) primary physician's specialty, (c) characteristics, health care resources, and EOL care practice patterns at the primary hospital level, and (d) health care resources, market characteristics, and EOL care practice patterns in the region where decedents' primary hospital was located. Our hypothesis was guided by a conceptual framework for determining treatment intensity for seriously ill patients [28]. A year‐indicator variable was also included to examine Taiwan's national trends in EOL care expenditures.
Outcome Variable.
The primary outcome was EOL care expenditures at the individual decedent's level. The observation period for each decedent was the 12 months before death, regardless of diagnosis date. All spending estimates are from the perspective of the NHI program across all care settings (inpatient, outpatient, emergency department [ED], and home health) and are based on NHI reimbursement variables in claims datasets adjusted for inflation with the Consumer Price Index (base period 2010 = 100%). For comparative purposes, all health care expenditures were converted from New Taiwan dollars (NTD) to 2011 U.S. dollars (the closest year available) by the International Comparison Program [29] health‐specific purchasing power parity conversions to account for differences in health‐purchasing power of national currencies (1 U.S. dollar = 7.608 NTD) [29].
Independent Variables.
Patient Demographics.
Differences in EOL care expenditures were examined across gender and four age categories (<65, 65–74, 75–84, ≥85 years). Marital status at death was categorized as married, single, divorced/separated, and widowed.
Patient Disease Characteristics.
Patient disease characteristics included comorbidities, cancer diagnosis, and post‐diagnosis survival time. Comorbidities were identified from the International Classification of Diseases ninth revision (ICD‐9) codes for primary and secondary diagnoses, excluding cancer‐related codes, in NHI claims for both inpatients and outpatients during the last year of life. These ICD‐9 codes were used to calculate the Deyo–Charlson comorbidity index [30], categorized as 0, 1, 2, or ≥3 comorbid conditions. Diagnosis and date of diagnosis were identified from the CRS. Metastatic status was identified by at least one inpatient or two outpatient claims with ICD‐9 codes 196.xx–199.xx at least 30 days apart [31] during patients' last year of life or by stage IV, indicated in the CRS datasets since 2004. Post‐diagnosis survival was calculated as the interval (in days) between dates of diagnosis and death and was further categorized into 1–2, 3–6, 7–12, 13–24, and ≥25 months.
Primary Physician's Specialty.
Primary physician's specialty was retrieved from the code reported in NHI claims, as required in each claim, and was categorized into medical oncologist/hematologist and six other specialties that commonly provide care to cancer patients in Taiwan.
Primary Hospital Characteristics, Health Care Resources, and EOL Care Practice Patterns.
A primary hospital was identified as the hospital where each decedent had the most admissions during the last year of life. Characteristics and health care resources of primary hospitals included teaching status, ownership (public, nonprofit, or for‐profit), and acute‐care bed size. Number of acute‐care beds was converted into categorical indicators representing hospital quartile ranking for bed size. EOL care practice patterns were represented by case volume of terminally ill cancer patients and intensity of EOL care. Hospital case volume of terminally ill cancer patients was computed as the annual number of cancer patients admitted during their last 6 months of life [32] and categorized into quartiles. Primary hospitals' intensity of EOL care, defined as the quantity of medical care provided to cancer patients at EOL, is considered an indicator of how aggressively a hospital treats patients at EOL [33]. EOL care intensity was assessed using a Medicare‐spending measure, the End‐of‐Life Expenditure Index (EOL‐EI) [33]. EOL‐EI was calculated as age‐sex‐adjusted mean spending on inpatient, ED, and outpatient services provided in the last 6 months of life [33]. EOL care expenditures were computed for individuals and aggregated to the primary hospital. We grouped hospitals into quintiles of increasing intensity of EOL care practice.
Primary Hospital's Regional Health Care Resources, Market Characteristics, and EOL Care Practice Patterns.
Patients were assigned to a region that included the county/city where their primary hospital was located. Regional health care resources were measured by total acute‐care and hospice beds and categorized into quartiles of beds per 10,000 population. Regional market characteristics were measured by hospital competition and regional annual household income levels. Hospital competition was measured by a validated and widely accepted economic measure, the Herfindahl–Hirschman Index (HHI) [34]. The HHI was calculated as the sum of the squares of the individual hospital market shares (proportion of a hospital's admission days to total admission days for all hospitals in the region where a hospital is located). The HHI ranges from 0 to 1; lower values indicate a more competitive market. Regional household incomes were imputed from national statistics by assigning decedents' primary hospital the household median income for the hospital's region. Regional household incomes were stratified by quartile. Regional EOL care practice patterns (EOL care intensity) were measured by the regional EOL‐EI [33]. Regional EOL‐EI was calculated for each hospital by methods described for the primary hospital level and aggregated to each region where a decedent's primary hospital was located. The mean regional adjusted spending for cancer decedents in their last 6 months of life was further stratified by quintile.
Statistical Analysis
To investigate the relationships between EOL care expenditures and patient‐, hospital‐, and regional‐level characteristics, we estimated a multiple linear regression model using the generalized estimating equation method [35], with robust standard errors accounting for correlation in the error term due to clustering of individuals in the same hospital so that clinicians may share same hospital microclimates/cultures for clinical practices. Because health care expenditures are skewed rather than normally distributed, we estimated the generalized linear model with a log link function and gamma distribution by SAS GENMOD procedure to smooth their distributions in statistical estimation [36]. Gamma coefficients generated by the regression model were exponentiated to retransform them into rate ratio (RR) estimates [28]. Due to the large sample size, statistical significance was set at p ≤ .001 to avoid Type I error.
Results
Mean annual EOL care expenditures for Taiwanese cancer decedents increased over the 2001–2010 period from U.S. $49,591 to U.S. $68,773 (Table 1). Similarly increasing patterns of health care expenditures were observed for the last 1, 3, and 6 months of life (Fig. 2). Correspondingly, total EOL care expenditures in each year escalated from U.S. $1,635,898,738 to U.S. $2,822,572,597. EOL care spending was highly concentrated in the last few months, as evident by total EOL care expenditures incurred in the last 1, 3, and 6 months of 32.9%, 52.2%, and 72.5%, respectively.
Figure 2.

Trends in mean health care expenditures for Taiwanese cancer decedents' last 1, 3, 6, and 12 months of life, 2001–2010.
EOL care expenditures for Taiwanese cancer patients escalated linearly from 2001 through 2010 (Table 2). Cancer patients who died in 2010 consumed 40% (RR [95% confidence interval (CI)]: 1.40 [1.37–1.44]) more EOL care expenditures than those who died in 2001. Increased expenditures were associated with male gender (RR [95% CI]: 1.02 [1.01–1.02]). Lower EOL care expenditures were associated with older age (RR [95% CI]: 1.14 [1.12–1.16] to 1.44 [1.41–1.48]), and this relationship was dose dependent. Expenditures were less for divorced/separated (RR [95% CI]: 0.94 [0.93–0.96]) or widowed (RR [95% CI]: 0.93 [0.93–0.94]) patients at EOL than for those who were married.
Decedents' EOL care expenditures were also significantly correlated with disease characteristics (Table 2). Patients diagnosed with hepatic‐pancreatic cancer consumed 14% fewer (RR [95% CI]: 0.86 [0.84–0.88]) EOL care expenditures than lung cancer patients, whereas all other cancer patients except gastric cancer patients consumed more. Cancer patients with metastatic disease (RR [95% CI]: 0.97 [0.96–0.98]) and those with more concurrent chronic diseases (RR [95% CI]: 0.90 [0.88–0.92] to 0.95 [0.93–0.96]) incurred 3%–10% fewer expenditures in their last year of life. Cancer patients who died within 6 months of diagnosis incurred 11%–41% fewer EOL care expenditures (RR [95% CI]: 0.59 [0.58–0.60] to 0.89 [0.87–0.90]) than those who died 2 years after diagnosis, but those who died within 7–24 months of diagnosis consumed 12%–21% more (RR [95% CI]: 1.12 [1.11–1.13] to 1.21 [1.20–1.23]).
EOL care expenditures were influenced by patients' primary hospital characteristics, health care resources, and EOL care practice patterns (Table 2), but not by hospital ownership and bed size. Cancer patients who received care from surgeons, pulmonologists, and pediatricians consumed 7%–36% more EOL care expenditures (RR [95% CI]: 1.07 [1.03–1.11] to 1.36 [1.21–1.54]) than those cared for by oncologists, whereas those receiving care from gastroenterologists, intensivists, and other specialists not specified in this study consumed 8%–16% fewer expenditures (RR [95% CI]: 0.84 [0.82–0.87] to 0.92 [0.90–0.95]). Patients consumed 6%–14% fewer EOL care expenditures if they received care at teaching hospitals (RR [95% CI]: 0.94 [0.91–0.97]) and at hospitals with larger case volumes of terminally ill cancer patients (RR [95% CI]: 0.86 [0.81–0.91] to 0.92 [0.87–0.96]). In contrast, cancer patients who received care at a hospital with an EOL‐EI of 2–5 consumed 1.21–1.54 times more expenditures (RR [95% CI]: 1.21 [1.18–1.24] to 1.54 [1.47–1.62]) than those who received care at a hospital with an EOL‐EI of 1.
Higher EOL care expenditures were associated with regional EOL care practice patterns but not with regional health care resources and market characteristics (Table 2). Cancer patients who received care at a hospital in a region with an EOL‐EI of 3–5 consumed 5%–11% more (RR [95% CI]: 1.05 [1.02–1.07] to 1.11 [1.06–1.15]) expenditures than those who received care at a hospital in a region with an EOL‐EI of 1.
Discussion
Taiwanese cancer decedents in their last year of life consumed considerable NHI expenditures in general (4.00%–4.56% of total health care expenditures, average: 4.34%; Table 1) and, specifically, a majority of cancer‐care expenditures. Approximately one half to three fourths (49.52%–71.29%, average: 60.49%) of Taiwan's NHI expenditures for cancer care were attributable to roughly one tenth (8.21%–10.41%, average: 9.49%) of cancer patients who died in 2001–2010 (Table 1). Furthermore, such expenditures accelerated substantially from 2001 to 2010 (Table 2), consistent with the increasing trend for U.S. Medicare beneficiaries [37]. However, the mean per‐capita expenditure for all health care services in both Taiwanese cancer decedents' last 6 months (U.S. $48,276) and 30 days of life (U.S. $20,709; Fig. 2) was higher than hospital expenditures only (U.S. $10,033–$23,333 and $3,646–$10,843, respectively) for any of the six developed non‐U.S. countries surveyed in 2010 (data shown from the reported Table 4) [20].
The remarkably higher EOL care expenditures observed for Taiwanese cancer patients may be partially attributed to our use of all‐inclusive spending across services (inpatient, outpatient, ED, and home care) and health care systems in contrast to hospital expenditures only for the six developed countries [20]. Taiwan NHI's fee‐for‐service reimbursement system also contrasts with the global, lump‐sum payments (with or without diagnosis‐related groups) or per‐patient payments by diagnosis‐related group for the six developed countries [20]. Most importantly, the high EOL care expenditures for Taiwanese cancer patients may be related to the heavily aggressive EOL care they receive [27], [38]. This more aggressive care in our participants' last month of life is shown by (a) overwhelming inpatient care (acute‐care hospitalization: 93.5% versus 43.7%–63.9% for the six developed countries [20]; ≥2 hospitalizations: 17.1%; ≥14 days of hospitalization: 58.7%); (b) extensive life‐sustaining treatments (≥1 intensive care unit [ICU] admission: 25.6% versus 3.8%–11.2% for the six developed countries [20]; cardiopulmonary resuscitation: 5.5%; intubation: 15.8%; and mechanical ventilation support: 21.4%); (c) multiple ED visits (21.6% versus 27.5%–57.6% ever visited the ED for the six developed countries) [20]; and (d) continuation of chemotherapy (16.6% versus 6.0%–16.0% for the six developed countries) [20] and high prevalence of hospital death (79.5% versus 29.4%–54.1% for the six developed countries) [20].
The spending in the last year of life is often viewed as a measure of treatment intensity at EOL [33], [37]. Indeed, EOL care expenditures for our cancer patients were highly concentrated in their last month (one third of total expenditures in the last year of life). Similar patterns were reported for U.S. Medicare beneficiaries [39] and cancer patients in the U.S. [17], Belgium [8], Israel [9], and Australia [11]. Heavily aggressive EOL care treatments for Taiwanese cancer patients may have accounted for their huge EOL care expenditures being concentrated in their last month. With economic pressures on accelerating health care costs and calls for reform, stakeholders should focus attention on controllable and medically futile causes of increased expenditures to avoid the physical suffering, emotional burden, failed expectations, and financial costs of aggressive EOL care.
Consistent with the literature, our study identified (a) facilitative determinants of increased EOL care expenditures as male gender [5], [9], [11], [19], younger age [7], [8], [11], [19], [40], being married [41], diagnosis with hematological malignancies, esophageal, colorectal, and head and neck cancer [5], [7], [17], [19], and dying within 7–12 months of diagnosis [10], [19], with (b) the impeding determinant as diagnosis with hepatic‐pancreatic cancer [7], [17]. We also found that death within 6 months of diagnosis was associated with lower EOL care expenditures, suggesting that these patients were relatively healthy until they were diagnosed with an aggressive malignancy. The proportions of patients with hepatic‐pancreatic, lung, hematological, esophageal, and gastric cancer dying within 6 months of diagnosis were 39.7%–47.5%, whereas only 6.7%–24.9% of patients with breast, prostate, head and neck, and colon‐rectal cancer died within 6 months of diagnosis (data not shown). Having an aggressive malignancy may limit patients' ability to survive the assaults of the disease and its initial treatments and live long enough to receive more advanced treatments (e.g., higher lines of chemotherapy or targeted therapies that tend to undergo a lengthy approval process for reimbursement by the Taiwanese NHI). Thus, such patients would consume fewer health care resources and EOL care expenditures in their last year of life. Indeed, EOL care expenditures for these patients were substantially more highly concentrated in their last 6 months than those for our whole sample (total EOL care expenditures incurred in the last 1, 3, and 6 months were 50.7% versus 32.9%, 76.1% versus 52.2%, and 92.0% versus 72.5%, respectively [data not shown]).
However, our findings that cancer patients with higher comorbidities and metastatic disease consumed fewer EOL care expenditures were not totally consistent with the literature. Medicare and Medicaid EOL care expenditures have been reported as greater [10], [18], [19], [40] or lower [42] with higher comorbidity scores. More expenditures have been documented when caring for cancer patients in their last year if they were initially diagnosed with a late‐stage disease [5], [19]. Our findings of lower EOL care expenditures for cancer patients with higher comorbidities and metastatic disease may reflect Taiwanese physicians' tendency to treat cancer patients less aggressively if they have a high disease burden or are at EOL [6].
Lower EOL care expenditures were associated with Taiwanese cancer patients' primary physician specializing in medical oncology. This finding is likely due to oncologists' experience and beliefs. For example, differences in physicians' beliefs about the efficacy of certain discretionary treatments explained the largest proportion of geographic variation in EOL care spending [43]. Oncologists have more frequent contact with death than most other physician specialists [44]. With more experience in caring for terminally ill cancer patients, oncologists are more willing than other specialists to forgo mechanical ventilation for these patients [44] and less frequently use cardiopulmonary resuscitation, ventilator support, or ICU care [45]. Gastroenterologists and intensivists may spend less for their patients at EOL because their disease is too severe (i.e., hepatic‐pancreatic cancer) or too critical (i.e., newly diagnosed with highly progressive cancers requiring ICU care) for extensive cancer treatments. However, such speculations warrant further validation.
EOL care expenditures were lower for Taiwanese cancer patients receiving care in a teaching hospital. In Taiwan, the hospice movement was initiated by health care professionals at teaching hospitals, where it was rapidly integrated into cancer care. Thus, physicians affiliated with teaching hospitals may be predisposed to adopt hospice philosophy when caring for terminally ill cancer patients. Similarly, receiving care in a U.S. teaching hospital increased the likelihood of receiving hospice care at EOL [6]. Our findings confirm the role of teaching hospitals in facilitating decreasing EOL care expenditures.
Lower EOL care expenditures were also associated with a higher hospital case volume of terminally ill cancer patients, outweighing traditional hospital structural characteristics such as ownership or bed size. Our findings confirm that “practice makes perfect.” Volume–outcome relationships at the hospital level have been established for complicated cancer surgeries [46], [47] and for quality of EOL care, including pain management and avoiding ICU use at EOL [32].
We found that higher EOL care intensity at the regional level, as indicated by the EOL‐EI, was associated with higher EOL care expenditures, consistent with evidence from the U.S. [42], [48], and outweighed the influence of market characteristics and health care resources, such as regional household income levels, hospital competition, and bed size. Our results extend this line of evidence to the primary hospital level, as reported [49]. To minimize the unsustainable costs of health care, hospitals have been suggested as more accountable organizations because they exert more local control over decisions to use intensive treatments and expensive technology [50]. To reduce unnecessary EOL care spending, clinical and financial interventions should target hospitals and their physicians to foster efficient coordination and integration of palliative care into the cancer care continuum [51], thereby transforming health care systems into affordable, high‐quality cancer care delivery systems [1].
The strengths of this study lie in its population‐based approach and its focus on a recent decade‐long period to analyze trends and determinants of EOL care expenditures. Comprehensive data were available for this analysis on spending across services and health care systems. However, this analysis was restricted to expenditures from services covered by Taiwan's NHI; out‐of‐pocket expenditures and nursing home services were not included because they are not covered. This study did not address the quality or appropriateness of EOL care. Furthermore, the causality of the observed associations remains unaddressed in this observational study. Although our adjusted analyses simultaneously investigated patient, physician, hospital, and regional characteristics as well as EOL care practice patterns, we cannot exclude the possibility that our results are partly attributable to unmeasured patient characteristics such as cancer stage, EOL care preferences, functional dependence, and symptom distress [28], [42]; physician attitudes and practices towards EOL care [52]; physician volume; and hospital microclimates or cultures [53]. The roles played by these factors as potential sources of EOL care spending variations warrant investigation.
Conclusion
Taiwanese cancer patients consumed huge health care expenditures in their last year of life, and EOL care expenditures escalated substantially from 2001 to 2010. EOL care expenditures were strongly associated with case volume of terminally ill cancer patients and EOL care intensity at both the primary hospital and regional levels, outweighing traditional hospital structural characteristics, regional health care resources, and market characteristics. Our findings may provide insight into potential strategies for providing affordable, cost‐effective EOL cancer care. Effective interventions should target hospitals and their clinicians with less experience in providing EOL care and those that tend to provide aggressive EOL care to high‐risk cancer patients to facilitate evaluating the appropriateness of providing such care, thereby supporting patient preferences and decision‐making while reducing health care costs to achieve high‐quality EOL cancer care [1].
Acknowledgments
This study was funded by the Bureau of Health Promotion, Department of Health, Taiwan, R.O.C. (DOH1001205C) with partial support from National Health Research Institutes (NHRI‐EX105‐10208PI) and Chang Gung Memorial Hospital (BMRP888).
Author Contributions
Conception/Design: Yen‐Ni Hung, Tsang‐Wu Liu, Fur‐Hsing Wen, Wen‐Chi Chou, Siew Tzuh Tang
Provision of study material or patients: Siew Tzuh Tang
Collection and/or assembly of data: Siew Tzuh Tang
Data analysis and interpretation: Yen‐Ni Hung, Tsang‐Wu Liu, Fur‐Hsing Wen, Wen‐Chi Chou, Siew Tzuh Tang
Manuscript writing: Yen‐Ni Hung, Tsang‐Wu Liu, Fur‐Hsing Wen, Wen‐Chi Chou, Siew Tzuh Tang
Final approval of manuscript: Yen‐Ni Hung, Tsang‐Wu Liu, Fur‐Hsing Wen, Wen‐Chi Chou, Siew Tzuh Tang
Disclosures
The authors indicated no financial relationships.
References
- 1. Sullivan R, Peppercorn J, Sikora K et al. Delivering affordable cancer care in high‐income countries. Lancet Oncol 2011;12:933–980. [DOI] [PubMed] [Google Scholar]
- 2. Luengo‐Fernandez R, Leal J, Gray A et al. Economic burden of cancer across the European Union: A population‐based cost analysis. Lancet Oncol 2013;14:1165–1174. [DOI] [PubMed] [Google Scholar]
- 3. Mariotto AB, Yabroff KR, Shao Y et al. Projections of the cost of cancer care in the United States: 2010–2020. J Natl Cancer Inst 2011;103:117–128. [DOI] [PMC free article] [PubMed] [Google Scholar]
- 4.Department of Health. National Health Expenditures . 2012. Available at http://www.mohw.gov.tw/MOHW_Upload/doc/NHE%202011.pdf. Accessed July 2, 2016.
- 5. Yabroff KR, Lamont EB, Mariotto A et al. Cost of care for elderly cancer patients in the United States. J Natl Cancer Inst 2008;100:630–641. [DOI] [PubMed] [Google Scholar]
- 6. Earle CC, Landrum MB, Souza JM et al. Aggressiveness of cancer care near the end of life: Is it a quality‐of‐care issue? J Clin Oncol 2008;26:3860–3866. [DOI] [PMC free article] [PubMed] [Google Scholar]
- 7. Polder JJ, Barendregt JJ, van Oers H. Health care costs in the last year of life–the Dutch experience. Soc Sci Med 2006;63:1720–1731. [DOI] [PubMed] [Google Scholar]
- 8. Gielen B, Remacle A, Mertens R. Patterns of health care use and expenditure during the last 6 months of life in Belgium: Differences between age categories in cancer and non‐cancer patients. Health Policy 2010;97:53–61. [DOI] [PubMed] [Google Scholar]
- 9. Shmueli A, Messika D, Zmora I et al. Health care costs during the last 12 months of life in Israel: Estimation and implications for risk‐adjustment. Int J Health Care Finance Econ 2010;10:257–273. [DOI] [PubMed] [Google Scholar]
- 10. Tangka FK, Subramanian S, Sabatino SA et al. End‐of‐life medical costs of Medicaid cancer patients. Health Serv Res 2015;50:690–709. [DOI] [PMC free article] [PubMed] [Google Scholar]
- 11. Langton JM, Reeve R, Srasuebkul P et al. Health service use and costs in the last 6 months of life in elderly decedents with a history of cancer: A comprehensive analysis from a health payer perspective. Br J Cancer 2016;114:1293–1302. [DOI] [PMC free article] [PubMed] [Google Scholar]
- 12. Liu CN, Yang MC. National health insurance expenditure for adult beneficiaries in Taiwan in their last year of life. J Formos Med Assoc 2002;101:552–559. [PubMed] [Google Scholar]
- 13. Schnipper LE, Smith TJ, Raghavan D et al. American Society of Clinical Oncology identifies five key opportunities to improve care and reduce costs: The top five list for oncology. J Clin Oncol 2012;30:1715–1724. [DOI] [PubMed] [Google Scholar]
- 14. Wright AA, Zhang B, Ray A et al. Associations between end‐of‐life discussions, patient mental health, medical care near death, and caregiver bereavement adjustment. JAMA 2008;300:1665–1673. [DOI] [PMC free article] [PubMed] [Google Scholar]
- 15.Department of Health. End of Life Care Strategy 2008. Available at http://webarchive.nationalarchives.gov.uk/20130107105354/http://www.dh.gov.uk/prod_consum_dh/groups/dh_digitalassets/@dh/@en/documents/digitalasset/dh_086345.pdf. Accessed July 2, 2016.
- 16. Brooks GA, Li L, Sharma DB et al. Regional variation in spending and survival for older adults with advanced cancer. J Natl Cancer Inst 2013;105:634–642. [DOI] [PMC free article] [PubMed] [Google Scholar]
- 17. Chastek B, Harley C, Kallich J et al. Health care costs for patients with cancer at the end of life. J Oncol Pract 2012;8:75s–80s. [DOI] [PMC free article] [PubMed] [Google Scholar]
- 18. Koroukian SM, Beaird H, Madigan E et al. End‐of‐life expenditures by Ohio Medicaid beneficiaries dying of cancer. Health Care Financ Rev 2006;28:65–80. [PMC free article] [PubMed] [Google Scholar]
- 19. Hwang I, Shin DW, Kang KH et al. Medical costs and healthcare utilization among cancer decedents in the last year of life in 2009. Cancer Res Treat 2016;48:365–375. [DOI] [PMC free article] [PubMed] [Google Scholar]
- 20. Bekelman JE, Halpern SD, Blankart CR et al. Comparison of site of death, health care utilization, and hospital expenditures for patients dying with cancer in 7 developed countries. JAMA 2016;315:272–283. [DOI] [PubMed] [Google Scholar]
- 21. Lu TH, Lee MC, Chou MC. Accuracy of cause‐of‐death coding in Taiwan: Types of miscoding and effects on mortality statistics. Int J Epidemiol 2000;29:336–343. [DOI] [PubMed] [Google Scholar]
- 22.Bureau of Health Promotion. Cancer registry annual report , 2010. Taiwan [in Chinese]. Available at http://tcr.cph.ntu.edu.tw/uploadimages/CA15_LF99_20130412.pdf. Accessed July 2, 2016.
- 23.Bureau of National Health Insurance . Universal health coverage in Taiwan. Available at http://www.nhi.gov.tw/Resource/webdata/21717_1_20120808UniversalHealthCoverage.pdf. Accessed July 2, 2016.
- 24. Cheng CL, Kao YH, Lin SJ et al. Validation of the National Health Insurance Research Database with ischemic stroke cases in Taiwan. Pharmacoepidemiol Drug Saf 2011;20:236–242. [DOI] [PubMed] [Google Scholar]
- 25. Yu ST, Chang HY, Lin MC et al. Agreement between self‐reported and health insurance claims on utilization of health care: A population study. J Clin Epidemiol 2009;62:1316–1322. [DOI] [PubMed] [Google Scholar]
- 26. Tsan YT, Lee CH, Wang JD et al. Statins and the risk of hepatocellular carcinoma in patients with hepatitis B virus infection. J Clin Oncol 2012;20;30:623–630. [DOI] [PubMed] [Google Scholar]
- 27. Tang ST, Wu SC, Hung YN et al. Trends in quality of end‐of‐life care for Taiwanese cancer patients who died in 2000–2006. Ann Oncol 2009;20:343–348. [DOI] [PubMed] [Google Scholar]
- 28. Kelley AS, Morrison RS, Wenger NS et al. Determinants of treatment intensity for patients with serious illness: A new conceptual framework. J Palliat Med 2010;13:807–813. [DOI] [PMC free article] [PubMed] [Google Scholar]
- 29.International Bank for Reconstruction and Development/The World Bank . Purchasing Power Parities and the Real Size of World Economies: A Comprehensive Report of the 2011 International Comparison Program. Table 2.4 Purchasing Power Parities. Available at http://siteresources.worldbank.org/ICPEXT/Resources/2011-ICP-Global-Report.pdf. Accessed July 2, 2016.
- 30. Deyo RA, Cherkin DC, Ciol MA. Adapting a clinical comorbidity index for use with ICD‐9‐CM administrative databases. J Clin Epidemiol 1992;45:613–619. [DOI] [PubMed] [Google Scholar]
- 31. Whyte JL, Engel‐Nitz NM, Teitelbaum A et al. An evaluation of algorithms for identifying metastatic breast, lung, or colorectal cancer in administrative claims data. Med Care 2015;53:e49–e57. [DOI] [PubMed] [Google Scholar]
- 32. Morishima T, Lee J, Otsubo T et al. Impact of hospital case volume on quality of end‐of‐life care in terminal cancer patients. J Palliat Med 2013;16:173–178. [DOI] [PubMed] [Google Scholar]
- 33. Fisher ES, Wennberg DE, Stukel TA et al. The implications of regional variations in Medicare spending. Part 1: The content, quality, and accessibility of care. Ann Intern Med 2003;138:273–287. [DOI] [PubMed] [Google Scholar]
- 34. Hirschman AO. The paternity of an index. Am Econ Rev 1964;54:761–762. [Google Scholar]
- 35. Zeger SL, Liang KY, Albert PS. Models for longitudinal data: A generalized estimating equation approach. Biometrics 1988;44:1049–1060. [PubMed] [Google Scholar]
- 36. Grieve R, Nixon R, Thompson SG et al. Using multilevel models for assessing the variability of multinational resource use and cost data. Health Econ 2005;14:185–196. [DOI] [PubMed] [Google Scholar]
- 37. Riley GF, Lubitz JD. Long‐term trends in Medicare payments in the last year of life. Health Serv Res 2010;45:565–576. [DOI] [PMC free article] [PubMed] [Google Scholar]
- 38. Tang ST, Wu SC, Hung YN et al. Determinants of aggressive end‐of‐life care for Taiwanese cancer decedents, 2001 to 2006. J Clin Oncol 2009;27:4613–4618. [DOI] [PubMed] [Google Scholar]
- 39. Hoover DR, Crystal S, Kumar R et al. Medical expenditures during the last year of life: Findings from the 1992–1996 Medicare current beneficiary survey. Health Serv Res 2002;37:1625–1642. [DOI] [PMC free article] [PubMed] [Google Scholar]
- 40. Levinsky NG, Yu W, Ash A et al. Influence of age on Medicare expenditures and medical care in the last year of life. JAMA 2011;286:1349–1355. [DOI] [PubMed] [Google Scholar]
- 41. Cabrera‐Alonso J, Long MJ, Bangalore V et al. Marital status and health care expenditures among the elderly in a managed care organization. Health Care Manag (Frederick) 2003;22:249–255. [DOI] [PubMed] [Google Scholar]
- 42. Kelley AS, Ettner SL, Morrison RS et al. Determinants of medical expenditures in the last 6 months of life. Ann Intern Med 2011;154:235–242. [DOI] [PMC free article] [PubMed] [Google Scholar]
- 43. Fisher ES, Bynum JP, Skinner JS. Slowing the growth of health care costs–lessons from regional variation. N Engl J Med 2009;360:849–852. [DOI] [PMC free article] [PubMed] [Google Scholar]
- 44. Hinkka H, Kosunen E, Metsänoja R et al. Factors affecting physicians' decisions to forgo life‐sustaining treatments in terminal care. J Med Ethics 2002;28:109–114. [DOI] [PMC free article] [PubMed] [Google Scholar]
- 45. Liu TW, Chen JS, Wang HM et al. Quality of end‐of‐life care between medical oncologists and other physician specialists for Taiwanese cancer decedents, 2001–2006. The Oncologist 2009;14:1232–1241. [DOI] [PubMed] [Google Scholar]
- 46. Wouters MW, Gooiker GA, van Sandick JW et al. The volume‐outcome relation in the surgical treatment of esophageal cancer: A systematic review and meta‐analysis. Cancer 2012;118:1754–1763. [DOI] [PubMed] [Google Scholar]
- 47. Hata T, Motoi F, Ishida M et al. Effect of hospital volume on surgical outcomes after pancreaticoduodenectomy: A systematic review and meta‐analysis. Ann Surg 2016, 263:664–672. [DOI] [PubMed] [Google Scholar]
- 48. Nicholas LH, Langa KM, Iwashyna TJ et al. Regional variation in the association between advance directives and end‐of‐life Medicare expenditures. JAMA 2011;306:1447–1453. [DOI] [PMC free article] [PubMed] [Google Scholar]
- 49. Barnato AE, Chang CC, Farrell MH et al. Is survival better at hospitals with higher “end‐of‐life” treatment intensity? Med Care 2010;48:125–132. [DOI] [PMC free article] [PubMed] [Google Scholar]
- 50.Newhouse JP, Garber AM, Graham RP. et al. Variation in health care spending: Target decision making, not geography. Institute of Medicine; 2013. [PubMed] [Google Scholar]
- 51. Peppercorn JM, Smith TJ, Helft PR et al. American society of clinical oncology statement: Toward individualized care for patients with advanced cancer. J Clin Oncol 2011;29:755–760. [DOI] [PubMed] [Google Scholar]
- 52. Kross EK, Engelberg RA, Downey L et al. Differences in end‐of‐life care in the ICU across patients cared for by medicine, surgery, neurology, and neurosurgery physicians. Chest 2014;145:313–321. [DOI] [PMC free article] [PubMed] [Google Scholar]
- 53. Barnato AE, Tate JA, Rodriguez KL et al. Norms of decision making in the ICU: A case study of two academic medical centers at the extremes of end‐of‐life treatment intensity. Intensive Care Med 2012;38:1886–1896. [DOI] [PMC free article] [PubMed] [Google Scholar]