This challenge of intratumoral heterogeneity in cancer management is the focus of this article. Seven cases of invasive breast cancer with multiple axillary nodal metastases and/or recurrences for immunohistochemistry expression of the important biomarkers for breast cancer treatment decisions (estrogen receptors, progesterone receptors, HER2, and Ki67) are presented.
Keywords: Breast cancer, Tumor heterogeneity, Biomarker, Immunohistochemistry
Abstract
Intratumoral heterogeneity presents challenges in the management of cancer. To gain deeper insight in intratumoral heterogeneity at different levels and tumor sites for common biomarkers in breast cancers, this report examines seven cases of invasive breast cancer with multiple axillary nodal metastases and/or recurrences for immunohistochemical expression of estrogen receptors, progesterone receptors, human epidermal growth receptor 2, and Ki67 on all tissue blocks in both primary and metastatic tumors.
Introduction
Intratumoral heterogeneity has posed a tremendous challenge in cancer management. Patients with heterogeneous tumors have increased risk of progression [1]. Different subclones within a tumor may exhibit different drug sensitivities, resulting in treatment failure [2]. In breast cancer, estrogen receptors (ER), progesterone receptors (PR), human epidermal growth receptor 2 (HER2), and Ki67 are the important biomarkers for treatment decision. Intratumoral heterogeneity can lead to discordance in their expression between different samples from the same patient [3]. It raises concern on the validity of biomarker assessment, particularly in limited samples. Moreover, biomarker status obtained from the primary tumor may sometimes be used to guide management of metastatic disease, which may differ in expression due to clonal heterogeneity [4]. Current analysis for intratumoral heterogeneity is performed mainly qualitatively on primary tumors, and only regional differences in the same tumor (regional heterogeneity) are assessed [5], [6]. Apart from that, difference among tumor cells within the same regions (cellular heterogeneity) could exist, but it is seldom investigated. The heterogeneity status could also have clinical value in patient management. Heterogeneity in hormonal receptors and HER2 status, manifested as discordance between primary and metastatic sites, has been associated with significantly worse survival [7]. Also, patients with heterogeneous HER2 status in primary tumors showed significantly shorter disease‐free survival than those with homogeneous HER2 status [8]. The extent of heterogeneity may provide more precise additional information with clinical value.
Materials and Methods
To gain deeper insight in intratumoral heterogeneity at different levels and tumor sites for common biomarkers in breast cancers, we have examined seven cases of invasive breast cancer with multiple axillary nodal metastases and/or recurrences for immunohistochemical (IHC) expression of ER, PR, HER2, and Ki67 on all tissue blocks in both primary and metastatic tumors. Multiple regions (>30 regions per case totally) from the primary and paired metastatic tumors were randomly selected from digitally captured IHC images. The percentage of cells with low, moderate, and intense staining was recorded separately for heterogeneity index calculation. Heterogeneity indices for diversity measured in ecology (i.e., Rao's quadratic entropy [QE] and Shannon index) [9] were applied to evaluate heterogeneity in two levels: cellular heterogeneity and regional heterogeneity (supplemental online Fig. 1). The equation is as follows:
where N is the total number of categories, pi and pj are the proportion of the ith and jth categories, respectively, and dij is a member of the symmetric taxonomic distance matrix .
Shannon index of diversity is defined as Shannon = , where N is the number of tumor subtypes and pi the proportional abundance of the ith type. Regional heterogeneity measured differences between different tumor regions, whereas cellular heterogeneity measured variation between different cells within a region. Paired comparison of heterogeneity scores was performed using Wilcoxon test. Spearman's correlation was used to measure the relationship between QEreg and QEcell. (Further details are described in the supplemental online Appendix.)
Results and Discussion
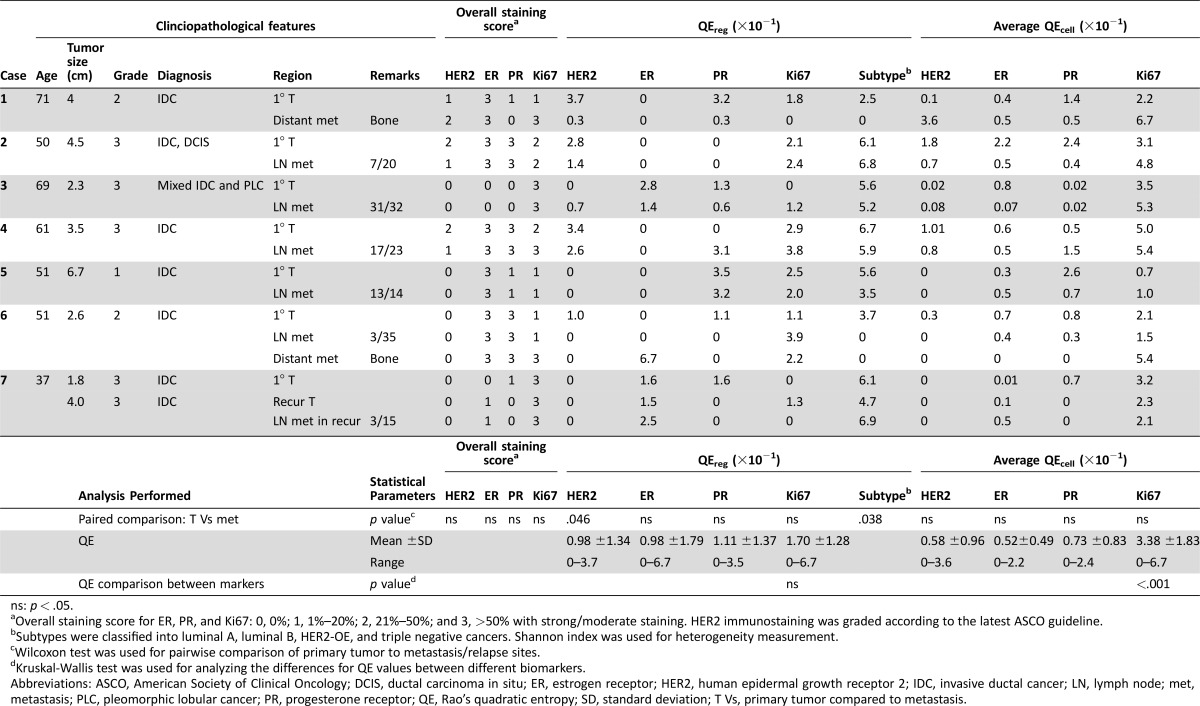
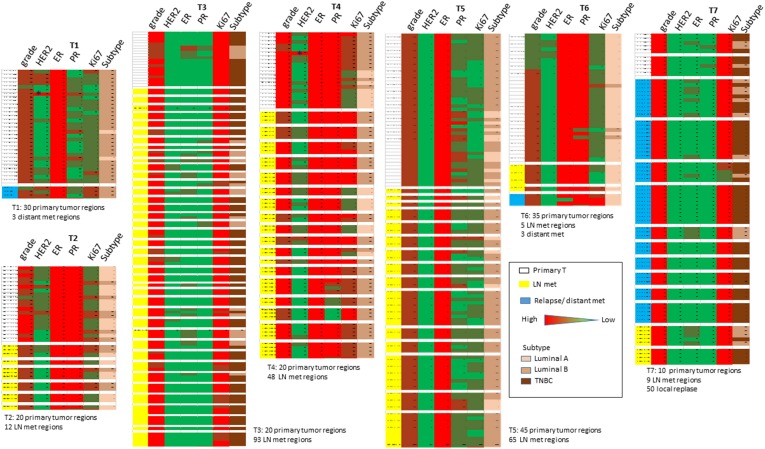
Clinicopathological features of the involved cases are summarized in Table 1. More than 400 regions were evaluated in total. Overall staining scores between primary and metastatic sites in all cases were similar, although metastatic tumors tended to have a lower PR and higher Ki67 expression (Table 1). Variability of biomarker expression was observed in different selected regions within the same tumor. For example, regions showing HER2 IHC3+ were noted for primary T1 and T4 tumors, which were classified as HER2 negative (Fig. 1). Similarly, for ER‐negative T3 and T7 tumors, regional ER expression could be observed. Although the degree of heterogeneity may not be great, samplings of different sites could have prompted different treatments, thus this “minor” heterogeneity could have a clinically significant implication. The beneficial effects of neoadjuvant treatment prompted more patients to undergo preoperative biomarker testing, in which a small amount of tissue was sampled by core needle biopsy. Regional differences detected in limited samples may not truly represent the entire tumor.
Table 1. Summary of clinicopathological features, staining results, and heterogeneity scores.
ns: p < .05.
Overall staining score for ER, PR, and Ki67: 0, 0%; 1, 1%–20%; 2, 21%–50%; and 3, >50% with strong/moderate staining. HER2 immunostaining was graded according to the latest ASCO guideline.
Subtypes were classified into luminal A, luminal B, HER2‐OE, and triple negative cancers. Shannon index was used for heterogeneity measurement.
Wilcoxon test was used for pairwise comparison of primary tumor to metastasis/relapse sites.
Kruskal‐Wallis test was used for analyzing the differences for QE values between different biomarkers.
Abbreviations: ASCO, American Society of Clinical Oncology; DCIS, ductal carcinoma in situ; ER, estrogen receptor; HER2, human epidermal growth receptor 2; IDC, invasive ductal cancer; LN, lymph node; met, metastasis; PLC, pleomorphic lobular cancer; PR, progesterone receptor; QE, Rao's quadratic entropy; SD, standard deviation; T Vs, primary tumor compared to metastasis.
Figure 1.
Schematic representation of regional biomarker expression in the selected cases. Asterisk indicates region of HER2 3+ score.
Abbreviations: ER, estrogen receptor; HER2, human epidermal growth receptor 2; LN, lymph node; met, metastasis; PR, progesterone receptor; TNBC, triple negative breast cancer.
To examine the extent in heterogeneity, we first assessed regional (QEreg) and cellular (QEcell) QE scores for each biomarker at different sites. Pairwise comparison between heterogeneity score between primary and metastatic tumors showed no significant differences in heterogeneity at both regional and cellular levels for most markers. However, when different regions were classified using IHC surrogate into subtype, the metastatic tumor demonstrated significantly less heterogeneity than primary tumors (p = .038; Table 1). The findings may support a preferential selection of subclonal populations at metastatic sites, resulting in its lower heterogeneity.
Comparing heterogeneity scores of different biomarkers, the highest QEreg was observed for Ki67. Similarly, QEcell for Ki67 was also the highest, with statistical significance (p < .001; Table 1). Its highest heterogeneity scores may implicate a greater chance of evaluation error during random sampling. Ki67 measurement has been applied to prognosis, treatment prediction, and treatment monitoring, particularly during neoadjuvant therapy. In this regard, a more extensive sampling may be required to reduce the impact of heterogeneity. On the other hand, information based on Ki67 staining from limited samples should be treated with caution. It is interesting to note that biomarker expression could have high QEcell but with similar low QEreg. We did not observe a significant correlation between QEcell and QEreg in the majority of the biomarkers and tumor sites (supplemental online Table 1). One could postulate a potentially different mechanistic basis for the two levels of heterogeneity. Two main models are currently proposed to explain intratumoral heterogeneity: clonal evolution theory and cancer stem cell theory. Regional heterogeneity in a tumor is underpinned by genetic heterogeneity showing a clonal genetic profile within morphologically similar regions [10]. Nevertheless, tumor heterogeneity is more than a reflection of genetic diversity. It can be due to the differences in differentiation hierarchies of cells within a tumor population, thus displaying substantial cell to cell variability [10]. Moreover, intratumoral heterogeneity in one marker may not reflect the same level of heterogeneity for the other. Further investigations are warranted to decipher the underlying mechanisms for different levels of heterogeneity and their distinct clinical relevance.
See http://www.TheOncologist.com for supplemental material available online.
Footnotes
For Further Reading: Libero Santarpia, Giulia Bottai, Catherine M. Kelly et al. Deciphering and Targeting Oncogenic Mutations and Pathways in Breast Cancer. The Oncologist 2016;21:1063‐1078.
Implications for Practice: Next‐generation sequencing is now widely available in the clinic, but interpretation of the results is challenging, and its impact on treatment selection is often limited. This work provides an overview of frequently encountered molecular abnormalities in breast cancer and discusses their potential therapeutic implications. This review emphasizes the importance of administering investigational targeted therapies, or off‐label use of approved targeted drugs, in the context of a formal clinical trial or registry programs to facilitate learning about the clinical utility of tumor target profiling.
Disclosures
The authors indicated no financial relationships.
Supplementary Information
References
- 1. Maley CC, Galipeau PC, Finley JC et al. Genetic clonal diversity predicts progression to esophageal adenocarcinoma. Nat Genet 2006;38:468–473. [DOI] [PubMed] [Google Scholar]
- 2. Swanton C. Intratumor heterogeneity: Evolution through space and time. Cancer Res 2012;72:4875–4882. [DOI] [PMC free article] [PubMed] [Google Scholar]
- 3. Tamaki K, Sasano H, Ishida T et al. Comparison of core needle biopsy (CNB) and surgical specimens for accurate preoperative evaluation of ER, PgR and HER2 status of breast cancer patients. Cancer Sci 2010;101:2074–2079. [DOI] [PMC free article] [PubMed] [Google Scholar]
- 4. Malinowsky K, Raychaudhuri M, Buchner T et al. Common protein biomarkers assessed by reverse phase protein arrays show considerable intratumoral heterogeneity in breast cancer tissues. PLoS One 2012;7:e40285. [DOI] [PMC free article] [PubMed] [Google Scholar]
- 5. Almendro V, Kim HJ, Cheng YK et al. Genetic and phenotypic diversity in breast tumor metastases. Cancer Res 2014;74:1338–1348. [DOI] [PMC free article] [PubMed] [Google Scholar]
- 6. Park SY, Gönen M, Kim HJ et al. Cellular and genetic diversity in the progression of in situ human breast carcinomas to an invasive phenotype. J Clin Invest 2010;120:636–644. [DOI] [PMC free article] [PubMed] [Google Scholar]
- 7. Lindström LS, Karlsson E, Wilking UM et al. Clinically used breast cancer markers such as estrogen receptor, progesterone receptor, and human epidermal growth factor receptor 2 are unstable throughout tumor progression. J Clin Oncol 2012;30:2601–2608. [DOI] [PubMed] [Google Scholar]
- 8. Seol H, Lee HJ, Choi Y et al. Intratumoral heterogeneity of HER2 gene amplification in breast cancer: Its clinicopathological significance. Mod Pathol 2012;25:938–948. [DOI] [PubMed] [Google Scholar]
- 9.Magurran AE, ed. Measuring Biological Diversity. Oxford, United Kingdom: Blackwell Publishing, 2004. [Google Scholar]
- 10. Marusyk A, Almendro V, Polyak K. Intra‐tumour heterogeneity: A looking glass for cancer? Nat Rev Cancer 2012;12:323–334. [DOI] [PubMed] [Google Scholar]
Associated Data
This section collects any data citations, data availability statements, or supplementary materials included in this article.


