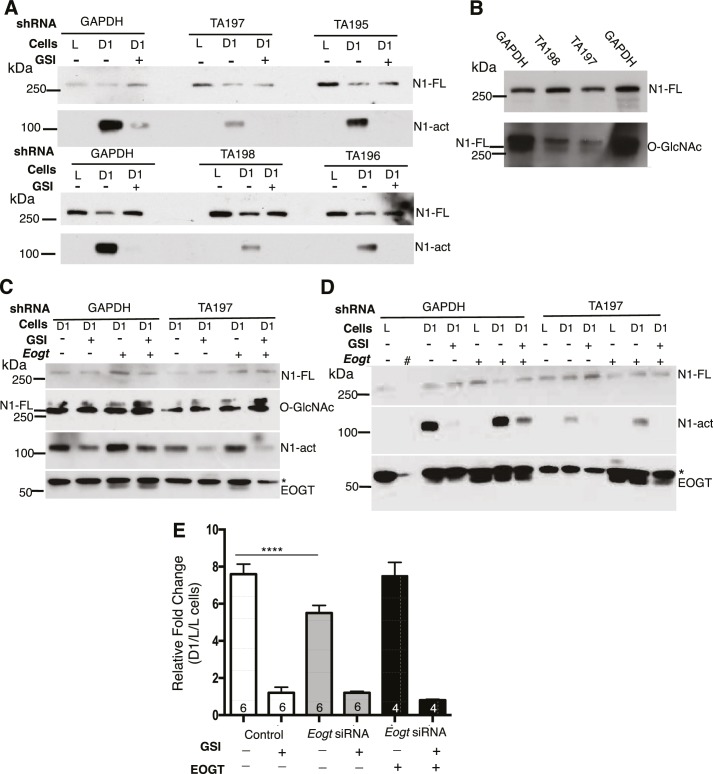
Figure 3. Notch signaling is reduced in EOGT-deficient cells.
(A) Knockdown of EOGT inhibits NOTCH1 activation cleavage. HeLa cells stably expressing shRNAs targeting GAPDH or EOGT (TA195, TA196, TA197, TA198) were co-cultured with L cells or D1/L (D1) cells in the presence and absence of 1 µM DAPT (GSI). After 6 hr, lysates were subjected to Western blot analysis using Abs to detect activated NOTCH1 (N1-act) and NOTCH1 full length (N1–FL) on the relevant section of the PVDF membrane. (B) Western blot analysis of samples from (A) using Ab to detect O-GlcNAc, followed after stripping by Ab to detect N1-FL. (C) HeLa cells stably expressing shRNA against GAPDH or EOGT (TA197) were transfected with vector control or a human EOGT cDNA. After 4 days, co-culture was performed with D1/L (D1) cells in the presence and absence of the DAPT. After ~7 hr, lysates were subjected to Western analysis to detect N1-FL, N1-act and EOGT on the relevant section of the PVDF membrane. O-GlcNAc was detected after stripping the N1-FL membrane section. * non-specific band. (D) The same as (C) except co-culture was with L cells or D1/L cells (D1). The second lane (#) was left empty. * non-specific band. (E) Knockdown of Eogt reduces ligand-induced Notch signaling. Lec1 CHO cells stably expressing siRNAs targeted against Eogt were transfected with TP1-luciferase and TK-renilla luciferase, co-cultured for 30 hr with L cells or D1/L cells, with and without GSI IX (12.5 μM) or a human EOGT cDNA, and dual firefly and renilla luciferase assays were performed. Normalized firefly luciferase activity in L versus D1/L cell co-cultures was plotted as fold-change. The number of independent experiments, each performed in duplicate, are shown in the histogram. Error bars are mean ± standard error and p values were determined by two-tailed paired Student’s t-test (****p<0.0001).
DOI: http://dx.doi.org/10.7554/eLife.24419.009

